

Abstract
The detailed functional organization of the macaque second somatosensory cortex (SII) is not well understood. Here we report the results of a study of the functional organization of the SII hand region that combines microelectrode mapping using hand-held stimuli with single-unit recordings using a motorized, computer-controlled tactile oriented bar. The data indicate that the SII hand region extends ∼10 mm in the anteroposterior (AP) dimension, primarily within the upper bank of the lateral sulcus. Furthermore, we find evidence that this region consists of multiple functional fields, with a central field containing neurons that are driven well by cutaneous stimuli, flanked by an anterior field and a posterior field that each contain neurons that are driven well by proprioceptive stimuli and less well by cutaneous stimuli. The anterior field extends ∼4-5 mm AP, the central field extends ∼3-4 mm, and the posterior field extends ∼3 mm. Data from the motorized stimulator indicate that neurons in the central field are more responsive to oriented bars, more frequently exhibit orientation tuning, and have larger receptive fields than neurons in the anterior and posterior fields. We speculate that the three putative fields play different functional roles in tactile perception; the anterior and posterior fields process information that involves both proprioceptive and cutaneous input such as sensorimotor integration or stereognosis, whereas the central field processes primarily cutaneous information.
Keywords: cortex, cutaneous, mapping, orientation, proprioceptive (myotactic), somatosensory, tactile
Introduction
The functional organization of the second somatosensory cortex (SII) of the macaque monkey is not well understood. There are conflicting reports of the number of areas that comprise this cortical region, which is primarily located in the upper bank of the lateral sulcus (UBLS) (see Fig. 1). Initially, Woolsey (1943) and Woolsey and Fairman (1946) reported that the macaque SII consists of a single area, and this was also reported in later studies (Friedman et al., 1980; Robinson and Burton, 1980a; Pons et al., 1988). However, Whitsel et al. (1969), and more recently Burton et al. (1995) and Krubitzer et al. (1995), suggested that SII consists of two areas. In addition, imaging studies in the human (Burton et al., 1993; Gelnar et al., 1998; Disbrow et al., 2000) and quantitative analysis of human cytoarchitecture (Zilles et al., 2003) suggest that the UBLS may contain up to four different somatosensory areas.
Figure 1.

Recording in the SII region. Lateral (left) and coronal (right) views of the brain are shown. The vertical dashed line indicates the coronal plane of the section. Arrows indicate the approximate AP extent of the SII hand region (dark gray area), which is located mainly in the UBLS. Right, Possible microelectrode penetrations made in and around the SII region. Penetrations a and b encountered neurons that were driven by somatosensory and sometimes visual stimulation, whereas penetrations c-e encountered neurons that were driven by auditory stimulation.
If there are multiple areas in the SII region, what functional roles do these areas play in perception? Previous neurophysiological studies have essentially ignored the anatomical distinctions within SII and lumped the neurons into a single category (Rowe et al., 1985; Hsiao et al., 1993; Jiang et al., 1997; Pruett et al., 2000; Salinas et al., 2000). It is therefore not surprising to see the variety of different response properties that have been attributed to SII neurons. For example, Salinas et al. (2000) reported minimal phase locking to vibratory stimuli, whereas Rowe et al. (1985) reported fine phase locking. Pruett et al. (2000) reported that the firing rates of neurons change monotonically with the texture of the stimuli, whereas Jiang et al. (1997) reported that the firing rates of neurons are related to the decision state of the animal, rather than to the texture of the stimuli.
Although some of the differences in the anatomical maps and physiological properties could be attributable to differences in species and behavioral state, it is clear that a map of the SII region coupled with quantitative measures of the neural responses might explain some of these differences. This is the first in a series of studies of the response properties of neurons in the SII region of the awake, behaving monkey (Macaca mulatta). We had three primary aims in these studies. The first was to determine whether the response properties of SII region neurons cluster into anatomically separate functional groups, which may indicate that this region consists of multiple representations. The second was to characterize the sizes and shapes of the receptive fields (RFs). The third was to characterize the orientation feature selectivity of the neurons.
Here we address the first aim: whether the response properties cluster into anatomically separate functional groups. We combined microelectrode mapping using hand-held stimuli with single-unit recordings in which we stimulated the finger pads using a computer-controlled oriented bar. We report here that the SII hand region is composed of at least three distinct fields, consisting of a central field driven effectively by cutaneous stimulation, flanked by two fields that are driven by proprioceptive, and to a lesser extent cutaneous, input.
Materials and Methods
Subjects. Five cortical hemispheres of three rhesus monkeys (M. mulatta), weighing 5-7 kg, were studied. Two of the monkeys were male (monkeys 16H and R1171), and one was female (monkey 2H). We recorded from both hemispheres of monkeys 16H and 2H and from the right hemisphere of monkey R1171 in the mapping study and from both hemispheres of monkeys 16H and 2H in the motorized oriented bar study.
All of the recordings were done while the monkeys were in a nearly constant state of alertness. Two monkeys (16H and 2H) were trained to perform a visual detection task. In this task, the monkey pressed a lever with its foot to obtain a liquid reward when a 2 × 2° box, presented on a video monitor, dimmed for 1.5 sec after a random interval of 2-5 sec. The monkeys required 2-3 months of training to perform the task at 90% correct or better. The third monkey (R1171) was kept alert by giving it food treats at regular intervals.
Monkeys 16H and 2H were also trained to sit still with their hands restrained during recording sessions that used the motorized oriented bar. The palm of each hand was secured to a hand-holding base using custom-molded thermoplastic (Smith & Nephew, Memphis, TN). The individual fingers were then secured by gluing (PIC/PIC Apart; MCM Electronics, Centerville, OH) the fingernails to the base. When fully secured, the hand was supinated with the glabrous skin of digits 2-5 (D2-D5) exposed and these digits extending straight forward. Restraining the hand allowed the stimulator to stimulate the digits in an accurate and repeatable manner. Digit 1 was not studied using the stimulator because it was not possible to comfortably hold this digit flat against the hand-holder.
Surgery. Before the microelectrode recordings, surgery was performed to secure a head-holding device and recording chambers to the skull. Surgical anesthesia was induced with ketamine HCl (20 mg/kg, i.m.) and maintained with pentobarbital (10-25 mg · kg-1 · hr-1, i.v.). All surgical procedures were done under sterile conditions and in accordance with the rules and regulations of the Johns Hopkins Animal Care and Use Committee and the Society for Neuroscience.
General recording techniques. All recordings were performed with the monkeys in an awake, unanesthetized state. On each day of recording, a multielectrode microdrive (Mountcastle et al., 1991) was loaded with seven quartz-coated platinum/tungsten (90:10) microelectrodes (shaft diameter, 80 μm; tip diameter, 4 μm; impedance, 1-5 MΩ at 1000 Hz). On approximately half of the recording days, four of the seven microelectrodes were coated with one of two fluorescent dyes (DiI or DiD; Molecular Probes, Eugene, OR) to facilitate later histological localization of the recording sites (DiCarlo et al., 1996). For the recordings, the tip of the microdrive was inserted into the recording chamber (19 mm diameter) and oriented with the microelectrodes normal to the dura mater. The seven microelectrodes were arranged mediolaterally, with center-to-center spacings of 400 μm. On each recording day, the microelectrodes were positioned within the recording chamber using a guide tube that was positioned using a pair of micrometer-controlled translation stages (model 430; Newport, Irvine, CA) (accuracy within 5 μm).
Our first step in recording was to use a stereotaxic instrument (David Kopf Instruments, Tujunga, CA) to center the recording chamber over the lateral sulcus [Horsley-Clarke (HC) coordinates: anterior 6; lateral 28]. We then located the lateral sulcus based on the neural responses encountered as the microelectrodes passed through the gray or white matter. Penetrations made just medial to the sulcus (Fig. 1, penetrations a, b) encountered neurons driven by somatosensory (SI, area 7b, or SII region) or visual (area 7b) input (Mountcastle et al., 1975). Penetrations aligned with or lateral to the sulcus entered either the lower bank of the lateral sulcus (LBLS) (Fig. 1, penetrations c, d) or the superior temporal gyrus (Fig. 1, penetration e) and encountered auditory activity. Postmortem histological analysis of the fluorescent dye tracks confirmed that these were reliable indicators of the location of the lateral sulcus.
Once the location of the lateral sulcus was determined, we systematically moved the center of the guide tube until the microelectrodes were either anterior or posterior to the SII hand region. Each day thereafter, the recording position was moved 100-1000 μm in the same anteroposterior (AP) direction until all or most of the hand region had been studied. The recording location was moved from anterior to posterior in the right hemisphere of monkey 16H and in the left hemisphere of monkey 2H and was moved from posterior to anterior in the other three hemispheres. In addition to the daily adjustments in the AP position of the microelectrode array, the mediolateral (ML) coordinate was also adjusted to keep the recording array in the UBLS.
Mapping study. Between 18 and 45 d were spent recording in each of the five hemispheres. For each penetration, records were taken approximately every 500 μm as the microelectrodes were driven into the cortex. Multiunit and single-unit records were taken using hand-held stimulation of both sides of the body. Generally, neurons with bilateral input had similar RF locations on both sides of the body. The maps that we report here came only from the contralateral responses. We tested cutaneous sensitivity by brushing or indenting the glabrous and hairy skin using blunt probes. We also tested for orientation sensitivity using a hand-held oriented bar. Sensitivity to proprioceptive input was tested using three kinds of manipulations: (1) passive extension, flexion, and torsion of joints; (2) maintaining the joints in different conformations; and (3) observing active movement in which the animal reached for and manipulated objects. Neurons were not tested for sensitivity to vibratory, thermal, or nociceptive stimuli.
Motorized oriented bar study. Recordings lasted between 35 and 45 d in each of the four hemispheres. Neurons were isolated using a template-based spike sorter (Multi Spike Detector; Alpha Omega, Nazareth, Israel). Only neurons that were well isolated were included in the analysis.
The tactile stimulator (Fig. 2 A) consisted of a Chubbuck linear motor (Chubbuck, 1966) mounted on the shaft of a rotating stepper motor (type M061-FD08; Superior Electric, Bristol, CT), which was attached to a three-axis translation stage. Each axis consisted of a linear translation stage (440 Series; 50 mm travel; Newport) that was moved by turning a threaded shaft with a stepper motor (types M061-LE06 and M061-LE08; 200 steps/revolution; 5 μm resolution; Superior Electric). The Chubbuck motor and the four stepper motors were controlled by a Pentium personal computer. With this stimulator, we were able to position and orient the bar at arbitrary locations above the monkey's hand, with an accuracy of 5 μm and 1.8°. Recording sessions began with a calibration period during which the three-dimensional coordinates of the center of each of the 12 finger pads were determined and entered into the computer. The oriented bar was machined from plastic (Altem). The bar was approximately the width of a monkey's finger and had rounded ends; its short axis was a 90° wedge, and its long axis was circular with an 8 mm radius. A wedge-shaped bar was used because it produced a crisp sensation of the edge of a surface; a long axis, circular shape, produced a constant contact area independent of the orientation of the bar on the finger.
Figure 2.

Stimulator and stimulation protocol. A, The stimulus bar was mounted on the end of a Chubbuck linear motor that could be rotated by a stepper motor. This assembly was positioned over the monkey's hand using a three-axis translation stage driven by stepper motors. B, The bar was pressed into the center of the distal (d), medial (m), and proximal (p) pads of digits 2-5 (D2-5) of the hand contralateral to the recorded cortical hemisphere. The pad and orientation presentation sequences were randomized (8 repetitions of each of the 8 22.5° separated orientations for each of the 12 pads). For each presentation, the bar was indented into the skin with a force of 10 gm for 500 msec.
During stimulation, the bar was indented into the skin at the center of the distal, medial, and proximal pads of D2-5 of the hand contralateral to the recorded cortical hemisphere (Fig. 2 B). For each stimulus, the bar was presented at one of eight 22.5° separated orientations and was indented with 10 gm of force for 500 msec, with an interstimulus interval of 1 sec. There were eight repetitions of each of the eight orientations for each of the 12 finger pads for a total of 768 stimuli.
Stimuli were presented in a pseudorandom order to minimize the time spent traveling between finger pads. After stimulating a pad with a random sequence of two repetitions of each of the eight orientations, the stimulator moved the bar to a randomly chosen neighboring finger pad. This sequence was repeated until each pad had been presented with eight repetitions of each of the eight orientations.
Construction of maps. After the recordings were completed, each monkey was deeply anesthetized with sodium pentobarbital (150 mg/kg, i.v.) and perfused transcardially with phosphate buffer, followed by cold, phosphate-buffered 3% paraformaldehyde, pH 7.4. The brain was blocked, and the block containing the SII region was punctured with a needle in the AP dimension to produce reference markers. Frozen coronal tissue sections (40 μm) were mounted on glass slides but not stained. Microelectrode tracks were visualized using fluorescent dye traces left by each microelectrode (DiCarlo et al., 1996). The microelectrode tracks and borders of every fourth section were traced into a computer using Neurolucida (MicroBrightField, Williston, VT). The Neurolucida files were then loaded into AutoCAD (Autodesk, San Rafael, CA), and each section was aligned via the reference markers. If the reference markers were not apparent in a section, that section was repositioned in AutoCAD with respect to the rest of the tissue block. Next, the entire set of penetration locations of the hemisphere was determined from the database, and this ideal set of parallel trajectories was positioned and aligned with respect to the tissue block. Then, the multiunit records were displayed along each microelectrode track and shifted until the record of cortical surface neural activity of each microelectrode was aligned with the surface of each tissue section. Each multiunit record was then projected onto the closest point of the pial surface of each tissue section. Next, in each section the following fundi were marked: (1) the junction between the surface cortex and the UBLS; (2) the junction between the UBLS and the insula; (3) the junction between the insula and the LBLS; and (4) the junction between the LBLS and the surface cortex. (Posterior to the insula, only the inner fundus of the lateral sulcus was marked.) The sections were then unfolded and aligned along the inner fundus of the lateral sulcus to produce the final maps. Here we refer to ML dimensions based on the unfolded lateral sulcus.
Single-unit data analysis. Responsiveness of each neuron to the motorized oriented bar was assessed in a two-step manner. In the first step, each of the 12 stimulated finger pads was tested for orientation tuning with a one-way ANOVA on the firing rates evoked during the 500 msec presentation of each of the eight 22.5° separated orientations (overall p < 0.05; Bonferroni corrected for 12 comparisons). In the second step, each untuned finger pad was tested to see whether it was driven (by either excitation or inhibition) by pooling the data from all eight orientations and comparing the mean spontaneous firing rate (500 msec interval before stimulus onset) with the mean rate evoked during the 500 msec presentation of the oriented bar (unpaired two-tailed t test; overall p < 0.05; Bonferroni corrected for up to 12 comparisons).
We computed eight measures of RF size (see Fig. 7). In the first measure, we computed the number of responsive fingers for each neuron, which could range from zero to four because we only stimulated fingers 2 through 5. A finger was classified as responsive if any of its three pads was responsive. To compute the mean number of responsive fingers per AP location, we averaged the number of fingers for those neurons within each bin that had one or more responsive fingers. In the second measure, we computed the mean number of responsive finger pads instead of fingers and only included neurons with one or more responsive finger pads. In the third measure, we computed the mean number of tuned pads for all neurons that had one or more tuned pads. The fourth measure was similar, except that it included the number of tuned pads divided by the total number of neurons in each bin. In the fifth measure, we computed the mean number of untuned excitatory pads for those neurons that had one or more untuned excitatory pads. The sixth measure was similar, except that it included the number of untuned excitatory pads divided by the total number of neurons in each bin. The seventh and eighth measures were similar to the fifth and sixth, respectively, except that they examined untuned inhibitory pads.
Figure 7.
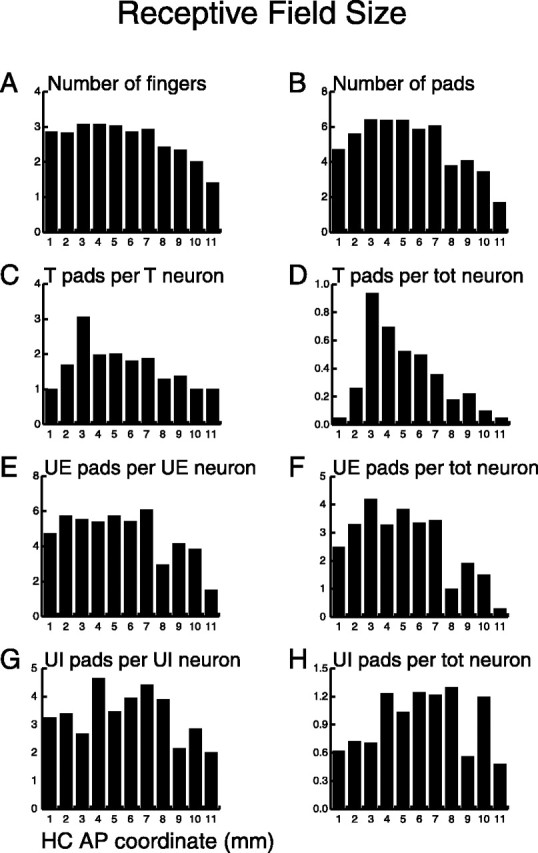
Distribution of RF size along the AP axis. A, Mean number of responsive fingers for neurons in each bin that had one or more responsive pads. B, Mean number of responsive pads for neurons in each bin that had one or more responsive pads. C, Mean number of tuned (T) pads per tuned neuron in each bin. D, Mean number of tuned pads per total (tot) neurons in each bin. E, Mean number of untuned excitatory (UE) pads per untuned excitatory neuron in each bin. F, Mean number of untuned excitatory pads per total neurons in each bin. G, Mean number of untuned inhibitory (UI) pads per untuned inhibitory neuron in each bin. H, Mean number of untuned inhibitory pads per total neurons in each bin. Distributions A, B, D, and F were fit well by Gaussians (p < 0.001).
We computed a single measure of RF shape called contiguity for neurons with two or more responsive pads (see Fig. 8). In this measure, an RF was considered contiguous if all responsive pads were interconnected (within the 3 × 4 grid of stimulated pads) such that no pad or group of pads was separated from the remaining group or groups by spatially intervening unresponsive pads. Diagonally bordering pads were considered contiguous. Thus, for example, D2d and D3m were considered contiguous, but D2d and D3p were not.
Figure 8.

Distribution of RF shape along the AP axis. Shown is the number of neurons with contiguous RFs divided by the total number of neurons in each bin with two or more responsive pads. An RF was defined as contiguous if all responsive pads were interconnected (within the 3 × 4 grid of stimulated pads) such that no pad or group of pads was separated from the remaining group or groups by spatially intervening unresponsive pads. Diagonally bordering pads were considered contiguous.
We computed four measures of firing rate (see Fig. 9). The peak firing rate for a tuned neuron was the average of the peak firing rate of each of its tuned pads, in which the peak firing rate for a tuned pad was the rate evoked at the preferred (highest rate) bar orientation minus the spontaneous firing rate. The mean firing rate for an untuned excitatory neuron was defined as the average of the mean rate of each of its untuned excitatory pads, in which the mean rate of each untuned excitatory pad was the mean rate evoked by all eight bar orientations minus the spontaneous firing rate. The mean firing rate for an untuned inhibitory neuron was calculated in a similar manner. Finally, the spontaneous firing rate for a neuron was the mean firing rate during the 500 msec interval before all oriented bar stimuli.
Figure 9.

Distribution of firing rate along the AP axis. A, Mean peak firing rate of neurons with tuned (T) pads. The firing rate was calculated for the preferred (highest rate) bar orientation of each tuned pad. The peak rates were then averaged across all tuned pads of each neuron. B, Mean firing rate of neurons with untuned excitatory (UE) pads. The mean firing rate (averaged across all 8 bar orientations) was calculated for each untuned excitatory pad and then averaged across all untuned excitatory pads. C, Mean firing rate of neurons with untuned inhibitory (UI) pads. The rates in A-C are deviations from the spontaneous firing rate. D, Mean spontaneous (spont) firing rate of all neurons. Distributions B and D were fit well by Gaussians (p < 0.001).
We computed two measures of orientation tuning (see Fig. 11). The aspect ratio was defined as the firing rate of the preferred orientation-worst orientation/preferred orientation of each tuned pad. A value of 1.0 indicates that a neuron was perfectly tuned, and a value of 0.5 indicates that the rate at the preferred orientation was twice the rate at the worst orientation. Bandwidth was defined as the width (in degrees) at half peak of the tuning curve for each tuned pad. The aspect ratio and bandwidth were averaged across all tuned pads for each neuron.
Figure 11.

Distribution of aspect ratio and bandwidth along the AP axis. A, Mean aspect ratio of tuned neurons. The aspect ratio [(preferred orientation rate-worst orientation rate)/preferred orientation rate] was calculated for each tuned pad and then averaged across all tuned pads of each neuron. B, Mean bandwidth of tuned neurons. Bandwidth (width at half peak of the tuning function) was calculated for each tuned pad and then averaged across all tuned pads of each neuron.
We tested the null hypothesis that the data from Figures 6, 7, 8, 9, 10, 11 were distributed uniformly along the AP axis of the SII hand region using four statistical tests: (1) a Kolmogorov-Smirnov test of uniformity; (2) a test of uniformity based on t tests; (3) linear regression; and (4) Gaussian nonlinear regression. Tests 1, 3, and 4 used the individual data points, in which the independent variable was the HC AP position and the dependent variable was the relevant measure for each neuron, rather than the mean value for each 1000 μm bin. Test 2 checked for differences in the mean value between each of the 11 1000 μm bins and the global mean (of all data points), so for each neuron the independent variable indicated one of the 11 AP bins, and the dependent variable was the relevant measure for each neuron. This test generated a p value for each of the 11 bins using an unpaired, two-tailed t test; therefore, a plot could be considered significantly different from uniform if one or more of its bins had p < 0.0047, in which the overall p < 0.05 is Bonferroni corrected for 11 comparisons. (We used this test instead of a one-way ANOVA because there were unequal numbers of data points in each bin.) For test 4, the Gaussian had the following free parameters: mean, amplitude, and horizontal asymptote. Each Gaussian could either be upright (positive amplitude) or inverted (negative amplitude), depending on which fit the data better. The SD was restricted to values >2 mm, because the SII fields are probably several millimeters in AP extent and this restriction captures the global features of the data. The p values for all four tests are shown in Table 1, where the p value for test 2 is the lowest of the 11 p values for each plot.
Figure 6.
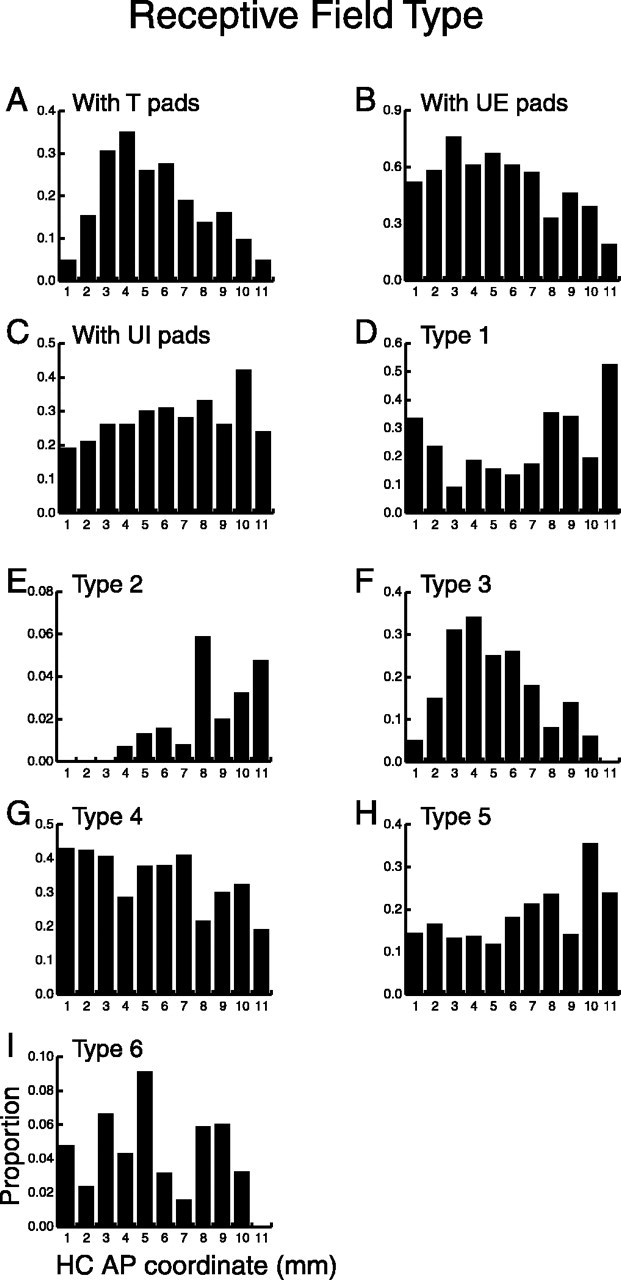
Distribution of RF type along the AP axis. The abscissa represents the HC AP coordinate divided into 1000 μm bins, and the ordinate represents the proportion of neurons within each bin. A, Neurons with orientation tuned (T) pads. B, Neurons with untuned excitatory (UE) pads. C, Neurons with untuned inhibitory (UI) pads. These neurons were further subdivided into six types: type 1 neurons, no responsive pads (D); type 2 neurons, orientation tuned pads only (E); type 3 neurons, some tuned pads and some untuned pads (F); type 4 neurons, untuned excitatory pads only (G); type 5 neurons, untuned inhibitory pads only (H); and type 6 neurons, only both untuned excitatory and untuned inhibitory pads (I). Distributions A, B, D, and F were fit well by Gaussians (p < 0.001), suggesting that these neuron types formed a U-shaped or inverted U-shaped distribution along the AP axis.
Figure 10.

Distribution of the somatotopic representation of the finger pads along the AP axis. Shown is the proportion of neurons for which the most responsive finger pad was one of the distal finger pads.
Table 1.
Testing uniformity of RF properties along the AP axis
|
Measure |
Figure |
n |
Mean |
SD |
Range |
KS |
ttest |
LR |
Gaussian |
|---|---|---|---|---|---|---|---|---|---|
| RF type | 6A | 218 | 0.235 | 0.424 | 0-1 | 0.000* | 0.000* | 0.011* | 0.000* |
| 6B | 546 | 0.588 | 0.492 | 0-1 | 0.000* | 0.000* | 0.000* | 0.000* | |
| 6C | 260 | 0.280 | 0.449 | 0-1 | 0.001* | 0.026 | 0.069 | 0.087 | |
| 6D | 179 | 0.193 | 0.395 | 0-1 | 0.000* | 0.000* | 0.002* | 0.000* | |
| 6E | 12 | 0.013 | 0.113 | 0-1 | 0.000* | 0.000* | 0.003* | 0.012 | |
| 6F | 206 | 0.222 | 0.416 | 0-1 | 0.000* | 0.000* | 0.001* | 0.000* | |
| 6G | 332 | 0.358 | 0.480 | 0-1 | 0.008* | 0.000* | 0.028* | 0.075 | |
| 6H | 155 | 0.167 | 0.373 | 0-1 | 0.000* | 0.002* | 0.006* | 0.004 | |
| 6I | 44 | 0.047 | 0.213 | 0-1 | 0.000* | 0.000* | 0.610 | 0.351 | |
| RF size | 7A | 749 | 2.87 | 1.17 | 1-4 | 0.275 | 0.000* | 0.000* | 0.000* |
| 7B | 749 | 5.78 | 3.68 | 1-12 | 0.017* | 0.000* | 0.000* | 0.000* | |
| 7C | 218 | 2.04 | 1.62 | 1-10 | 0.059 | 0.000* | 0.007* | 0.018 | |
| 7D | 218 | 0.480 | 1.17 | 0-10 | 0.000* | 0.000* | 0.001* | 0.000* | |
| 7E | 546 | 5.39 | 3.62 | 1-12 | 0.310 | 0.000* | 0.019* | 0.001 | |
| 7F | 546 | 3.17 | 3.84 | 0-12 | 0.000* | 0.000* | 0.000* | 0.000* | |
| 7G | 260 | 3.63 | 3.29 | 1-12 | 0.379 | 0.000* | 0.669 | 0.085 | |
| 7H | 260 | 1.02 | 2.38 | 0-12 | 0.000* | 0.000* | 0.348 | 0.032 | |
| RF shape | 8 | 510 | 0.789 | 0.408 | 0-1 | 0.998 | 0.000* | 0.491 | 0.320 |
| Firing rate | 9A | 218 | 11.97 | 10.61 | −7.04 to 84.54 | 0.032* | 0.000* | 0.006* | 0.018 |
| 9B | 546 | 5.39 | 4.26 | 0.369-30.26 | 0.131 | 0.000* | 0.115 | 0.000* | |
| 9C | 260 | 3.15 | 1.78 | 0.369-9.82 | 0.998 | 0.000* | 0.546 | 0.390 | |
| 9D | 928 | 6.76 | 7.02 | 0.005-48.80 | 0.000* | 0.000* | 0.004* | 0.000* | |
| Somatotopy | 10 | 312 | 0.417 | 0.493 | 0-1 | 0.142 | 0.038 | 0.207 | 0.377 |
| Orient tuning | 11A | 218 | 0.703 | 0.173 | 0.270-1.00 | 0.981 | 0.000* | 0.006* | 0.008 |
|
|
11B
|
218 |
64.95 |
24.63 |
22.50-135.00 |
0.586 |
0.000*
|
0.000*
|
0.000*
|
n, Number of neurons represented; mean, average value across neurons; SD, SD across neurons; range, minimum and maximum value across neurons; KS, p value from a Kolmogorov-Smirnov test for uniformity (α=0.05); t test, lowest p value from a series of unpaired two-tailed t tests (see Materials and Methods; α=0.0047); LR, p value from linear regression (α=0.05); Gaussian, p value from fitting a Gaussian that could be either upright or inverted (α=0.001). The asterisk indicates whether the p value was significant, indicating that the distribution was significantly different from uniform.
We applied multivariate ANOVA (MANOVA) and contrast analysis to test the hypothesis that the data in Figures 6, 7, 8, 9, 10, 11 cluster into multiple groups divided along the AP axis of the SII hand region. We only applied this analysis to the data in Figures 6 A-D, F-H; 7, D, F, and H; and 9D, because the data from the other graphs either contained too few data points, which caused the analysis matrices to degenerate (see Fig. 6 E, I), or did not apply to each of the 928 neurons studied. In this analysis, each neuron was considered as a multidimensional vector, with the different parameters (see Figs. 6, 7, 9) constituting separate dimensions. The analysis consisted of the following two steps. First, an optimal partitioning scheme was obtained for a hypothetical n group model for n = 2, 3, 4, and 5. For every n, optimality was achieved by minimizing the Wilk's lambda for the n groups, and the partitioning of these groups along the HC AP axis was performed independently for each group model. The partitions had to be at least 1 mm in extent to make them physiologically plausible. Second, after dividing the data into five groups as determined by MANOVA, the significance of partitioning into n groups versus partitioning into n-1 groups was determined using contrast analysis. The test statistic was computed from the sum of the means of the groups (Stevens, 1996).
Results
We recorded from five hemispheres of three monkeys using single-unit and multiunit recording methods. The results are divided into two main sections. In the first, we describe the results from the multiunit and single-unit mapping study that relied on manually presenting cutaneous and proprioceptive stimuli to the passive hand or allowing the animal to actively move its hand. In the second, we describe the results from the motorized oriented bar study in which we recorded from single neurons while presenting a small oriented bar to the restrained hand. The results from both studies suggest that the SII hand region consists of at least three cortical fields.
Mapping study
Multiunit maps
In all five hemispheres, we encountered a large, contiguous region of cortex within the SII region that contained neurons that were responsive to cutaneous and/or proprioceptive stimulation of the hand (Figs. 3, 4, 5). The region of cortex with neurons that responded to the hand was approximately an oval patch with its major axis aligned in an anterolateral to posteromedial orientation in the unfolded cortex. In all of the hemispheres, the angle of this major axis had an orientation that was steeper than the lateral sulcus. The AP length of the hand region was ∼10 mm in the three hemispheres in which the complete hand representation was mapped. The corresponding length of the minor axis of the oval was ∼4-7 mm in all five maps (Figs. 3, 4, 5).
Figure 3.
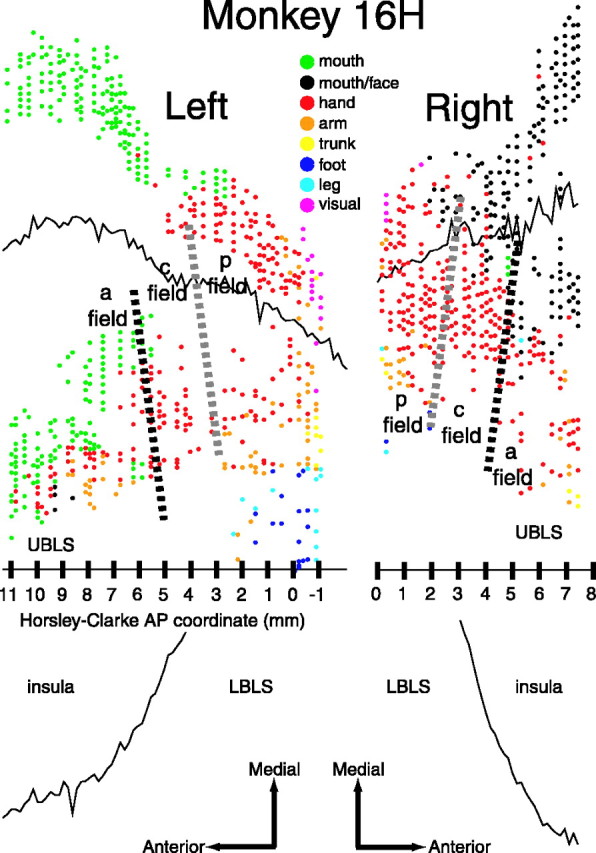
Unfolded maps of the SII region for the left and right hemispheres of monkey 16H. Each point represents our subjective estimate of the center of the RF for either a single-unit or multiunit record. Black and gray dashed lines indicate the approximate location of the border between the anterior (a) and central (c) field and the border between the posterior (p) and central field, respectively. All or nearly all of the AP extent of the SII hand region was mapped in the left hemisphere, whereas only a limited portion of the SII hand region was mapped in the right hemisphere. Mouth, Responses from the lips or intraoral structures. During the mapping of the right hemisphere, the distinction between “mouth” and “face” responses was not made.
Figure 4.
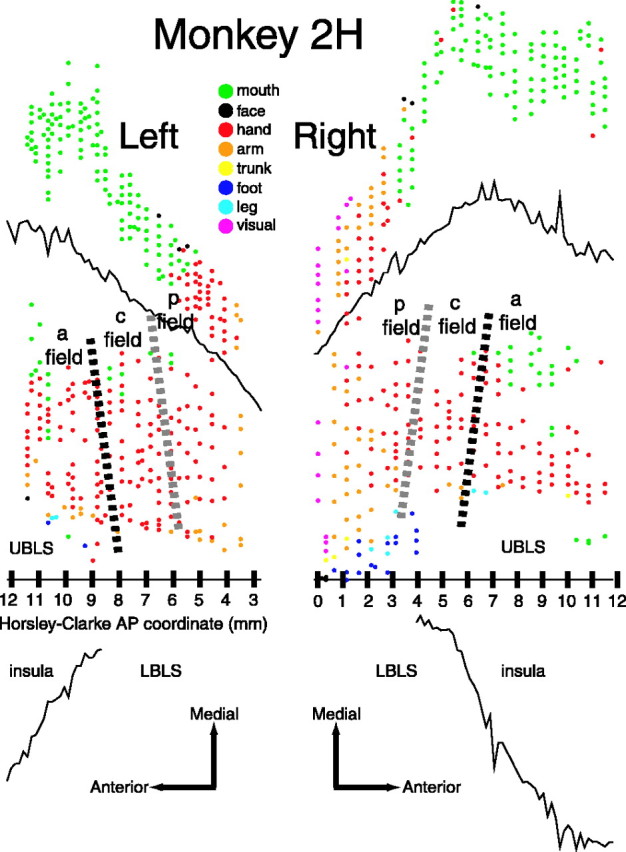
Unfolded maps of the SII region for the left and right hemispheres of monkey 2H. All or nearly all of the AP extent of the SII hand region was mapped in the right hemisphere, whereas only a limited portion of the SII hand region was mapped in the left hemisphere.
Figure 5.

Unfolded map of the SII region for the right hemisphere of monkey R1171. The entire AP extent of the SII hand region was mapped in this hemisphere.
Although neurons throughout this region responded to stimulation of the hand, the data suggest that this large region of the cortex is functionally composed of three different cortical fields, which we refer to here as the anterior, central, and posterior SII fields. Whereas the neurons in each of the fields tended to respond to both cutaneous and proprioceptive stimulation, the relative sensitivity of these three fields to such stimuli differed substantially. The clearest difference is that neurons in the central field were more sensitive to cutaneous stimuli than neurons in the flanking anterior and posterior fields.
The borders between the three fields were not precisely ML and slanted slightly anteromedially to posterolaterally. The data suggest that the slants of the borders were similar in all five hemispheres (Figs. 3, 4, 5). The slant is best illustrated in Figures 3 and 5, which show the maps from monkeys 16H and R1171.
Somatotopic organization and response properties of the central field
The central field appeared to be crudely somatotopically organized, with the digits represented in an orderly manner. Although neurons often had large RFs that spanned multiple digits, we inferred, based on the digit of best driving, that digit 1 is represented most medially and digit 5 is represented most laterally. We were not able to discern any distal-to-proximal organization within this digit representation. In monkey 16H, the central field digit representation extended medial to the UBLS onto the post-central gyrus (Fig. 3). In all three monkeys, the palm representation bordered the digits laterally. As shown in Figures 3, 4, 5, the overall hand representation of the central field is approximately rectangular in shape, tilted slightly anteromedially to posterolaterally along its borders with the anterior and posterior fields, with an AP extent of 2-3 mm and an ML extent of ∼7 mm.
The central field hand representation was bordered anteriorly and posteriorly by the hand representations of the anterior and posterior fields (Figs. 3, 4, 5). Oral structures, including the lips and the inside of the mouth, were represented medial to the hand. The rest of the arm was represented laterally, and lateral to that, the leg and foot were represented (Figs. 4, 5). The response properties of neurons in these non-hand regions immediately adjacent to the central field hand representation also responded well to light cutaneous stimulation, which suggests that these neurons were part of the central field. We did not observe neurons in this region that responded to the trunk.
What distinguishes the central field neurons from neurons in the flanking fields is their sensitivity to cutaneous stimulation. Neurons in the central field responded vigorously to light brushing of the glabrous skin of the hands and feet, as well as to light brushing of the hairy skin. These neurons responded to both dynamic and static indentation of the skin, exhibiting slowly adapting responses, rapidly adapting responses, and responses that were intermediate between the two. Such responses are similar to those reported previously for neurons in the SII region (Robinson and Burton, 1980b; Burton and Sinclair, 1990; Hsiao et al., 1993; Krubitzer et al., 1995; Zhang et al., 2001; Meftah et al., 2002). Neurons that had responses like those of Pacinian afferents were generally located lateral to the digit representation, between digit 5 and the palm.
Somatotopic organization and response properties of the anterior and posterior fields
Mapping the somatotopic organization of the anterior and posterior fields was more difficult than mapping the central field because neurons in these two fields responded more weakly to cutaneous stimulation. We were not able to discern any obvious ML or distal-to-proximal organization within the digit representations of these two fields. However, we were able to distinguish the location of the digits from that of the palm and wrist, which were located lateral to the digits in the anterior field and lateral and posterior to the digits in the posterior field. In addition, the posterior field digit representation extended medial to the UBLS onto the postcentral gyrus (Figs. 3, 4, 5). The AP extent of the anterior field hand representation was ∼5 mm but appeared to taper somewhat in ML width from a maximum of ∼7 mm along its border with the central field to only a few millimeters at its anterior border (most apparent in Fig. 4, left). The AP extent of the posterior field hand representation was ∼3 mm, and its maximum ML width was ∼6 mm along its border with the central field.
Neurons in the cortex lateral and posterior to the anterior and posterior field hand representations responded to the arm, and neurons lateral to those responded to the trunk, leg, and foot (Figs. 3, 4, 5). Neurons in the cortex anterior and medial to the hand representation responded to the mouth (Figs. 4, 5). Because neurons in the cortex surrounding these regions had response properties that were similar to the response properties of neurons in the anterior and posterior fields, we hypothesize that each of these fields, like the central field, contains a complete or nearly complete representation of the body.
Compared with neurons in the central field, neurons in the anterior and posterior fields were not as responsive to cutaneous stimulation such as brushing and indenting the skin with hand-held probes and oriented bars. In the hand representation of each field, neurons were generally responsive to passive flexion or extension of multiple digits or occasionally the wrist, and many neurons responded well to active movement, especially when the animal grasped objects. Similar proprioceptive responses were observed in neurons in the surrounding cortex for joints of the arm and hindlimb. During the mapping study, we did not observe any obvious differences in the response properties of neurons between the anterior and posterior fields.
Consistency of maps across hemispheres
The three fields had similar locations with respect to the lateral sulcus both across hemispheres of the same monkey and across monkeys (Figs. 3, 4, 5). In each of the five hemispheres, a portion of the digit representation extended medial to the UBLS onto the postcentral gyrus. Furthermore, the angle of the entire SII hand region with respect to the lateral sulcus was similar across hemispheres. In addition, the location of the SII hand region with respect to the posterior pole of the insula was similar across the four hemispheres of monkeys 16H and 2H, although in monkey R1171 the insula extended further posterior with respect to the SII region. The hand region extended ∼10 mm in the AP dimension in each of the hemispheres in which it was mapped completely (Figs. 3, left; 4, right; 5). In addition, HC coordinates were generally a reliable indicator of the AP location of the SII hand region; the posterior end was located at approximately anterior 0. Finally, the response properties of neurons in the three fields were similar across hemispheres of the same monkey and across monkeys.
Motorized oriented bar study
The aim of this study was to quantify the cutaneous responses of neurons to oriented bar stimuli. Because these single-unit recordings required that the animal's hand be held in place with a fixed restraint, neural responses to proprioceptive stimulation were not studied. We studied the responses of 928 neurons from four hemispheres of two monkeys in which we systematically stimulated the distal, medial, and proximal pads of D2-5, presenting the bar at eight different orientations (Fig. 2B). The responses of each neuron were classified based on six measures (Figs. 6, 7, 8, 9, 10, 11): (1) RF type; (2) RF size; (3) RF shape; (4) firing rate; (5) somatotopy; and (6) orientation tuning. The data were placed into 1000 μm bins according to their HC AP location. Because the SII maps were similar between hemispheres, the data from all four hemispheres were combined.
RF type
Neurons in the SII hand region had a wide variety of responses to the oriented bar. Although some neurons (19%) were unresponsive, the vast majority were driven by the oriented bar. We categorized the neurons in two different ways. First, we divided them into three types based on whether they showed orientation tuned responses, untuned excitatory responses, or untuned inhibitory responses (Fig. 6A-C). A neuron could belong to one or more of these three types. The ordinate in the graphs shown in Figure 6 represents the proportion of neurons of that type (i.e., the number of neurons of that type divided by the total number of neurons studied within that bin).
Twenty-three percent (218 of 928) of the neurons had RFs that included one or more orientation tuned pads. These neurons were not uniformly distributed along the AP axis of the SII hand region (Fig. 6A) (see Table 1 for a summary of the results). Figure 6A shows that the distribution of tuned neurons has an inverted U shape with a peak near HC AP 4. Similarly, neurons that have untuned excitatory pads also show an inverted U-shaped distribution (Fig. 6B). This distribution is broader and flatter than the one shown for tuned neurons. Both distributions are fit well by Gaussians (Table 1) (p < 0.001). The untuned inhibitory neurons also may form an inverted U-shaped distribution, although this distribution was not fit significantly well by a Gaussian (Fig. 6C). These results show that neurons in the central portion of the SII hand region are driven more effectively by cutaneous stimulation than neurons in the flanking anterior and posterior regions.
To further investigate this result, we subdivided the neuronal population into six mutually exclusive types (Fig. 6D-I). Type 1 included neurons (n = 179) that did not change their firing rates when stimulated with the bar (Fig. 6D). These neurons formed a U-shaped distribution illustrating that fewer neurons in the anterior and posterior extremes are responsive to cutaneous stimulation. Types 2 and 3 included neurons that had one or more orientation tuned pads. Type 2 included neurons (n = 12) that only had orientation tuned pads. These neurons were mainly found in the anterior portion of the SII hand region (Fig. 6E). Type 3 included all neurons (n = 206) with both orientation tuned pads and untuned pads (that were either excitatory or inhibitory) (Fig. 6F). Such type 3 neurons comprise a majority of the neurons shown in Figure 6A and show a similar distribution. Types 4 and 5 included neurons that were either excited (type 4, n = 332) (Fig. 6G) or inhibited (type 5, n = 155) (Fig. 6H) by the bar but did not show orientation tuning. These distributions show that there are a greater proportion of excitatory neurons in the posterior and central regions and a greater proportion of inhibitory neurons in the anterior region. Finally, type 6 included neurons (n = 44) that only had both excitatory and inhibitory untuned pads. There were relatively few of these neurons, and they may have been randomly distributed along the entire SII hand region (Fig. 6I).
The distributions shown in Figure 6, A, B, D, and F, were fit well by Gaussians (p < 0.001) (Table 1), which suggests that neurons in the central region of SII are driven more effectively by oriented bars than neurons in the flanking anterior and posterior regions. Although in Figure 6, panels G and especially H may support a two-compartment model, with the border located near AP 7, panels D and F suggest that there is another border located around AP 3.
RF size
It has long been known that neurons in the SII region have a variety of RF sizes (Robinson and Burton, 1980a). Is this because the neurons studied came from different cortical fields? Here we assessed RF size using eight different measures and examined how the neurons were distributed along the SII hand region. The eight measures (Fig. 7) were: (1) number of responsive fingers per neuron; (2) number of responsive finger pads per neuron; (3) number of tuned pads per tuned neuron; (4) number of tuned pads per total number of neurons; (5) number of untuned excitatory pads per untuned excitatory neuron; (6) number of untuned excitatory pads per total number of neurons; (7) number of untuned inhibitory pads per untuned inhibitory neuron; and (8) number of untuned inhibitory pads per total number of neurons. The mean for each of the eight measures is plotted against AP position in Figure 7.
The results show that RF size was not uniformly distributed along the AP axis. This is illustrated in Figure 7, A, B, D, and F, which shows nonuniform distributions that are fit well by upright Gaussians (p < 0.001) (Table 1). Although the distributions shown in Figure 7, A and F, are relatively broad, the distribution shown in Figure 7D is not. The data support the hypothesis that neurons in the central portion of the SII region have larger RFs and are more orientation sensitive than neurons in the anterior and posterior portions.
RF shape
Next we investigated, in a simple way, the shapes of the RFs along the SII hand region. The measure, which we call contiguity, determines whether the responsive finger pads formed a continuous surface (see Materials and Methods). Most neurons had contiguous RFs, and the degree of contiguity did not seem to vary substantially along the AP axis (Fig. 8, Table 1). This is perhaps surprising because, as shown in Figure 7, RF size varied considerably along this region of the cortex, and the likelihood of a neuron being contiguous tends to increase as its RF size increases.
Firing rate
During the mapping study, we observed that neurons in the central field tend to be more responsive to cutaneous stimulation than neurons in the anterior and posterior fields. We confirmed these findings using four measures of neuronal firing rate (Fig. 9): (1) peak firing rate of tuned neurons; (2) mean firing rate of untuned excitatory neurons; (3) mean firing rate of untuned inhibitory neurons; and (4) spontaneous firing rate of all neurons.
Similar to the measures of RF type (Fig. 6) and RF size (Fig. 7), these measures of firing rate were not uniformly distributed along the AP axis (Table 1). The distributions of the mean firing rate of untuned excitatory neurons (Fig. 9B) and spontaneous firing rate (Fig. 9D) were fit well by upright Gaussians (p < 0.001). Both of these graphs have a maximum near the central portion of the hand region and a minimum at the anterior and posterior extremes. These data show that neurons in the central region are more responsive to at least certain types of cutaneous stimulation and have higher spontaneous rates.
Somatotopy
In the mapping study, we found a medial-to-lateral D1-5 progression in the RFs across the central field. Here we tested whether there is a systematic distal-to-proximal progression in somatotopy in the AP dimension. Krubitzer et al. (1995) reported that the SII region is composed of two somatotopically organized mirror image representations, SII proper and parietal ventral area (PV), which suggests that there may be a mirror image distal-to-proximal progression in the hand representation. To test for this, we determined the proportion of responsive neurons for which the finger pad with the highest evoked rate is a distal pad. The results shown in Figure 10 suggest that there is no fine distal-to-proximal somatotopic representation of the hand along the AP axis (Table 1).
Orientation tuning
As stated previously, 23% (218 of 928) of the neurons in the SII hand region showed orientation tuned responses on one or more finger pads, with neurons in the central and anterior regions more commonly tuned than neurons in the posterior region (Fig. 6). The question we address here is whether the strength of orientation tuning for these neurons changes along the AP axis. Figure 11 shows two measures of orientation tuning: aspect ratio and bandwidth.
The distributions of both aspect ratio and bandwidth were not uniformly distributed along the AP axis (Fig. 11, Table 1). Aspect ratio (Fig. 11 A) shows a relatively flat distribution, and bandwidth (Fig. 11 B) shows a broad, inverted U-shaped distribution that was fit well by a Gaussian (p < 0.001). The results indicate that tuning may be more robust (higher aspect ratios and smaller bandwidths) in the anterior and posterior regions than in the central region, although there were more tuned neurons (Fig. 6 A) and more tuned pads per tuned neuron (Fig. 7 C) in the central portion of the SII hand region. This is perhaps surprising if the central field really is more involved in cutaneous information processing than the anterior and posterior fields.
Testing for multiple groups along the AP axis
Table 1 shows a summary of the p values obtained from four statistical tests that we used to assess whether the neural responses to the motorized oriented bar were uniformly distributed along the AP axis of the SII hand region [a Kolmogorov-Smirnov test of uniformity (α = 0.05); a test of uniformity based on t tests (α = 0.0047); linear regression (α = 0.05); and Gaussian nonlinear regression (α = 0.001)]. The only measure that was not significantly different from a uniform distribution (for all four tests) was the proportion of neurons that were most responsive on a distal finger pad (Fig. 10).
We used MANOVA and multivariate contrast analysis to test the significance of partitioning the hand region into separate groups. The p value is the probability that there is a significantly better fit for n groups versus n-1 groups. This analysis produced repeatable locations for the partitions (borders) for each group model. For two groups, the analysis placed a partition at AP 7.4 (which may correspond to the anterior/central field border). For three groups, the analysis placed partitions at AP 7.4 and 2.6 (which may correspond to the anterior/central field and posterior/central field borders, respectively). Adding additional groups produced additional partitions (four groups: partition at AP 5.0; five groups: additional partition at AP 3.8) within the central region. Placing the first partition at AP 7.4 is consistent with our subjective observations that there were greater differences between the response properties of neurons in the anterior and central fields than between those of neurons in the posterior and central fields. Placing partitions at AP 7.4 and AP 2.6 shows that there is a central region that is distinct from the anterior and posterior regions. This central region is slightly larger than the size of the central field that we found in the mapping study. The contrast analysis indicates that the hand region may consist of four groups, because partitioning into five groups was not significantly better (p > 0.01) than partitioning into four groups, whereas four was better than three, three was better than two, and two was better than one (p < 0.01).
Discussion
We present evidence that the SII region hand representation consists of at least three separate functional fields. This hypothesis is supported both by our subjective impressions of the neural responses using hand-held stimuli and by quantitative analyses of the cutaneous responses to a motorized oriented bar. Neurons in the anterior and posterior portions of the SII hand region had complex response properties and were driven by proprioceptive and/or cutaneous input. The neural responses in these fields were clearly different from those of the central field, which had neurons that responded more effectively to cutaneous input. The four analyses of Table 1 provide strong evidence that many of the response properties of SII region neurons are not distributed uniformly along the AP axis; only Figure 10 (which shows whether the most responsive finger pad of an RF is distal) was not significantly different from uniform for all four tests. This suggests that, unlike SI cortex, the SII hand region does not contain systematic distal-to-proximal organization within the representation(s) of the digits. This does not necessarily mean that there is a single representation of the hand. Instead, this suggests that neurons in the SII region have integrative functions resulting in a loss of fine somatotopy. This is especially true for the anterior and posterior fields where, in addition to the lack of distal-to-proximal organization, we also observed no obvious segregation of D1-5 along the ML axis. All other measures of cutaneous response, including RF type, size, shape, firing rate, and orientation tuning properties varied significantly along the AP axis, with many of the measures exhibiting U-shaped or inverted U-shaped distributions that were fit well by inverted or upright Gaussian distributions, respectively. Although this does not prove that there are three separate fields, it suggests that there is a central region, centered at approximately HC AP 4, specialized for processing cutaneous input. The results from the MANOVA and multivariate contrast analysis are consistent with the existence of a central field that is significantly different from the flanking anterior and posterior fields. Although the analysis suggests that this central region may actually be subdivided into two separate fields, we have chosen to call this region a single field because this is consistent with what we observed in the mapping study.
A consistent feature of the cerebral cortex is the existence of anatomical changes at the borders of functionally distinct regions. With the present data on the division of the SII region into multiple subdivisions with distinct functional properties, we expect to find anatomical variations across this area of the cortex. Preliminary analyses indicate that this is the case. Sections cut in either the frontal or sagittal planes and processed immunocytochemically for nonphosphorylate neurofilament protein or parv-albumin reveal several anatomically distinct subdivisions along the UBLS, in the SII region. These anatomical subdivisions form boundaries with one another in which laminar patterns of neuronal immunostaining change abruptly. Ongoing experiments will determine whether borders between functional subdivisions occur at these anatomical boundaries.
Are these separate areas?
We have chosen to call the three zones in the SII hand region cortical fields because of the uncertainty of whether they constitute separate areas. First, although there are abrupt anatomical changes in the laminar patterns, the functional properties appear to change gradually between the three fields (Figs. 6, 7, 9, 11). The gradual transitions could be explained by various sources: (1) averaging data across four hemispheres in which the precise locations of the borders may vary; (2) variability in the angle and straightness of the borders; and (3) inaccuracies in our placement of the recording chamber and locations of the microelectrode penetrations within the chamber.
Second, it is not obvious from our data that there are three complete representations of the body. In this study, we concentrated on the response properties of neurons representing the hand and the immediately surrounding cortex. In our limited maps of the region, we did not find a trunk representation for the central field, and we also did not find face representations other than the mouth for the anterior and central fields. Figure 12 shows a map summarizing the SII hand region along with our estimates of the body parts represented in the adjacent cortex. The map is similar in size and location within the UBLS to the map of Robinson and Burton (1980a), whose map consisted of a single cortical area, and to the maps of Burton et al. (1995) and Krubitzer et al. (1995), whose maps consisted of two separate cortical areas.
Figure 12.

Summary map of the SII hand region and surrounding cortex. This map is based on both the data from the mapping study and the data from the motorized oriented bar study. The black dashed line indicates the approximate location of the anterior/central field border, and the gray dashed line indicates the approximate location of the posterior/central field border, which was more difficult to locate than the anterior/central field border. a, Anterior; A, arm; c, central; D, digit; HL, hindlimb (foot and/or rest of leg); M, mouth; p, posterior.
A third concern is to reconcile these results with previously published reports describing evidence for multiple representations within the SII region. Robinson and Burton (1980a) reported that the SII region contains a single cutaneous region flanked by “complex zones” that required active movement to drive the neurons, although these zones are smaller than the anterior and posterior fields reported here. More recently, Burton et al. (1995) reported, using tracers injected into areas 3b and 1, that the AP length of the SII region exceeds 7 mm and contains separate anterior and posterior body maps. They also found that area 3b has a greater density of connections with what they called the anterior portion of the SII region. We speculate that they would have found a larger AP extent if they had included areas 3a and 2 in their tracer injections, because Pons et al. (1992) showed that these areas have functional projections to the SII region, and neurons in these areas have proprioceptive responses that potentially provide input to the anterior and posterior fields. Interestingly, the anterior SII region of Burton et al. (1995) appears to be centered approximately at HC AP 4, corresponding to the region we call the central field.
Krubitzer et al. (1995) reported that the SII region contains two representations of the body called SII proper and PV. In their studies, they stimulated the skin using a protocol similar to the one we used in our mapping study and concluded, based primarily on mirror image body maps, that the SII region consists of two separate areas. We speculate that our anterior field corresponds to the area they call PV and that our combined central and posterior fields correspond to their area SII proper. We make this inference for two reasons: (1) the border between their two representations is located at a similar position within the UBLS to our anterior field/central field border; and (2) the AP extent of our combined central and posterior fields is similar in size to SII proper. Furthermore, although we found during the mapping study that there were obvious differences in the cutaneous response properties between the anterior and central fields, these differences may have been less pronounced between the central and posterior fields. An alternative explanation is that the posterior and central fields constitute a single cortical area. If this is correct, then either SII proper or PV (depending on where you place the border) must contain separate subregions in which one subregion is devoted to processing primarily cutaneous input and the other subregion is devoted to processing primarily proprioceptive input.
Functional significance
If neurons in the central field are responsible for processing cutaneous information, then what roles do the anterior and posterior fields play in haptic processing? During the mapping study, we observed neurons in the anterior and posterior fields that responded particularly well when the animal actively grasped objects. These neurons could be related to motor function because their responses resemble the hand manipulation neurons described previously in areas 5 and 7 (Mountcastle et al., 1975; Kalaska et al., 1983). Another possibility is that neurons within these fields are related to integrative functions of the hand that may include sensorimotor processing or stereognosis. Because neurons in the posterior field are generally not orientation tuned (Fig. 6), these neurons may be processing information about hand conformation or features such as object size that do not depend on orientation information. In contrast, neurons in the anterior field tend to be sensitive to proprioceptive stimuli and more sensitive to orientation than posterior field neurons, which suggests that anterior field neurons may be coding information about complex features of objects. Another possibility is that because neurons in the anterior and posterior fields respond well to active touch, these neurons could be involved in higher cognitive aspects of tactile sensation.
Whether or not these fields in the SII region correspond to separate cortical areas, the current findings suggest that the somatosensory cortical pathways are organized in a way that may be similar to the organization in the visual system, in which information diverges into multiple distributed hierarchical processing streams (Felleman and Van Essen, 1991). In the somatosensory system, previous studies have suggested that information from multiple lower-order somatosensory cortical areas converges onto a single representation in the SII region (Friedman et al., 1986; Hsiao et al., 2003). Our current finding that the SII region contains three fields with distinct functional properties suggests that multiple distributed hierarchical processing streams also exist in the somatosensory system.
Footnotes
This work was supported by National Institutes of Health Grant NS34086. We thank Stewart Hendry for helping us with the neuroanatomy.
Correspondence should be addressed to Dr. Steven Hsiao, Zanvyl Krieger Mind/Brain Institute, Johns Hopkins University, 338 Krieger Hall, 3400 North Charles Street, Baltimore, MD 21218. E-mail: Steven.Hsiao@jhu.edu.
Copyright © 2004 Society for Neuroscience 0270-6474/04/2411193-12$15.00/0
References
- Burton H, Sinclair RJ (1990) Second somatosensory cortical area in macaque monkeys. I. Neuronal responses to controlled, punctate indentions of glabrous skin on the hand. Brain Res 520: 262-271. [DOI] [PubMed] [Google Scholar]
- Burton H, Videen TO, Raichle ME (1993) Tactile-vibration-activated foci in insular and parietal-opercular cortex studied with positron emission tomography: mapping the second somatosensory area in humans. Somatosens Mot Res 10: 297-308. [DOI] [PubMed] [Google Scholar]
- Burton H, Fabri M, Alloway KD (1995) Cortical areas within the lateral sulcus connected to cutaneous representations in areas 3b and 1: a revised interpretation of the second somatosensory area in macaque monkeys. J Comp Neurol 355: 539-562. [DOI] [PubMed] [Google Scholar]
- Chubbuck JG (1966) Small motion biological stimulator. Johns Hopkins APL Tech Digest, pp 18-23.
- DiCarlo JJ, Lane JW, Hsiao SS, Johnson KO (1996) Marking microelectrode penetrations with fluorescent dyes. J Neurosci Methods 64: 75-81. [DOI] [PubMed] [Google Scholar]
- Disbrow E, Roberts T, Krubitzer L (2000) Somatotopic organization of cortical fields in the lateral sulcus of Homo sapiens: evidence for SII and PV. J Comp Neurol 418: 1-21. [DOI] [PubMed] [Google Scholar]
- Felleman DJ, Van Essen DC (1991) Distributed hierarchical processing in the primate cerebral cortex. Cereb Cortex 1: 1-47. [DOI] [PubMed] [Google Scholar]
- Friedman DP, Jones EG, Burton H (1980) Representation pattern in the second somatic sensory area of the monkey cerebral cortex. J Comp Neurol 192: 21-41. [DOI] [PubMed] [Google Scholar]
- Friedman DP, Murray EA, O'Neill JB, Mishkin M (1986) Cortical connections of the somatosensory fields of the lateral sulcus of macaques: evidence for a corticolimbic pathway for touch. J Comp Neurol 252: 323-347. [DOI] [PubMed] [Google Scholar]
- Gelnar PA, Krauss BR, Szeverenyi NM, Apkarian AV (1998) Fingertip representation in the human somatosensory cortex: an fMRI study. Neuro-Image 7: 261-283. [DOI] [PubMed] [Google Scholar]
- Hsiao SS, O'Shaughnessy DM, Johnson KO (1993) Effects of selective attention of spatial form processing in monkey primary and secondary somatosensory cortex. J Neurophysiol 70: 444-447. [DOI] [PubMed] [Google Scholar]
- Hsiao SS, Johnson KO, Yoshioka T (2003) Processing of tactile information in the primate brain. In: Comprehensive handbook of psychology, Vol 3, Biological psychology (Gallagher M, Nelson RJ, eds), pp 211-236. New York: Wiley.
- Jiang W, Tremblay F, Chapman CE (1997) Neuronal encoding of texture changes in the primary and the secondary somatosensory cortical areas of monkeys during passive texture discrimination. J Neurophysiol 77: 1656-1662. [DOI] [PubMed] [Google Scholar]
- Kalaska JF, Caminiti R, Georgopoulos AP (1983) Cortical mechanisms related to the direction of two-dimensional arm movements: relations in parietal area 5 and comparison with motor cortex. Exp Brain Res 51: 247-260. [DOI] [PubMed] [Google Scholar]
- Krubitzer LA, Clarey J, Tweedale R, Elston G, Calford MB (1995) A redefinition of somatosensory areas in the lateral sulcus of macaque monkeys. J Neurosci 15: 3821-3839. [DOI] [PMC free article] [PubMed] [Google Scholar]
- Meftah EM, Shenasa J, Chapman CE (2002) Effects of a cross-modal manipulation of attention on somatosensory cortical neuronal responses to tactile stimuli in the monkey. J Neurophysiol 88: 3133-3149. [DOI] [PubMed] [Google Scholar]
- Mountcastle VB, Lynch JC, Georgopoulos AP, Sakata H, Acuna C (1975) Posterior parietal association cortex of the monkey: command functions for operations within extrapersonal space. J Neurophysiol 38: 871-908. [DOI] [PubMed] [Google Scholar]
- Mountcastle VB, Reitboeck HJ, Poggio GF, Steinmetz MA (1991) Adaptation of the Reitboeck method of multiple microelectrode recording to the neocortex of the waking monkey. J Neurosci Methods 36: 77-84. [DOI] [PubMed] [Google Scholar]
- Pons TP, Garraghty PE, Mishkin M (1988) Lesion induced plasticity in the second somatosensory cortex of adult macaques. Proc Natl Acad Sci USA 85: 5279-5281. [DOI] [PMC free article] [PubMed] [Google Scholar]
- Pons TP, Garraghty PE, Mishkin M (1992) Serial and parallel processing of tactual information in somatosensory cortex of rhesus monkeys. J Neurophysiol 68: 518-527. [DOI] [PubMed] [Google Scholar]
- Pruett JR, Sinclair RJ, Burton H (2000) Response patterns in second somatosensory cortex (SII) of awake monkeys to passively applied tactile gratings. J Neurophysiol 84: 780-797. [DOI] [PubMed] [Google Scholar]
- Robinson CJ, Burton H (1980a) Somatotopographic organization in the second somatosensory area of M. fascicularis J Comp Neurol 192: 43-67. [DOI] [PubMed] [Google Scholar]
- Robinson CJ, Burton H (1980b) Somatic submodality distribution within the second somatosensory (SII), 7b, retroinsular, postauditory, and granular insular cortical areas of M. fascicularis J Comp Neurol 192: 93-108. [DOI] [PubMed] [Google Scholar]
- Rowe M, Ferrington DG, Fisher GR, Freeman B (1985) Parallel processing and distributed coding for tactile vibratory information within sensory cortex. In: Development, organization, and processing in somatosensory pathways (Rowe M, Willis WD, eds), pp 247-258. New York: Liss.
- Salinas E, Hernandez A, Zainos A, Romo R (2000) Periodicity and firing rate as candidate neural codes for the frequency of vibrotactile stimuli. J Neurosci 20: 5503-5515. [DOI] [PMC free article] [PubMed] [Google Scholar]
- Stevens J (1996) Applied multivariate statistics for the social sciences, Chap 5.0. Mahwah, NJ: Erlbaum.
- Whitsel BL, Petrucelli LM, Werner G (1969) Symmetry and connectivity in the map of the body surface in somatosensory area II of primates. J Neurophysiol 32: 170-183. [DOI] [PubMed] [Google Scholar]
- Woolsey CN (1943) “Second” somatic receiving areas in the cerebral cortex of cat, dog, and monkey. Fed Proc 2: 55. [PubMed] [Google Scholar]
- Woolsey CN, Fairman D (1946) Contralateral, ipsilateral and bilateral representation of cutaneous receptors in somatic areas I and II of the cerebral cortex of pig, sheep and other mammals. Surgery 19: 684-702. [PubMed] [Google Scholar]
- Zhang HQ, Zachariah MK, Coleman GT, Rowe MJ (2001) Hierarchical equivalence of somatosensory areas I and II for tactile processing in the cerebral cortex of the marmoset monkey. J Neurophysiol 85: 1823-1835. [DOI] [PubMed] [Google Scholar]
- Zilles K, Eickhoff S, Palomero-Gallagher N (2003) The human parietal cortex: a novel approach to its architectonic mapping. Adv Neurol 93: 1-21. [PubMed] [Google Scholar]