

Abstract
OBJECTIVE
The purpose of this study was to identify which biological processes may be involved in normal labor.
STUDY DESIGN
Transcriptional profiles for chorioamniotic membranes (n=24) and blood (n=20) were generated from patients at term with no labor (TNL) and in labor (TIL).
RESULTS
Expression of 197 transcripts (P≤0.02) differentiated TIL and TNL chorioamniotic membrane samples. Gene Ontology analysis indicated that TIL samples had increased expression of multiple chemokines and transcripts associated with neutrophil and monocyte recruitment. Microarray results were verified using quantitative real-time RT-PCR with independent samples. Transcriptional profiles from blood RNA revealed no Gene Ontology category enrichment of discriminant probe sets.
CONCLUSION
Labor induces gene expression changes consistent with localized inflammation, despite the absence of histologically detectable inflammation.
Keywords: chorioamniotic membrane; blood, transcriptional profile; microarray; acute inflammation; parturition; chorioamnionitis; chemokines; cytokines
Introduction
Human parturition involves “a common pathway” manifested clinically by uterine contractions, cervical ripening and chorioamniotic membrane/decidual activation, culminating in membrane rupture.1 The chorioamniotic membranes undergo complex anatomical and biochemical events that lead to membrane rupture.2,3 Morphological, biochemical and biophysical studies suggest that rupture of membranes results from the application of acute or chronic stress on localized areas of the membranes that are weaker.4
Cervical ripening has been likened to an inflammatory response.5 Indeed, analyses of inflammatory mediators in gestational tissues have demonstrated that the expression of these mediators is increased during normal term labor.5,6 Although these studies of individual cytokines have hinted at parturition as an inflammatory process, the full extent of the involvement of inflammation has not yet been established.
Global expression analyses using genomic approaches including oligonucleotide and cDNA microarrays are capable of exploring the full extent of gene expression changes associated with parturition. Multiple studies have used genomic approaches to study gene expression changes in chorioamniotic membranes associated with parturition.6–10 The gene expression studies performed with chorioamniotic membranes at term, however, have not been unbiased. Specifically, gene expression analyses that use arrays with small numbers of genes selected for their involvement in the immune response are biased due to the number of genes and their selection.9,11 In addition, other genomic analyses of fetal membranes at term have focused on gene expression profiles after first culturing tissues in organ culture.10 It is not clear, however, to what degree the culture conditions influence gene expression profiles.
We undertook this study to identify the biological processes involved during normal spontaneous labor using an unbiased genome-wide approach and analyzed the transcriptome in the chorioamniotic membranes and maternal blood.
Materials and Methods
Study design
A prospective cohort study was designed to examine differential gene expression of the chorioamniotic membranes and blood between patients not in labor (TNL) and those in spontaneous labor (TIL) at term. The inclusion criteria were: 1) gestational age consistent with term gestation (38 – 41.5 weeks); 2) no medical or obstetrical complications of pregnancy; and 3) normal pregnancy outcome including an infant who was of appropriate weight for gestational age (between the 10th and 90th percentile) without congenital anomalies and APGAR scores above 7.
The TNL patients were scheduled to have elective Caesarean sections for obstetrical indications, namely, a history of a previous Caesarean section. The TIL patients had a normal spontaneous vaginal delivery (Table I). All placentas were subjected to histological examination by a pediatric pathologist (YMK) and a criterion for inclusion was the absence of histological chorioamnionitis.12
Table I.
Clinical and demographic characteristics of the study samples for chorioamniotic membrane microarrays
| Characteristic | Term In Labor (n = 12) | Term No Labor (n = 12) |
|---|---|---|
| Maternal age (y) | 21.5(21 – 24)A | 29(22 – 33)A |
| Ethnicity | ||
| African American | 11 | 7 |
| Caucasian | 1 | 2 |
| Asian | 0 | 1 |
| Hispanic | 0 | 1 |
| Others | 0 | 1 |
| Gestational Age at Delivery (wk) | 40.2(39.2 – 40.7)A | 39.0(38.7 – 39.2)A |
| Birthweight (g) | 3540(3145 – 3685)A | 3590(3360 – 3910)A |
| Dilatation at Admission (cm) | 4.5 (3.7 – 5.0)A | 0 |
| Duration of Labor (h) | 5.7 (4.8 – 8.4)A | 0 |
| Interval after rupture (h) | 5.8 (4.2 – 8.5)A | 0 |
Values are median (interquartile range).
The interval after rupture of membranes represents the time between rupture of membranes and delivery. TIL patients at admission were in active labor, as determined by their cervical dilatation state (median 4.5 cm, interquartile range 3.7 – 5.0 cm). The duration of labor was calculated by the difference between the time of admission and the time of delivery.
All women provided written informed consent prior to the collection of tissues. The collection of samples was approved by the Institutional Review Boards of both Wayne State University School of Medicine and the National Institute of Child Health and Human Development.
Isolation of total RNA
The protocols for procurement and RNA isolation from chorioamniotic membranes have been described previously.8 For the microarray experiments, 12 RNA samples from each clinical group were used. Real-time quantitative RT-PCR was carried out with 18 of the original 24 samples since some samples were exhausted in the array experiments. In addition, 25 new samples were analyzed including 13 new TIL, and 12 new TNL samples. Blood was drawn into collection tubes, which are part of the PAXgeneTM Blood RNA System (PreAnalytiX GmbH, Hombrechtikon, Switzerland) and processed according to manufacturer’s instructions (Qiagen Inc., Valencia, California, USA). For the microarray experiments, 12 TIL and 8 TNL blood samples were used.
Microarrays
Microarray expression data from the chorioamniotic membranes were collected at Expression Analysis Inc. (www.expressionanalysis.com; Durham, North Carolina, USA). A total of 10 μg of total RNA extracted from chorioamniotic membranes was used for labeling and labeled RNA was hybridized to Affymetrix HG-U133A and HG-U133B microarrays using standard conditions as described (Affymetrix Technical Manual, www.affymetrix.com).
Microarray data generated from RNA isolated from blood were collected at the Applied Genomics Technology Center of Wayne State University (www.agtc.wayne.edu; Detroit, MI, USA). Microarray probe synthesis using 1 μg of total RNA was subjected to two rounds of in vitro transcription amplification as described in the GeneChip Eukaryotic Small Sample Target Labeling Technical Note (Version I, 2001; www.affymetrix.com) with the following modifications. After the initial conversion of mRNA into cDNA and the subsequent in vitro transcription reaction, 2 μg of in vitro transcribed complementary RNA (cRNA) was used for the second round of amplification. In addition, all of the cDNA from the second amplification step was used as the starting material to generate biotin-labeled cRNA as described by the manufacturer’s protocol for the BioArray HighYield RNA Transcript Labeling Kit (Enzo, Farmingdale, New York, USA). Finally, 20 μg of labeled cRNA was serially hybridized to both the HG-U133A and HG-U133B arrays (Affymetrix, Santa Clara, California, USA).
Data Analysis
Oligonucleotide microarrays were analyzed with the R Statistical package13 using some of the packages provided by the Bioconductor Project (www.bioconductor.org). In particular, extensive use was made of the following libraries: “affy”,14 “annaffy” (written by C. Smith; www.bioconductor.org) and “Biobase”.15 Array data were pre-processed by first applying quantile normalization followed by a sequence-specific expression model as implemented in the R library “gcrma”, which is a perfect-match method.16 Normalized microarray data underwent discriminant analysis using a permutation-based t-test to rank genes whose expression was significantly different between TNL and TIL samples. Probe sets were considered significantly different if the P value generated from the permuted t-test was ≤ 0.02 and there was a minimum average expression difference of 1.4-fold between the TNL and TIL groups. These thresholds were chosen to maintain the false discovery rate (FDR)17 at 10% or less for the chorioamniotic membrane arrays; a rate considered acceptable for exploratory analyses. Specifically, the FDR for the probe sets from the HG-U133A arrays was 6.6%, and 10% from the HG-U133B arrays. Given the FDR values and number of discriminant genes for each set of arrays, these results indicate that no more than 16 probe sets were false positives. The FDR associated with the probe sets from the HG-U133A and HG-U133B arrays was 12.8% and 21.1%, respectively for the blood arrays. The point P value was calculated based on all permutations using the library “multtest”18. Some of the computations were performed on a linux cluster running LAM MPI (www.lam-mpi.org) using the R library “Rmpi”19 and the library “snow” (written by L. Tierney, A. J. Rossini and N. Li; cran.r-project.org).
Hierarchical clustering and clustered image maps were generated using Cluster 3.020 and Java TreeView (written by A.J. Saldanha; http://jtreeview.sourceforge.net). Hierarchical cluster analysis of samples was undertaken to explore sample classes within clinical groupings. Gene Ontology (GO) annotations were applied (www.geneontology.org) and interpreted based on results produced by the software GO Tree Machine.21 GO annotation provides hierarchically structured classifications for genes under the broad categories “Molecular Function,” “Biological Process” and “Cellular Component.”22 GO Tree Machine uses Fisher's exact test to calculate the significance of representation of GO Biological Process categories relative to the frequency expected to occur by chance given the GO annotation for the U133 set.21 Since identical GO categories may appear at multiple hierarchical levels, the number of distinct statistical tests for a specific category was determined and used to correct the point-wise P value using the Sidak correction.23 The analysis was restricted to GO Biological Process categories at level 4 of the hierarchy to provide a coherent interpretation of the data.
A Kruskal-Wallis test was used to determine the significance of an association of TIL sub-classes with respect to both the interval after rupture of membranes and the duration of labor. In addition, an empirical Bayesian generalized linear model was used for the analysis of regression coefficients to determine the significance of association of the “acute inflammation gene expression signature” with both the interval after rupture of membranes and the duration of labor.24 A similar statistical model was used to determine the significance of TIL and TNL sub-classes with respect to the “acute inflammation gene expression signature” using logistic regression.24
Real-time quantitative RT-PCR assays
TaqMan (Applied Biosystems) 5′-nuclease qRT-PCR assays were used to measure mRNA levels independently for eight genes listed below. The GenBank accession number or the Reference Sequence database accession, followed by the Gene IDs, respectively, are listed in parenthesis after each gene symbol: IL8 (C013615; 3576), TLR2 (F502291; 7097), CXCL1 (NM_001511; 2919), CXCL2 (NM_002089; 2920), CXCL3 (NM_002090; 2921), CCL20 (NM_004591; 6364), IL6 (NM_000600; 3569), and PBEF (NM_005746; 10135). Full length gene names can be found at www.ncbi.nlm.nih.gov/entrez/query.fcgi?CMD=search&DB=gene. Gene expression determinations were as described.8 Differential expression between clinical groups was calculated using log-transformed data and a one-sided Mann-Whitney U test.
Results
Identification of discriminant genes
Transcriptional profiling of chorioamniotic membrane tissue was carried out to identify molecular mechanisms involved in human parturition. Tissue samples were obtained from 12 patients who had normal spontaneous labor at term (term in labor; TIL), and from 12 patients who were not in labor at term (term no labor; TNL) and delivered by elective Cesarean section (Table I). Using both Affymetrix HG-U133A and HG-U133B arrays allowed an unbiased analysis of virtually all known and predicted transcripts (http://www.affymetrix.com/products/arrays/specific/hgu133.affx). Discriminant analysis demonstrated that there were 185 and 39 probe sets from the HG-U133A and HG-U133B arrays, respectively, which differed in expression between TIL samples and their TNL counterparts. These discriminant probe sets correspond to 197 unique transcripts in total, as defined by NCBI Gene. The complete list of the 224 probe sets is presented in Table II.
Table II.
Complete list of 224 probe sets showing differential expression between TIL and TNL samples.
| Rank | Probe Set | Gene ID | SymbolA | AliasB | Gene NameC | Fold ChangeD | PvalueE |
|---|---|---|---|---|---|---|---|
| 1 | 209774_x_at | 2920 | CXCL2 | GRO2, GROb, MIP2, MIP2A, SCYB2, MGSA, MIP, CINC | chemokine (C-X-C motif) ligand 2 | 6.5 | 0.000004 |
| 2 | 211506_s_at | 3576 | IL8 | K60, NAF, GCP1, IL, LECT, LUCT, NAP1, 3, CXCL8, GCP, LYNAP, MDNCF, MONAP, NAP, SCYB8, TSG, AMCF, b | interleukin 8 | 18.4 | 0.000012 |
| 3 | 205289_at | 650 | BMP2 | BMP2A | bone morphogenetic protein 2 | 4.6 | 0.000021 |
| 4 | 207850_at | 2921 | CXCL3 | GRO3, GROg, MIP2B, SCYB3, MIP, CINC | chemokine (C-X-C motif) ligand 3 | 6.5 | 0.000029 |
| 5 | 205290_s_at | 650 | BMP2 | BMP2A | bone morphogenetic protein 2 | 3.7 | 0.000046 |
| 6 | 206777_s_at | 1415 | CRYBB2 | CCA2, CRYB2, CRYB2A, D22S665 | crystallin, beta B2 | 2.5 | 0.000064 |
| 7 | 202859_x_at | 3576 | IL8 | K60, NAF, GCP1, IL, LECT, LUCT, NAP1, 3, CXCL8, GCP, LYNAP, MDNCF, MONAP, NAP, SCYB8, TSG, AMCF, b | interleukin 8 | 4.0 | 0.000072 |
| 8 | 212548_s_at | 23045 | KIAA0826 | KIAA0826 protein | −1.5 | 0.000077 | |
| 9 | 204470_at | 2919 | CXCL1 | GRO1, GROa, MGSA, NAP, SCYB1, MGSA | chemokine (C-X-C motif) ligand 1 (melanoma growth stimulating activity, alpha) | 5.7 | 0.000092 |
| 10 | 205476_at | 6364 | CCL20 | CKb4, LARC, ST38, MIP3A, MIP, SCYA20 | chemokine (C-C motif) ligand 20 | 4.9 | 0.000097 |
| 11 | 201631_s_at | 8870 | IER3 | DIF2, IEX1, PRG1, DIF, GLY96, IEX, IEX | immediate early response 3 | 4.3 | 0.0001 |
| 12 | 205207_at | 3569 | IL6 | HGF, HSF, BSF2, IL, IFNB2 | interleukin 6 (interferon, beta 2) | 5.3 | 0.00015 |
| 13 | 225955_at | 284207 | LOC284207 | hypothetical protein LOC284207 | 1.7 | 0.00018 | |
| 14 | 209289_at | 4781 | NFIB | NFIB2, NFIB3, NFI | nuclear factor I/B | −1.9 | 0.00024 |
| 15 | 227697_at | 9021 | SOCS3 | CIS3, Cish3, SSI, SOCS, MGC71791 | suppressor of cytokine signaling 3 | 2.1 | 0.00029 |
| 16 | 202259_s_at | 10443 | CG005 | hypothetical protein from BCRA2 region | −1.6 | 0.00029 | |
| 17 | 46270_at | 51271 | UBAP1 | UAP, UBAP, NAG20, MGC8710 | ubiquitin associated protein 1 | 1.5 | 0.0003 |
| 18 | 202122_s_at | 10226 | TIP47 | PP17, TIP47, MGC2012, MGC11117 | cargo selection protein (mannose 6 phosphate receptor binding protein) | 1.5 | 0.00033 |
| 19 | 207316_at | 3036 | HAS1 | HAS | hyaluronan synthase 1 | 1.6 | 0.00035 |
| 20 | 224809_x_at | 26277 | TINF2 | TIN2 | TERF1 (TRF1)-interacting nuclear factor 2 | 1.5 | 0.00037 |
| 21 | 217738_at | 10135 | PBEF | PBEF | pre-B-cell colony-enhancing factor | 2.0 | 0.0004 |
| 22 | 214446_at | 22936 | ELL2 | elongation factor, RNA polymerase II, 2 | 1.4 | 0.00042 | |
| 23 | 36711_at | 23764 | MAFF | U | v-maf musculoaponeurotic fibrosarcoma oncogene homolog F (avian) | 2.1 | 0.00045 |
| 24 | 224739_at | 64840 | PPN | PPN, por, MG61, PORC, MGC29687 | likely ortholog of mouse porcupine homolog (Drosophila) | 1.6 | 0.00061 |
| 25 | 202637_s_at | 3383 | ICAM1 | BB2, CD54 | intercellular adhesion molecule 1 (CD54), human rhinovirus receptor | 1.6 | 0.00066 |
| 26 | 200666_s_at | 3337 | DNAJB1 | HSPF1 | DnaJ (Hsp40) homolog, subfamily B, member 1 | 2.1 | 0.00067 |
| 27 | 212185_x_at | 4502 | MT2A | MT2 | metallothionein 2A | −1.0 | 0.00072 |
| 28 | 235549_at | 255488 | IBRDC2 | p53RFP, MGC71786, bA528A10 | IBR domain containing 2 | 1.9 | 0.00074 |
| 29 | 212327_at | 22998 | KIAA1102 | KIAA1102 protein | −2.1 | 0.00076 | |
| 30 | 202643_s_at | 7128 | TNFAIP3 | A20, TNFA1P2 | tumor necrosis factor, alpha-induced protein 3 | 2.6 | 0.00078 |
| 31 | 215223_s_at | 6648 | SOD2 | IPO, MNSOD | superoxide dismutase 2, mitochondrial | 2.6 | 0.00086 |
| 32 | 205193_at | 23764 | MAFF | U | v-maf musculoaponeurotic fibrosarcoma oncogene homolog F (avian) | 1.5 | 0.00093 |
| 33 | 216607_s_at | 83530 | CYP51P2 | cytochrome P450, subfamily 51 pseudogene 2 | 2.3 | 0.00097 | |
| 34 | 207196_s_at | 10318 | TNIP1 | VAN, NAF1, ABIN, KIAA0113 | TNFAIP3 interacting protein 1 | 1.7 | 0.001 |
| 35 | 209706_at | 4824 | NKX3-1 | NKX3A, NKX3 | NK3 transcription factor related, locus 1 (Drosophila) | 1.5 | 0.0011 |
| 36 | 203665_at | 3162 | HMOX1 | HO, bK286B10 | heme oxygenase (decycling) 1 | 2.5 | 0.0011 |
| 37 | 212328_at | 22998 | KIAA1102 | KIAA1102 protein | −2.5 | 0.0012 | |
| 38 | 217739_s_at | 10135 | PBEF | PBEF | pre-B-cell colony-enhancing factor | 2.1 | 0.0013 |
| 39 | 201502_s_at | 4792 | NFKBIA | IKBA,MAD,NFKBI | nuclear factor of kappa light polypeptide gene enhancer in B-cells inhibitor, alpha | 2.0 | 0.0014 |
| 40 | 204924_at | 7097 | TLR2 | TIL4 | toll-like receptor 2 | 2.1 | 0.0014 |
| 41 | 242239_at | 221078 | FLJ23743 | hypothetical protein FLJ23743 | −1.4 | 0.0014 | |
| 42 | 212199_at | 114932 | MGC9651 | hypothetical protein MGC9651 | −1.4 | 0.0014 | |
| 43 | 213524_s_at | 50486 | G0S2 | putative lymphocyte G0/G1 switch gene | 3.0 | 0.0015 | |
| 44 | 205239_at | 374 | AREG | AR, SDGF, CRDGF, MGC13647 | 2.6 | 0.0016 | |
| 45 | 209037_s_at | 10938 | EHD1 | PAST, PAST1, H, HPAST1 | EH-domain containing 1 | 1.6 | 0.0016 |
| 46 | 203045_at | 4814 | NINJ1 | NIN1, NINJURIN | ninjurin 1 | 1.5 | 0.0016 |
| 47 | 219955_at | 54596 | FLJ10884 | hypothetical protein FLJ10884 | −2.1 | 0.0016 | |
| 48 | 214974_x_at | 6374 | CXCL5 | SCYB5, ENA | chemokine (C-X-C motif) ligand 5 | 5.3 | 0.0017 |
| 49 | 229218_at | 1278 | COL1A2 | OI4 | collagen, type I, alpha 2 | −1.5 | 0.0017 |
| 50 | 207442_at | 1440 | CSF3 | GCSF, G, MGC45931 | colony stimulating factor 3 (granulocyte) | 3.0 | 0.0018 |
| 51 | 205767_at | 2069 | EREG | ER | epiregulin | 2.5 | 0.002 |
| 52 | 227698_s_at | 57799 | RAB40C | RARL, RASL8C | RAB40C, member RAS oncogene family | 1.6 | 0.0022 |
| 53 | 201325_s_at | 2012 | EMP1 | TMP, CL | epithelial membrane protein 1 | 1.9 | 0.0022 |
| 54 | 213528_at | 92342 | MGC9084 | hypothetical protein MGC9084 | −1.4 | 0.0022 | |
| 55 | 206157_at | 5806 | PTX3 | TSG | pentaxin-related gene, rapidly induced by IL-1 beta | 3.0 | 0.0023 |
| 56 | 204956_at | 4507 | MTAP | MSAP, c86fus | methylthioadenosine phosphorylase | −1.5 | 0.0023 |
| 57 | 203699_s_at | 1734 | DIO2 | SelY, TXDI2 | deiodinase, iodothyronine, type II | −2.1 | 0.0023 |
| 58 | 216840_s_at | 3908 | LAMA2 | LAMM | laminin, alpha 2 (merosin, congenital muscular dystrophy) | −1.6 | 0.0024 |
| 59 | 242444_at | 114904 | C1QTNF6 | CTRP6, ZACRP6 | C1q and tumor necrosis factor related protein 6 | 1.9 | 0.0025 |
| 60 | 226907_at | 81706 | PPP1R14C | KEPI, NY, CPI17 | protein phosphatase 1, regulatory (inhibitor) subunit 14C | 2.1 | 0.0026 |
| 61 | 217996_at | 22822 | PHLDA1 | TDAG51, DT1P1B11 | pleckstrin homology-like domain, family A, member 1 | 3.0 | 0.0028 |
| 62 | 205087_at | 25950 | RWDD3 | DKFZP566K023 | RWD domain containing 3 | −1.5 | 0.0028 |
| 63 | 228485_s_at | 23446 | CDW92 | CTL1,CHTL1 | CDw92 antigen | 2.0 | 0.0029 |
| 64 | 212048_s_at | 57648 | KIAA1522 | KIAA1522 protein | 1.6 | 0.0031 | |
| 65 | 213243_at | 157680 | COH1 | CHS1, VPS13B, KIAA0532, DKFZp313I0811 | Cohen syndrome 1 | −1.5 | 0.0031 |
| 66 | 202011_at | 7082 | TJP1 | ZO | tight junction protein 1 (zona occludens 1) | −1.5 | 0.0031 |
| 67 | 206359_at | 9021 | SOCS3 | CIS3, Cish3, SSI, SOCS, MGC71791 | suppressor of cytokine signaling 3 | 2.1 | 0.0032 |
| 68 | 224927_at | 170954 | KIAA1949 | KIAA1949 protein | 1.6 | 0.0034 | |
| 69 | 205664_at | 22944 | KIN | BTCD, KIN17 | KIN, antigenic determinant of recA protein homolog (mouse) | −1.6 | 0.0034 |
| 70 | 205100_at | 9945 | GFPT2 | GFAT2 | glutamine-fructose-6-phosphate transaminase 2 | 2.6 | 0.0036 |
| 71 | 203815_at | 2952 | GSTT1 | glutathione S-transferase theta 1 | −2.0 | 0.0036 | |
| 72 | 213796_at | NA | NA | NA | 2.3 | 0.0037 | |
| 73 | 220044_x_at | 51747 | LUC7A | cisplatin resistance-associated overexpressed protein | −1.5 | 0.0037 | |
| 74 | 218810_at | 80149 | FLJ23231 | hypothetical protein FLJ23231 | 2.0 | 0.0038 | |
| 75 | 211456_x_at | 350817 | NA | NA | −1.0 | 0.0039 | |
| 76 | 215385_at | NA | NA | NA | −1.4 | 0.0039 | |
| 77 | 216080_s_at | 2237 | FEN1 | MF1, RAD2, FEN | flap structure-specific endonuclease 1 | 1.9 | 0.0042 |
| 78 | 214751_at | 90333 | LOC90333 | hypothetical protein LOC90333 | −1.6 | 0.0042 | |
| 79 | 208137_x_at | 81856 | MGC5384 | MGC5384 | hypothetical protein MGC5384 | −1.6 | 0.0043 |
| 80 | 225185_at | 22808 | MRAS | M, RRAS3, R | muscle RAS oncogene homolog | 1.9 | 0.0044 |
| 81 | 209704_at | 22823 | M96 | likely ortholog of mouse metal response element binding transcription factor 2 | −1.6 | 0.0044 | |
| 82 | 217997_at | 22822 | PHLDA1 | TDAG51, DT1P1B11 | pleckstrin homology-like domain, family A, member 1 | 3.0 | 0.0045 |
| 83 | 228846_at | 4084 | MAD | MXD1 | MAX dimerization protein 1 | 2.3 | 0.0045 |
| 84 | 243134_at | NA | NA | NA | −1.5 | 0.0045 | |
| 85 | 214715_x_at | 90338 | KR18 | F11, HZF5, KR18, HKr18, FLJ00032, KIAA1611 | KRAB zinc finger protein KR18 | −1.6 | 0.0045 |
| 86 | 212774_at | 10472 | ZNF238 | RP58, TAZ, ZBTB18, C2H2 | zinc finger protein 238 | −1.9 | 0.0046 |
| 87 | 216841_s_at | 6648 | SOD2 | IPO, MNSOD | superoxide dismutase 2, mitochondrial | 2.0 | 0.0047 |
| 88 | 222853_at | 23767 | FLRT3 | fibronectin leucine rich transmembrane protein 3 | 2.0 | 0.0047 | |
| 89 | 202685_s_at | 558 | AXL | UFO | 1.4 | 0.0049 | |
| 90 | 212207_at | 23389 | KIAA1025 | KIAA1025, TRAP240L, PROSIT240 | KIAA1025 protein | −1.6 | 0.0049 |
| 91 | 219232_s_at | 112399 | EGLN3 | PHD3, HIFPH3, FLJ21620 | egl nine homolog 3 (C. elegans) | −1.2 | 0.0049 |
| 92 | 221599_at | 28971 | PTD015 | FLJ21035 | PTD015 protein | −1.7 | 0.005 |
| 93 | 202133_at | 25937 | TAZ | transcriptional co-activator with PDZ-binding motif (TAZ) | −1.4 | 0.0051 | |
| 94 | 200664_s_at | 3337 | DNAJB1 | HSPF1 | DnaJ (Hsp40) homolog, subfamily B, member 1 | 1.7 | 0.0052 |
| 95 | 224368_s_at | 57446 | NDRG3 | FLJ13556 | NDRG family member 3 | 1.7 | 0.0053 |
| 96 | 205114_s_at | 6348 | CCL3 | MIP1A, SCYA3, LD78ALPHA, MIP | chemokine (C-C motif) ligand 3 | 2.3 | 0.0054 |
| 97 | 205119_s_at | 2357 | FPR1 | FPR, FMLP | formyl peptide receptor 1 | 2.0 | 0.0057 |
| 98 | 222549_at | 9076 | CLDN1 | CLD1, SEMP1 | claudin 1 | 1.7 | 0.0057 |
| 99 | 204894_s_at | 8639 | AOC3 | HPAO, VAP1, VAP | −1.4 | 0.0058 | |
| 100 | 212761_at | 6934 | TCF7L2 | TCF4, TCF | transcription factor 7-like 2 (T-cell specific, HMG-box) | −2.0 | 0.0058 |
| 101 | 235629_at | NA | NA | NA | −2.6 | 0.006 | |
| 102 | 203083_at | 7058 | THBS2 | TSP2 | thrombospondin 2 | −1.9 | 0.006 |
| 103 | 230660_at | 56256 | DJ667H12.2 | DJ667H12 | hypothetical protein DJ667H12.2 | −1.4 | 0.006 |
| 104 | 209377_s_at | 9324 | HMGN3 | TRIP7, PNAS | high mobility group nucleosomal binding domain 3 | −2.0 | 0.006 |
| 105 | 209703_x_at | 25840 | DKFZP586A0522 | DKFZP586A0522 protein | −1.4 | 0.0061 | |
| 106 | 212921_at | 56950 | SMYD2 | HSKM, ZMYND14 | SET and MYND domain containing 2 | −1.5 | 0.0063 |
| 107 | 218303_x_at | 51315 | LOC51315 | hypothetical protein LOC51315 | −1.4 | 0.0064 | |
| 108 | 204836_at | 2731 | GLDC | GCE, NKH, GCSP, HYGN1 | glycine dehydrogenase (decarboxylating; glycine decarboxylase, glycine cleavage system protein P) | −2.3 | 0.0064 |
| 109 | 206765_at | 3759 | KCNJ2 | IRK1, LQT7, HHIRK1, KIR2, HHBIRK1 | potassium inwardly-rectifying channel, subfamily J, member 2 | −1.9 | 0.0065 |
| 110 | 219250_s_at | 23767 | FLRT3 | fibronectin leucine rich transmembrane protein 3 | 2.3 | 0.0066 | |
| 111 | 221009_s_at | 51129 | ANGPTL4 | ARP4, FIAF, PGAR, HFARP, PPARG, pp1158, ANGPTL2 | 2.8 | 0.0068 | |
| 112 | 205595_at | 1830 | DSG3 | PVA, CDHF6 | desmoglein 3 (pemphigus vulgaris antigen) | 1.4 | 0.0068 |
| 113 | 234066_at | 9173 | IL1RL1 | T1, ST2, DER4, ST2L, ST2V, FIT, MGC32623 | interleukin 1 receptor-like 1 | 2.3 | 0.0069 |
| 114 | 219564_at | 3773 | KCNJ16 | KIR5, MGC33717 | potassium inwardly-rectifying channel, subfamily J, member 16 | −2.1 | 0.0069 |
| 115 | 212538_at | 23348 | zizimin1 | ZIZ1, KIAA1058, zizimin1 | zizimin1 | −2.5 | 0.007 |
| 116 | 211464_x_at | 839 | CASP6 | MCH2 | caspase 6, apoptosis-related cysteine protease | −1.5 | 0.007 |
| 117 | 225910_at | 284019 | LOC284019 | hypothetical protein LOC284019 | −1.7 | 0.007 | |
| 118 | 242051_at | NA | NA | NA | −1.7 | 0.0071 | |
| 119 | 218691_s_at | 8572 | RIL | RIL | LIM domain protein | 1.6 | 0.0074 |
| 120 | 216243_s_at | 3557 | IL1RN | IRAP, IL1F3, IL1RA, ICIL, MGC10430 | interleukin 1 receptor antagonist | 1.9 | 0.0075 |
| 121 | 204984_at | 2239 | GPC4 | glypican 4 | −1.9 | 0.0075 | |
| 122 | 201471_s_at | 8878 | SQSTM1 | p60, p62, PDB3, ZIP3 | sequestosome 1 | 1.5 | 0.0076 |
| 123 | 219802_at | 79912 | FLJ22028 | hypothetical protein FLJ22028 | −1.4 | 0.0076 | |
| 124 | 225018_at | 56907 | Spir-1 | Spir, KIAA1135 | Spir-1 protein | 1.7 | 0.0078 |
| 125 | 206461_x_at | 4496 | MT1H | MT1 | metallothionein 1H | 2.0 | 0.0079 |
| 126 | 219313_at | 54762 | DKFZp434C0328 | hypothetical protein DKFZp434C0328 | −2.0 | 0.0079 | |
| 127 | 243683_at | 9643 | MORF4L2 | MRGX, MORFL2, KIAA0026 | mortality factor 4 like 2 | −2.1 | 0.008 |
| 128 | 213546_at | 222161 | DKFZp586I1420 | hypothetical protein DKFZp586I1420 | −1.5 | 0.008 | |
| 129 | 217185_s_at | 10729 | ZNF259P | 354J5 | zinc finger protein 259, pseudogene | 1.4 | 0.0082 |
| 130 | 208694_at | 5591 | PRKDC | HYRC, p350, DNAPK, DNPK1, HYRC1, XRCC7 | protein kinase, DNA-activated, catalytic polypeptide | −1.7 | 0.0082 |
| 131 | 201099_at | 8239 | USP9X | DFFRX | ubiquitin specific protease 9, X-linked (fat facets-like, Drosophila) | −1.4 | 0.0083 |
| 132 | 218506_x_at | 84656 | Interim: N-PAC: | HIBDL | Interim: cytokine-like nuclear factor n-pac | 1.4 | 0.0085 |
| 133 | 224169_at | 10886 | GPR74 | NPFF2, NPGPR | G protein-coupled receptor 74 | 2.5 | 0.0086 |
| 134 | 202708_s_at | 8349 | HIST2H2BE | H2B, GL105, H2B, H2B, H2BFQ | histone 2, H2be | 1.5 | 0.0086 |
| 135 | 214224_s_at | 5303 | PIN4 | EPVH, PAR14 | protein (peptidyl-prolyl cis/trans isomerase) NIMA-interacting, 4 (parvulin) | −1.4 | 0.0086 |
| 136 | 205681_at | 597 | BCL2A1 | GRS, BFL1, HBPA1, BCL2L5 | 2.3 | 0.0088 | |
| 137 | 204742_s_at | 23047 | APRIN | AS3, CG008, FLJ23236, KIAA0979 | −1.5 | 0.0088 | |
| 138 | 207606_s_at | 94134 | ARHGAP12 | FLJ10971, FLJ20737, FLJ21785 | −1.5 | 0.0088 | |
| 139 | 201960_s_at | 23077 | PAM | PAM, FLJ10106, KIAA0916 | protein associated with Myc | −1.9 | 0.0089 |
| 140 | 201219_at | 54764 | ZRANB1 | TRABID | zinc finger, RAN-binding domain containing 1 | −1.5 | 0.0089 |
| 141 | 205568_at | 366 | AQP9 | SSC1, HsT17287 | 1.7 | 0.0092 | |
| 142 | 212987_at | 22858 | ICK | MRK, LCK2, KIAA0936, MGC46090 | intestinal cell (MAK-like) kinase | −1.6 | 0.0093 |
| 143 | 209239_at | 4790 | NFKB1 | KBF1, EBP, MGC54151, NFKB, NFKB, NF | nuclear factor of kappa light polypeptide gene enhancer in B-cells 1 (p105) | 1.4 | 0.0096 |
| 144 | 212266_s_at | 6430 | SFRS5 | HRS, SRP40 | splicing factor, arginine/serine-rich 5 | −1.3 | 0.0096 |
| 145 | 210873_x_at | 200315 | APOBEC3A | ARP3, PHRBN | 1.5 | 0.0097 | |
| 146 | 203380_x_at | 6430 | SFRS5 | HRS, SRP40 | splicing factor, arginine/serine-rich 5 | −1.6 | 0.0097 |
| 147 | 241681_at | NA | NA | NA | −1.7 | 0.0097 | |
| 148 | 203427_at | 25842 | ASF1A | CIA, DKFZP547E2110 | −1.4 | 0.0098 | |
| 149 | 208882_s_at | 51366 | DD5 | HYD, KIAA0896 | progestin induced protein | −1.5 | 0.0099 |
| 150 | 226031_at | 55610 | FLJ20097 | KIAA1861 | hypothetical protein FLJ20097 | −1.5 | 0.0099 |
| 151 | 218490_s_at | 55900 | ZNF302 | ZNF327, ZNF135L, ZNF140L | zinc finger protein 302 | −1.6 | 0.0099 |
| 152 | 202284_s_at | 1026 | CDKN1A | P21, CIP1, SDI1, WAF1, CAP20, CDKN1, MDA | cyclin-dependent kinase inhibitor 1A (p21, Cip1) | 1.7 | 0.01 |
| 153 | 200790_at | 4953 | ODC1 | ornithine decarboxylase 1 | 1.5 | 0.01 | |
| 154 | 208018_s_at | 3055 | HCK | JTK9 | hemopoietic cell kinase | 1.4 | 0.01 |
| 155 | 209290_s_at | 4781 | NFIB | NFIB2, NFIB3, NFI | nuclear factor I/B | −1.5 | 0.01 |
| 156 | 203132_at | 5925 | RB1 | RB, OSRC | retinoblastoma 1 (including osteosarcoma) | −1.5 | 0.01 |
| 157 | 205099_s_at | 1230 | CCR1 | CKR, HM145, CMKBR1, MIP1aR, SCYAR1 | chemokine (C-C motif) receptor 1 | −1.6 | 0.01 |
| 158 | 210675_s_at | 5801 | PTPRR | EC, PCPTP1, PTP, PTPBR7 | protein tyrosine phosphatase, receptor type, R | −2.0 | 0.01 |
| 159 | 209242_at | 5178 | PEG3 | PW1, KIAA0287 | paternally expressed 3 | −1.7 | 0.01 |
| 160 | 202833_s_at | 5265 | SERPINA1 | PI, A1A, AAT, PI1, A1AT, MGC9222, MGC23330 | serine (or cysteine) proteinase inhibitor, clade A (alpha-1 antiproteinase, antitrypsin), member 1 | 2.0 | 0.011 |
| 161 | 209182_s_at | 11067 | DEPP | FIG, DEPP | decidual protein induced by progesterone | 2.0 | 0.011 |
| 162 | 242809_at | 9173 | IL1RL1 | T1, ST2, DER4, ST2L, ST2V, FIT, MGC32623 | interleukin 1 receptor-like 1 | 2.0 | 0.011 |
| 163 | 224840_at | 2289 | FKBP5 | P54, FKBP51, FKBP54, PPIase, Ptg | FK506 binding protein 5 | 1.7 | 0.011 |
| 164 | 206336_at | 6372 | CXCL6 | GCP2, CKA, GCP, SCYB6 | chemokine (C-X-C motif) ligand 6 (granulocyte chemotactic protein 2) | 2.3 | 0.011 |
| 165 | 210118_s_at | 3552 | IL1A | IL1, IL, IL1F1, IL1 | interleukin 1, alpha | 2.1 | 0.011 |
| 166 | 218919_at | 79752 | FLJ14007 | hypothetical protein FLJ14007 | −1.6 | 0.011 | |
| 167 | 215978_x_at | 152719 | LOC152719 | hypothetical protein LOC152719 | −1.6 | 0.011 | |
| 168 | 225667_s_at | 151354 | NSE1 | NSE1 | −1.4 | 0.011 | |
| 169 | 216187_x_at | NA | NA | NA | −1.6 | 0.011 | |
| 170 | 220079_s_at | 84196 | USP48 | USP31, FLJ11328, FLJ20103, FLJ23054, FLJ23277, MGC14879 | ubiquitin specific protease 48 | −1.4 | 0.011 |
| 171 | 202644_s_at | 7128 | TNFAIP3 | A20, TNFA1P2 | tumor necrosis factor, alpha- induced protein 3 | 2.3 | 0.012 |
| 172 | 218136_s_at | 51312 | MSCP | HT015, PRO1278, PRO1584 | mitochondrial solute carrier protein | 1.7 | 0.012 |
| 173 | 203234_at | 7378 | UPP1 | UP, UPP, UPASE, UDRPASE | uridine phosphorylase 1 | 1.6 | 0.012 |
| 174 | 226710_at | 349185 | NA | NA | 1.5 | 0.012 | |
| 175 | 201169_s_at | 8553 | BHLHB2 | DEC1, STRA13, Stra14 | 3.0 | 0.012 | |
| 176 | 212616_at | 80205 | FLJ12178 | AD013 | hypothetical protein FLJ12178 | −1.5 | 0.012 |
| 177 | 218128_at | 4801 | NFYB | HAP3, CBF, CBF, | nuclear transcription factor Y, beta | −1.9 | 0.012 |
| 178 | 206084_at | 5801 | PTPRR | EC, PCPTP1, PTP, PTPBR7 | protein tyrosine phosphatase, receptor type, R | −1.7 | 0.012 |
| 179 | 221185_s_at | 84223 | DKFZp434B227 | FLJ23571 | hypothetical protein DKFZp434B227 | 2.3 | 0.013 |
| 180 | 209305_s_at | 4616 | GADD45B | MYD118, GADD45BETA, DKFZP566B133 | growth arrest and DNA-damage- inducible, beta | 1.7 | 0.013 |
| 181 | 201192_s_at | 5306 | PITPN | VIB1A, PITPNA | phosphotidylinositol transfer protein | 1.4 | 0.013 |
| 182 | 205547_s_at | 6876 | TAGLN | SM22, SMCC, WS3 | transgelin | −1.7 | 0.013 |
| 183 | 233893_s_at | 57654 | KIAA1530 | KIAA1530 protein | −1.4 | 0.013 | |
| 184 | 213519_s_at | 3908 | LAMA2 | LAMM | laminin, alpha 2 (merosin, congenital muscular dystrophy) | −1.4 | 0.013 |
| 185 | 205029_s_at | 2173 | FABP7 | MRG, FABPB, B | fatty acid binding protein 7, brain | −3.0 | 0.013 |
| 186 | 201579_at | 2195 | FAT | ME5, CDHF7 | FAT tumor suppressor homolog 1 (Drosophila) | −1.6 | 0.013 |
| 187 | 201695_s_at | 4860 | NP | PNP | nucleoside phosphorylase | 1.7 | 0.014 |
| 188 | 208581_x_at | 4501 | MT1X | MT1, MT | metallothionein 1X | 2.0 | 0.014 |
| 189 | 212144_at | 25777 | UNC84B | SUN2, KIAA0668 | unc-84 homolog B (C. elegans) | 1.4 | 0.014 |
| 190 | 210992_x_at | 2213 | FCGR2B | CD32, FCG2, FCGR2, IGFR2 | Fc fragment of IgG, low affinity IIb, receptor for (CD32) | 1.4 | 0.014 |
| 191 | 208246_x_at | 54782 | FLJ20006 | hypothetical protein FLJ20006 | −1.6 | 0.014 | |
| 192 | 242195_x_at | 9253 | NUMBL | NBL, CAG3A, CTG3a, NUMBR, NUMB, TNRC23 | numb homolog (Drosophila)-like | −1.5 | 0.014 |
| 193 | 212483_at | 25836 | IDN3 | CDLS, IDN3, IDN3, FLJ11203, FLJ12597, FLJ13354, FLJ13648, DKFZp434L1319 | IDN3 protein | −1.4 | 0.014 |
| 194 | 222266_at | 8725 | C19orf2 | RMP, URI, NNX3, FLJ10575 | chromosome 19 open reading frame 2 | −1.5 | 0.014 |
| 195 | 234762_x_at | 57486 | NLN | KIAA1226 | neurolysin (metallopeptidase M3 family) | −1.5 | 0.014 |
| 196 | 208370_s_at | 1827 | DSCR1 | CSP1, DSC1, RCN1, MCIP1, ADAPT78 | Down syndrome critical region gene 1 | 1.7 | 0.015 |
| 197 | 209122_at | 123 | ADFP | ADRP, MGC10598 | 2.0 | 0.015 | |
| 198 | 212657_s_at | 3557 | IL1RN | IRAP, IL1F3, IL1RA, ICIL, MGC10430 | interleukin 1 receptor antagonist | 3.2 | 0.015 |
| 199 | 216268_s_at | 182 | JAG1 | AGS, AHD, AWS, HJ1, JAGL1 | jagged 1 (Alagille syndrome) | −1.7 | 0.015 |
| 200 | 212637_s_at | 11059 | WWP1 | AIP5, Tiul1, hSDRP1, DKFZp434D2111 | WW domain- containing protein 1 | −1.4 | 0.015 |
| 201 | 204103_at | 6351 | CCL4 | ACT2, G, LAG1, Act, MIP1B, SCYA4, AT744, MIP | chemokine (C-C motif) ligand 4 | 2.0 | 0.016 |
| 202 | 201737_s_at | 10299 | TEB4 | similar to S. cerevisiae SSM4 | −1.5 | 0.016 | |
| 203 | 203566_s_at | 178 | AGL | GDE | −1.9 | 0.016 | |
| 204 | 205047_s_at | 440 | ASNS | TS11 | 1.7 | 0.017 | |
| 205 | 211924_s_at | 5329 | PLAUR | CD87, UPAR, URKR | plasminogen activator, urokinase receptor | 1.7 | 0.017 |
| 206 | 228132_at | 84448 | ABLIM2 | KIAA1808 | 1.5 | 0.017 | |
| 207 | 224896_s_at | NA | NA | NA | 1.4 | 0.017 | |
| 208 | 228221_at | 126969 | MGC45474 | hypothetical protein MGC45474 | 1.7 | 0.017 | |
| 209 | 209717_at | 7813 | EVI5 | NB4S | ecotropic viral integration site 5 | −1.4 | 0.017 |
| 210 | 204779_s_at | 3217 | HOXB7 | HOX2, HOX2C, HHO, Hox | homeo box B7 | −1.4 | 0.017 |
| 211 | 214594_x_at | 5205 | ATP8B1 | BRIC, FIC1, PFIC, ATPIC, PFIC1 | −1.6 | 0.017 | |
| 212 | 218701_at | 51110 | CGI-83 | CGI | lactamase, beta 2 | −1.7 | 0.017 |
| 213 | 205030_at | 2173 | FABP7 | MRG, FABPB, B | fatty acid binding protein 7, brain | −2.3 | 0.017 |
| 214 | 209012_at | 7204 | TRIO | triple functional domain (PTPRF interacting) | −1.6 | 0.017 | |
| 215 | 212201_at | 23141 | KIAA0692 | KIAA0692 protein | 1.4 | 0.018 | |
| 216 | 236534_at | 149428 | BNIP-S | PP753, BNIP, BNIPL1, BNIPL2, BNIPL, BNIPL | Bcl2/adenovirus E1B interacting protein like | 2.0 | 0.018 |
| 217 | 203255_at | 80204 | FBXO11 | VIT1, FBX11, FLJ12673, MGC44383, UG063H01 | F-box protein 11 | −1.4 | 0.018 |
| 218 | 201204_s_at | 6238 | RRBP1 | ES130, ES | ribosome binding protein 1 homolog 180kDa (dog) | −1.5 | 0.018 |
| 219 | 218705_s_at | 28966 | SNX24 | SBBI31 | sorting nexing 24 | −1.4 | 0.018 |
| 220 | 217707_x_at | NA | NA | NA | −1.4 | 0.018 | |
| 221 | 218309_at | 55450 | CaMKIINalpha | MGC22256 | calcium/calmodulin- dependent protein kinase II | −2.0 | 0.018 |
| 222 | 209324_s_at | 6004 | RGS16 | RGS, A28, A28 | regulator of G- protein signalling 16 | 1.7 | 0.019 |
| 223 | 209285_s_at | 23272 | RAP140 | KIAA1105 | retinoblastoma- associated protein 140 | −1.6 | 0.019 |
| 224 | 209710_at | 2624 | GATA2 | NFE1B, MGC2306 | GATA binding protein 2 | −1.4 | 0.02 |
Symbol taken from the LocusLink Database and corresponds to official HUGO Gene Nomenclature Committee (HGNC) symbols.
Alias refers to alternative symbols.
Gene Name corresponds to the official HGNC name.
Fold change refers to expression change in TIL relative to TNL samples.
P values were calculated using a permuted Student’s t-test comparing TIL samples with their TNL counterparts.
The discriminant probe sets were subjected to hierarchical cluster analysis to investigate the consistency of gene expression patterns across similar clinical samples (Figure 1). As reflected in the dendrogram in the upper part of Figure 1, variation in gene expression within clinical groupings was evident suggesting that sub-classes exist within clinical samples. Gene expression patterns within sub-classes of clinical samples were subsequently investigated (Figure 1; refer to subsequent results and discussion).
Figure 1. Hierarchical clustering of probe sets that discriminate the chorioamniotic membrane samples of TIL patients from their TNL counterparts.
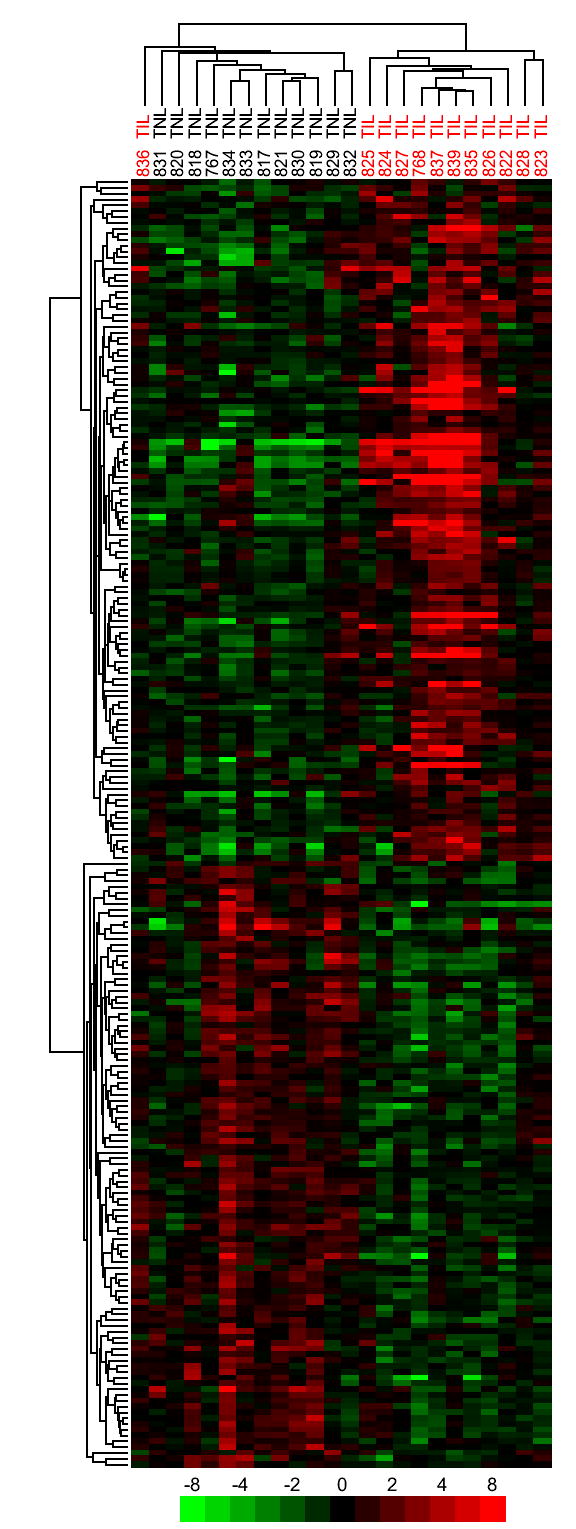
A permutation based t-test was used to find genes with altered expression between TIL and TNL samples. The top 224 probe sets (P ≤ 0.02) with a minimum average expression difference of 1.4-fold are shown.
The sub-cluster of genes representing probe sets with the lowest discriminant P values is shown in Figure 2. There were two different probe sets measuring the expression of each of IL8, SOD2, PBEF1, and PHLDA1 (Figure 2). Each of the probe sets in the pairs clustered with one another demonstrating the reproducibility of the data, as well as the consistency of gene expression across similar samples (Figure 2). This sub-cluster depicted genes that were previously implicated in parturition including IL89 and SOD2.25
Figure 2. Subcluster of discriminant probe sets with the lowest P values.
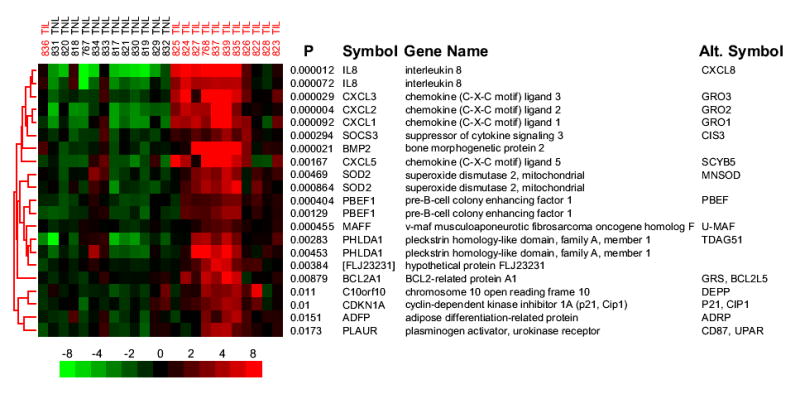
A sub-cluster of probe sets taken from the hierarchical clustering shows genes previously implicated in parturition and genes involved in the acute inflammatory response. Row labels correspond to the permuted t-test P value followed by the HUGO Gene Nomenclature Committee (HGNC) official gene symbol and include the most commonly used alternative gene symbol. The color scale and column labels follow the same conventions as Figure 1.
Gene expression changes in chorioamniotic membranes undergoing spontaneous labor are associated with the inflammatory response
The sub-cluster of genes with the smallest P values included many genes known to be involved in the inflammatory response (Figure 2). Specifically, the first 12 probe sets represent genes that have been definitively associated with the inflammatory response (Figure 2). To systematically characterize biologically meaningful patterns of gene expression changes, including the observation that many genes involved in acute inflammation were increased in TIL samples, Gene Ontology (GO) annotation was applied to all discriminant genes. The number of genes for each significantly enriched Biological Process category was plotted next to the number of genes expected to appear by chance and is presented in Figure 3A.
Figure 3. Analysis of microarray data from chorioamniotic membranes using Gene Ontology categories.
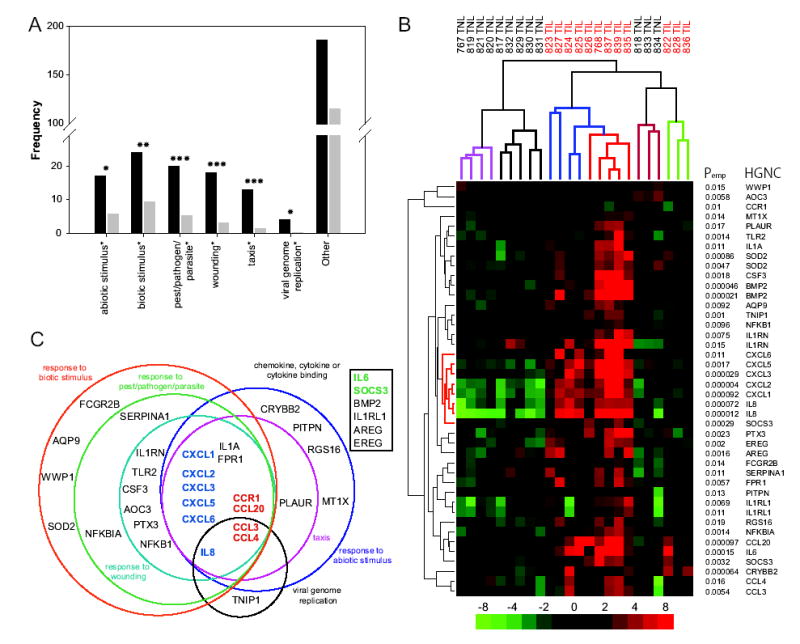
A, Graph of Gene Ontology (GO) Biological Process categories that are over-represented in the 224 discriminant probe sets. Significantly enriched GO Biological Processes from hierarchical level 4 are indicated below each set of bars. Black bars represent the number of observed, and grey bars represent the number of expected genes for that category. Symbols: ***: P < 0.00059; **: P < 0.0049; and *: P < 0.019. B, Hierarchical clustering of discriminant probe sets from selected GO categories. Discriminant probe sets either belonged to significantly enriched GO Biological Processes categories (shown in Figure 3A), or GO Molecular Activities corresponding to chemokine, cytokine, or cytokine binding (Table III). The color scale, row and column labels follow the same conventions as Figure 1. Sub-clusters of the array samples on the top dendrogram have been colored for clarity. The central gene cluster has been colored red on the left dendrogram and is discussed in the text. C, Venn diagram illustrating the relatedness of all significantly enriched GO Biological Process categories. The square box represents probe sets that were chosen by their Molecular Function. Colored gene symbols: dark blue, neutrophil chemotaxis and activation; red, monocyte chemotaxis and activation; and green, transition of acute inflammation from a predominantly neutrophilic to monocytic infiltration.
Among the down-regulated genes, there was no enrichment for GO categories. Among the genes with increased expression, six GO Biological Process categories were enriched to a statistically significant level and belonged to the following six GO Biological Processes: response to wounding (P < 3.5x10⁻⁷), taxis (P < 3.5x10⁻⁷), response to pest/pathogen/parasite (P < 5.9x10⁻⁵), response to biotic stimulus (P < 0.0049), response to abiotic stimulus (P < 0.019), and viral genome replication (P < 0.012) (Figure 3A). These significantly enriched GO Biological Process categories included 30 genes (represented by 33 unique probe sets) from the discriminant gene list. In addition to these genes, there were a number of other genes in the discriminant gene list that were relevant to the inflammatory response. Specifically, we included in subsequent interpretation six genes (represented by 9 unique probe sets) from the GO-defined Molecular Function categories of: chemokine activity, cytokine activity or cytokine binding. Collectively, these results confirmed the initial observation that a localized inflammatory response characterizes many of the gene expression differences observed between the TIL and TNL chorioamniotic membranes.
Hierarchical clustering of genes in significant GO categories reveals coordinated involvement of genes associated with acute inflammation
The probe sets from the GO categories indicated above were subjected to hierarchical cluster analysis to further investigate their expression patterns (Table III, Figure 3B). The analysis revealed sub-classes in both TNL and TIL samples. The dendrogram of the patient samples shows three major clusters that are colored for clarity (Figure 3B).
Table III.
List of 42 discriminant probe sets from selected GO categoriesA.
|
MeanE |
||||||||
|---|---|---|---|---|---|---|---|---|
| Probe Set | Gene ID | TNL PercentileB | Symbol | Gene Name | Fold ChangeC | PvalueD | TNL | TIL |
| 204894_s_at | 8639 | 12 | AOC3 | amine oxidase, copper containing 3 (vascular adhesion protein 1) | −1.4 | 0.0058 | 2.5 | 2 |
| 205568_at | 366 | 15 | AQP9 | aquaporin 9 | 1.7 | 0.0092 | 2.9 | 3.7 |
| 205239_at | 374 | 50 | AREG | amphiregulin (schwannoma-derived growth factor) | 2.6 | 0.0016 | 5.8 | 7.2 |
| 205290_s_at | 650 | 18 | BMP2 | bone morphogenetic protein
2 |
4.5 | 0.000021 | 3.1 | 5.3 |
| 205289_at | 650 | 19 | BMP2 | bone morphogenetic protein
2 |
3.7 | 0.000046 | 3.1 | 5 |
| 205476_at | 6364 | 5 | CCL20 | chemokine (C-C motif) ligand
20 |
4.9 | 0.000097 | 2.1 | 4.4 |
| 205114_s_at | 6348 | 84 | CCL3 | chemokine (C-C motif) ligand
3 |
2.2 | 0.0054 | 8.8 | 10 |
| 204103_at | 6351 | 79 | CCL4 | chemokine (C-C motif) ligand
4 |
2 | 0.016 | 8.2 | 9.2 |
| 205099_s_at | 1230 | 62 | CCR1 | chemokine (C-C motif) receptor 1 | −1.6 | 0.01 | 6.7 | 6 |
| 206777_s_at | 1415 | 6 | CRYBB2 | crystallin, beta B2 | 2.4 | 0.000064 | 2.2 | 3.5 |
| 207442_at | 1440 | 2 | CSF3 | colony stimulating factor 3 (granulocyte) | 3.0 | 0.0018 | 1.8 | 3.4 |
| 204470_at | 2919 | 66 | CXCL1 | chemokine (C-X-C motif) ligand 1 (melanoma growth stimulating activity, alpha) | 5.6 | 0.000092 | 7 | 9.5 |
| 209774_x_at | 2920 | 53 | CXCL2 | chemokine (C-X-C motif) ligand 2 | 6.4 | 4.4E-06 | 6.1 | 8.8 |
| 207850_at | 2921 | 8 | CXCL3 | chemokine (C-X-C motif) ligand 3 | 6.4 | 0.000029 | 2.3 | 5 |
| 214974_x_at | 6374 | 26 | CXCL5 | chemokine (C-X-C motif) ligand 5 | 5.2 | 0.0017 | 3.8 | 6.2 |
| 206336_at | 6372 | 8 | CXCL6 | chemokine (C-X-C motif) ligand 6 (granulocyte chemotactic protein 2) | 2.2 | 0.011 | 2.2 | 3.4 |
| 205767_at | 2069 | 19 | EREG | epiregulin | 2.5 | 0.002 | 3.1 | 4.4 |
| 210992_x_at | 2213 | 32 | FCGR2B | Fc fragment of IgG, low affinity IIb, receptor for (CD32) | 1.4 | 0.014 | 4.2 | 4.7 |
| 205119_s_at | 2357 | 43 | FPR1 | formyl peptide receptor 1 | 2.0 | 0.0057 | 5.1 | 6.1 |
| 210118_s_at | 3552 | 35 | IL1A | interleukin 1, alpha | 2.1 | 0.011 | 4.5 | 5.6 |
| 234066_at | 9173 | 91 | IL1RL1 | interleukin 1 receptor-like 1 | 2.3 | 0.0069 | 9.8 | 11 |
| 242809_at | 9173 | 96 | IL1RL1 | interleukin 1 receptor-like 1 | 2.0 | 0.011 | 11 | 12 |
| 216243_s_at | 3557 | 20 | IL1RN | interleukin 1 receptor | 1.9 | 0.0075 | 3.1 | 4 |
| antagonist | ||||||||
| 212657_s_at | 3557 | 38 | IL1RN | interleukin 1 receptor antagonist | 3.2 | 0.015 | 4.7 | 6.4 |
| 205207_at | 3569 | 44 | IL6 | interleukin 6 (interferon, beta 2) | 5.3 | 0.00015 | 5.2 | 7.6 |
| 211506_s_at | 3576 | 39 | IL8 | interleukin 8 | 18.4 | 0.000012 | 4.9 | 9.1 |
| 202859_x_at | 3576 | 93 | IL8 | interleukin 8 | 4.0 | 0.000072 | 10 | 12 |
| 208581_x_at | 4501 | 99 | MT1X | metallothionein 1X | 2.0 | 0.014 | 12 | 13 |
| 209239_at | 4790 | 44 | NFKB1 | nuclear factor of kappa light polypeptide gene enhancer in B-cells 1 (p105) | 1.4 | 0.0096 | 5.2 | 5.7 |
| 201502_s_at | 4792 | 95 | NFKBIA | nuclear factor of kappa light polypeptide gene enhancer in B-cells inhibitor, alpha | 2.0 | 0.0014 | 11 | 12 |
| 201192_s_at | 5306 | 58 | PITPN | phosphotidylinositol transfer protein | 1.4 | 0.013 | 6.4 | 6.9 |
| 211924_s_at | 5329 | 49 | PLAUR | plasminogen activator, urokinase receptor | 1.7 | 0.017 | 5.7 | 6.5 |
| s206157_at | 5806 | 38 | PTX3 | pentaxin-related gene, rapidly induced by IL-1 beta | 3.0 | 0.0023 | 4.8 | 6.4 |
| 209324_s_at | 6004 | 26 | RGS16 | regulator of G-protein signalling 16 | 1.7 | 0.019 | 3.7 | 4.5 |
| 202833_s_at | 5265 | 15 | SERPINA1 | serine (or cysteine) proteinase inhibitor, clade A (alpha-1 antiproteinase, antitrypsin), member 1 | 2.0 | 0.011 | 2.9 | 3.9 |
| 227697_at | 9021 | 20 | SOCS3 | suppressor of cytokine signaling 3 | 2.1 | 0.0032 | 3.1 | 4.2 |
| 206359_at | 9021 | 83 | SOCS3 | suppressor of cytokine signaling 3 | 2.1 | 0.00029 | 8.6 | 9.7 |
| 216841_s_at | 6648 | 59 | SOD2 | superoxide dismutase 2, mitochondrial | 2.0 | 0.0047 | 6.6 | 7.6 |
| 215223_s_at | 6648 | 74 | SOD2 | superoxide dismutase 2, mitochondrial | 2.6 | 0.00086 | 7.6 | 9 |
| 204924_at | 7097 | 16 | TLR2 | toll-like receptor 2 | 2.1 | 0.0014 | 3 | 4.1 |
| 207196_s_at | 10318 | 63 | TNIP1 | TNFAIP3 interacting protein 1 | 1.7 | 0.001 | 6.8 | 7.6 |
| 212637_s_at | 11059 | 12 | WWP1 | WW domain-containing protein 1 | −1.4 | 0.015 | 2.5 | 2 |
Probe sets either belonged to significantly enriched GO Biological Processes or GO Molecular Activities corresponding to chemokine, cytokine or cytokine binding.
TNL percentile refers to the rank order of the mean TNL expression divided by the number of discriminant probe sets (224) and was expressed as a percentage.
Fold change refers to expression change in TIL relative to TNL.
P values were calculated using a permuted Student’s t-test comparing TIL samples with their TNL counterparts.
Mean values are expressed as log2-transformed arbitrary units.
The TNL chorioamniotic membrane samples show a cluster of four samples that have decreased expression of most genes (referred to as “low expressors”, fuchsia leaves on the top dendrogram, Figure 3B). Adjacent is a cluster with five samples that show decreased expression of genes close to the center of the heat map and generally little change in the remaining genes (“average expressors”, black leaves, Figure 3B). We refer to the specific sub-cluster of genes in the center of the heat map as the central gene cluster and its dendrogram leaves have been colored red for clarity (Figure 3B). Finally, there is a three-sample cluster that shows some genes over-expressed (“high expressors”, red leaves, Figure 3B). It is interesting that this last group of three TNL samples cluster most closely with a set of three TIL samples (Figure 3B). The significance of these TNL sub-classes was verified by analysis of regression coefficients for all pair-wise comparisons as follows: high vs. average (P ≤ 0.022), high vs. low (P ≤ 0.0031), and average vs. low (P ≤ 0.0018).
Similarly, the TIL samples appear to have a unimodal distribution that can be divided into three groups. There are five TIL samples that over-expressed nearly every discriminant gene to a high degree and form a tight sub-cluster which we refer to as “high expressors” (orange leaves, Figure 3B). Moreover, four TIL samples exhibit high over-expression of the central gene cluster and generally show modest or no over-expression of the remaining genes (“average expressors”: blue leaves, Figure 3B). Finally, three TIL samples generally display very little change in gene expression of any genes (“low expressors”: green leaves, Figure 3B). These TIL sub-classes exhibit significant differences in gene expression between all pair-wise comparisons as follows: high vs. average (P ≤ 0.017), high vs. low (P ≤ 0.0084), and average vs. low (P ≤ 0.0073). Thus, hierarchical clustering of the probe sets belonging to statistically enriched and inflammation-related GO Biological Process categories reveals unique features in gene expression patterns.
Acute inflammation is a physiological process with distinct phases which can be initiated by the activation of toll-like receptors (TLR2 and TLR4) which recognize among other patterns, epitopes found on pathogenic bacteria as well as epitopes derived from host products26. TLR2 or TLR4 activation leads to the release of neutrophil-specific chemokines and subsequent neutrophil infiltration into the site of inflammation.27 This neutrophil infiltration phase is followed by a monocyte infiltration phase triggered by the release of monocyte-specific chemokines.27,28 Monocytes differentiate into macrophages and dendritic cells.29
To investigate the gene expression differences within TIL samples and determine the relationship between the different GO Biological Processes, a Venn diagram was constructed and is presented in Figure 3C. With the exception of the GO category of “viral genome replication,” central to all GO Biological Processes are six genes (whose expression increased during labor) that are involved in the specific recruitment of neutrophils (bold-faced, dark blue genes, Figure 3C).30 Moreover, these six genes form the central gene cluster which demonstrates that they are coordinately expressed (Figure 3B). This list of genes included IL8 (CXCL8) and CXCL6 (GCP-2), which function by signaling through the CXCR1 receptor (Table III).31,32 CXCL1 (Groα), CXCL2 (Groβ), CXCL3 (Groγ) and CXCL5 (ENA78) serve to recruit neutrophils by signaling through the CXCR2 receptor (Table III).31,32 Indeed, four of these six genes were among probe sets with the smallest P values that discriminated the TNL and TIL chorioamniotic membrane samples (Table II). Furthermore, with the exception of one IL8 probe set, these six genes changed in expression in a relatively concerted manner such that each gene exhibited an average increase in expression of between 5.0 and 6.5-fold in the TIL samples relative to their TNL counterparts (Table III).
The transition of acute inflammation from a primarily neutrophil-specific infiltration to a predominately monocyte-specific infiltration is thought to be controlled by expression of IL6 and SOCS3.28.29,33,34 Both IL6 and SOCS3 appear coordinately over-expressed in “high” and “average expressor” TIL samples (fourth and fifth gene from the bottom, Figure 3B). These two genes are indicated on the Venn diagram (boldfaced, green symbols, Figure 3C).
Multiple genes involved in monocyte recruitment are also over-expressed in most TIL “high” and “average over-expressors”; they appear near the bottom of the gene-specific dendrogram and are also central to nearly all GO Biological Process categories shown (bold-faced, red genes, Figure 3C). Thus, the monocyte-specific chemokines CCL3 (MIP1α), CCL4 (MIP1β), and CCL20 (MIP3α) exhibit over-expression in a pattern remarkably similar to the neutrophil-specific gene cluster (Figure 3B). The CCR1 receptor, which is specific to CCL3 and CCL4,32 exhibits decreased expression in TIL samples (third gene from the top, Figure 3B). Down regulation of CCR1 has been observed during the differentiation of monocytes into activated and mature dendritic cells in response to CCL3 and CCL4.35 Other receptors involved in monocyte chemotaxis are over-expressed in most TIL samples including the gene for formyl peptide receptor 1 (FPR1) which is found on monocytes and serves as the receptor for chemotactic peptides released by activated neutrophils including cathepsin G36 (Figure 3B, 12th gene from the bottom).
Since acute inflammation can be initiated by TLR2 or TLR4 activation, it is also noteworthy that TLR2 is over-expressed predominantly in the “high expressor” TIL samples (sixth row from the top, Figure 3B). Neutrophil infiltration into sites of inflammation requires that blood-borne neutrophils bind to ICAM1,28 which is also over-expressed 1.6-fold on average in TIL samples (gene 25, Table II). IL1A, which is over-expressed in TIL samples and is central to nearly all GO Biological Process categories presented in Figure 3C, is a generalized activator of inflammation (seventh gene from the top, Figure 3B). Thus, “high” and “average TIL expressors” exhibit over-expression of numerous genes that are known to be involved in several phases of the acute inflammatory process from the initiation phase through the neutrophil- and monocyte-specific infiltration phases.27,28 We refer to these genes as the “acute inflammation gene expression signature” (Figures 3B, 3C).
The “acute inflammation gene expression signature” was not associated with either the interval after membrane rupture or the duration of labor
To determine whether the interval after rupture of membranes or the duration of labor was driving expression of genes in the “acute inflammation gene expression signature” in “high” and “average TIL expressors”, two statistical analyses were carried out. First, a Kruskal-Wallis test demonstrated that there is no association of “expressor” sub-class with either the interval after rupture of membranes (P ≥ 0.36), or the duration of labor (P ≥ 0.67). Second, the analysis of regression coefficients of the “acute inflammation gene expression signature” demonstrated that there was no association with either the interval after rupture of membranes (P ≥ 0.72), or the duration of labor (P ≥ 0.70).
While genes in the “acute inflammation gene expression signature” are frequently over-expressed in the TIL membranes compared to TNL membranes, it is noteworthy that a subset of these genes are already highly expressed in TNL samples. In order to investigate this finding more closely, the discriminant probe-sets were rank ordered by mean TNL expression, and each value was divided by the number of discriminant probe sets (224) and expressed as a percentile. The probe-sets annotated by GO are shown with this percentile, along with the average expression value for the TIL and TNL samples (Table III). Given that the arrays were quantile normalized, we considered that an expression level above the 50th percentile to be high. Using this criterion, there is a high average expression in TNL samples of 3 of 6 neutrophil-specific chemokines (CXCL1, CXCL2 and IL8), 1 of 2 transition genes (SOCS), and 2 of 4 monocyte-specific chemokines (CCL3 and CCL4) (Table III). Thus, while virtually all of the genes involved in neutrophil-and monocyte-specific chemotaxis are over-expressed in the TIL samples relative to their TNL counterparts, half of these genes were already highly expressed in the TNL samples.
Genes associated with acute inflammation had increased expression after spontaneous labor in a new set of chorioamniotic membrane samples
In order to verify and extend the analysis of discriminant gene expression changes occurring during labor, qRT-PCR was used to measure the mRNA levels of eight selected genes in the “acute inflammation gene expression signature” (Table IV). Sufficient RNA was available from the original samples to perform qRT-PCR with 9/12 TIL samples and 9/12 TNL samples. We also validated the results with 25 new chorioamniotic membranes consisting of 12 TNL and 13 TIL samples. Specifically, four representative categories of mRNA were measured based on their respective involvement during specific phases of acute inflammation: 1) TLR2 as a potential initiator of inflammation; 2) Neutrophil-specific chemokines IL8, CXCL1, CXCL2 and CXCL3, because neutrophil recruitment is required during the early phase of acute inflammation;37,38 3) IL6 as a regulator of the transition from a primarily neutrophil-specific infiltration to a predominantly monocyte-specific infiltration;33,39 and 4) CCL20 since the ensuing monocyte-specific infiltration phase is driven by monocyte-specific chemokines.40 In addition PBEF transcript levels were measured to further assess its expression in chorioamniotic membranes during labor 9, 10.
Table IV.
Comparison of GeneChip array data to qRT-PCR results of selected genes in original study samples and replication set
|
Original sample set |
Replication set |
||||||
|---|---|---|---|---|---|---|---|
| Gene symbol | Gene name | Array Fold change* | qRT-PCR Fold change† | P value‡ | Correlation§ | qRT-PCR Fold change|| | P value‡ |
| TLR2 | Toll like receptor 2 | 2.1 | 3.1 | 0.0558 | 0.68 | 3.1 | 0.0194 |
| IL8 | Interleukin 8 | 18.4
4.9 |
10.1 | 0.0011 | 0.92
0.87 |
N/A | N/A |
| CXCL1 | Chemokine (C-X-C motif) ligand 1 | 5.7 | 6.6 | 0.0002 | 0.93 | 2.8 | 0.0140 |
| CXCL2 | Chemokine (C-X-C motif) ligand 2 | 6.5 | 5.9 | 0.0028 | 0.88 | 5.3 | 0.0009 |
| CXCL3 | Chemokine (C-X-C motif) ligand 3 | 6.5 | 7.1 | 0.0003 | 0.87 | 4.0 | 0.0033 |
| IL6 | Interleukin 6 | 4.9 | 10.0 | 0.0017 | 0.92 | 4.6 | 0.0072 |
| CCL20 | Chemokine (C-X-C motif) ligand 20 | 5.3 | 23.4 | 0.0003 | 0.91 | 10.1 | 0.0009 |
| PBEF | Pre-B-cell colony-enhancing factor | 2.1
1.9 |
3.6 | 0.0062 | 0.80
0.78 |
2.3 | 0.0265 |
Fold change represents the average increase in 13 new TIL samples relative to 12 new TNL samples.
Fold change refers to expression change in TIL relative to TNL. There are 2 probe sets for IL8 and PBEF on the GeneChip.
The P values were calculated using a Wilcoxon rank sum test comparing TIL samples with their TNL counterparts.
Correlation indicates the Pearson correlation coefficient between 9 TIL and 9 TNL samples for which both array and qRT-PCR measurements exist (P < 0.0001). Two correlation coefficients appear for IL8 and PBEF because each of these genes is represented by 2 probe sets on the array.
Comparison was between 9 TIL and 9 TNL samples.
Gene expression values measured by qRT-PCR were remarkably consistent with the GeneChip-based expression measurements (Table IV). Indeed, all qRT-PCR-based gene expression measurements were differentially expressed between the TNL and TIL samples using the same statistical threshold applied to the microarray data (P ≤ 0.02) and all had high Pearson correlation coefficients that ranged from a low of 0.68 (TLR2, P ≤ 0.0001; Table IV) to a high of 0.93 (CXCL1, P ≤ 0.0001; Table IV). Furthermore, qRT-PCR-derived fold changes for CXCL1, CXCL2 and CXCL3 varied by less than 15% of the fold change determined by microarray while the remaining genes (IL6, CCL20 and PBEF) yielded noticeably increased fold change using qRT-PCR measurements compared with the microarray measurements.
Next, qRT-PCR was used to assay gene expression with a new replication set of samples consisting of 13 TIL and 12 TNL samples. Gene expression changes measured by qRT-PCR in the replication set continued to exhibit significant differential expression between TIL and TNL samples (Table IV). The expression level of PBEF appeared to follow those of the other genes measured and were consistent with its involvement and expression in parturition9, 10, 41 and the suggestion that this gene may be involved in acute inflammation.42
Taken together, qRT-PCR measurements of gene expression in both the original and the replication set indicated that transcripts involved in multiple, discrete phases of acute inflammation increased in expression in TIL chorioamniotic membrane samples relative to their TNL counterparts.
Gene expression changes in blood of patients in spontaneous labor do not exhibit an inflammatory response
Since genes associated with the inflammatory response show considerable increases in expression in TIL chorioamniotic membranes, we explored whether this response was localized. To this end, transcriptional profiles of blood samples from 12 new TIL patients were compared with 8 new TNL patients. The TIL samples were from patients in active labor (median cervical dilatation 4.0 cm, interquartile range: 3.9 – 4.5 cm). There were 220 and 23 probe sets (from the HG-U133A and HG-U133B arrays, respectively), that were differentially expressed between the groups when using the same statistical criteria applied to the chorioamniotic membranes (data not shown). These 243 discriminant probe sets correspond to 220 unique transcripts in total, as defined by the Gene database.
These discriminant genes were then analyzed for enriched representation of Biological Processes defined by GO annotation. After correcting P values for multiple tests, no GO categories were significantly enriched (P ≤ 0.02). Furthermore, only six of the discriminant genes from the blood analysis were common with the discriminant genes found in the chorioamniotic membrane analysis (USP9X, ASF1A, CXCL1, EDD, PP784, SMARCA2). Of these six genes, only CXCL1 (GRO1) is known to be involved in acute inflammation. Thus, although the TIL chorioamniotic membranes exhibited the “acute inflammation gene expression signature” at the end of labor, no such pattern was observed in the TIL blood samples from similar patients in active labor.
Comment
Examination of a global transcription profile that reflects an acute inflammatory response extend prior gene-by-gene observations of inflammatory proteins.6 Although other studies have shown that inflammatory genes increase in expression in fetal membranes during labor, no study has yet presented sufficient data to clearly demonstrate an orchestrated gene expression signature.9 The analysis presented here demonstrates that multiple transcripts controlling each of the defined steps of acute inflammation increase during labor. Specifically, we observed increases in multiple cytokines and chemokines that are known to orchestrate acute inflammation. It is noteworthy that the “acute inflammation gene expression signature” appears to be coordinately expressed and is not associated with either the interval after rupture, or the duration of labor.
Consistent with previous analyses of chorioamniotic membranes measuring one, or several genes at a time, IL8,9, 25,43,44 IL6, 45 PBEF,9,10 TLR246 and SOD225 were over-expressed in TIL samples compared to TNL samples (Table II). Indeed, the expression levels of these mRNAs, or their corresponding proteins, have previously been found to be elevated in samples such as chorioamniotic membranes, myometrium, cervix, or amniotic fluid from TIL patients.
Although numerous stimuli can initiate an acute inflammatory response, one possible sequence may begin with the activation of pattern recognition receptors including TLR2 and TLR4, which are found on the surface of epithelial cells and resident macrophages. TLR2 activation can occur by binding to products from yeast, mycoplasmas and gram-positive bacteria.47 TLR4 recognizes bacterial lipopolysaccharide and can also bind host-derived products that are degraded during acute inflammation.26 Activated TLR2 and TLR4 cause a release of chemokines that result in neutrophil recruitment and activation.27 Neutrophils recruited by this mechanism bind to ICAM1 receptors and migrate to the site of chemokine release.28 It is, therefore, striking that the mRNA levels for both TLR2 and ICAM1 increased 1.6-fold and 2.1-fold, respectively, in the TIL chorioamniotic membrane samples relative to their TNL counterparts (Table II, Table III). The subsequent phase of the acute inflammatory response involves the recruitment of monocytes that will go on to differentiate into macrophages and dendritic cells at the site of inflammation.29 This phase of the inflammatory response is preceded by the production of chemokines responsible for monocyte-specific recruitment and differentiation.27,28 It is, therefore, noteworthy that the mRNA levels of monocyte-specific chemokines increased in the TIL samples (discussed below). The transition to the monocyte-specific phase appears to be controlled by IL6 and SOCS3,28,39, 48, 49 both of which were increased in the TIL samples relative to TNL samples (Tables II and III).
Multiple lines of evidence are consistent with the “acute inflammation gene expression signature” eliciting the recruitment and activation of neutrophils in the context of an acute inflammatory response. First, genes specifically implicated in neutrophil recruitment and activation had statistically the most significant changes in their expression (Tables II and III). It is remarkable that IL8, CXCL1, CXCL2, and CXCL3 were among the 10 most discriminant probe sets (Table III) and are coordinately expressed (Figure 3B). Furthermore, the mRNA levels of all of these genes increased in the TIL samples in a similar manner from 4-fold to 6.5-fold relative to the TNL samples (Tables II and III). Finally, hierarchical clustering indicated that the same four genes exhibited similar expression patterns across multiple samples (Figure 2, top five genes). Interestingly, CXCL5, another neutrophil-specific chemokine was also in the same sub-cluster, even though its P value was not as significant (Figure 2, eighth gene from the top, Table III).50 Taken together, the “acute inflammation gene expression signature” is consistent with neutrophil recruitment and activation seen during a classical inflammatory response.
Changes in the “acute inflammation gene expression signature” were also consistent with monocyte recruitment and differentiation. Specifically, a set of genes that was central to all GO Biological Process categories depicted in Figure 3C (with the exception of “viral genome replication”) were four genes whose expression increased during spontaneous labor and which are known to be involved in the chemotaxis and differentiation of monocytes. These genes are FPR1, CCL3 (MIP1α), CCL4 (MIP1β) and CCL20 (MIP3α) (Figure 3C, Table III).38 Both CCL3 and CCL4 signal through the CCR1 receptor32 that had a decreased expression in TIL samples (Table III). Decreased expression of CCR1 occurs when monocytes differentiate into activated and mature dendritic cells.35
In contrast to the gene expression patterns in TIL chorioamniotic membranes at the end of labor, blood samples of TIL patients in active labor did not exhibit an increase in the “acute inflammation gene expression signature”. Taken together, our results indicate that differentially increased expression of the inflammatory response signature is independent of the duration of labor, as well as the interval after rupture, and does not manifest systemically during the early stages of the active phase of labor.
The fact that the “acute inflammation gene expression signature” is not associated with either the interval after rupture of membranes or the duration of labor, suggests that this gene expression signature is not a simple consequence of these two events. The results presented here can be interpreted in the context of two, non-exclusive models51–53. The first has been previously proposed as the hypo- or hyper-immune responder model. An alternative model proposes that genes associated with acute inflammation may function in tissue homeostasis.
The principle line of evidence consistent with the hypo- or hyper-immune responder model derives from hierarchical clustering of the 42 probe sets belonging to enriched GO categories. This hierarchical clustering suggests the existence of TIL and TNL sub-classes. While the distribution of gene expression appeared to be unimodal, it was simple to discern TIL samples that were either “high”, “average”, or “low expressors”. We suggest that the TIL “low expressor” and “high expressor” samples may correspond to genetically predetermined hypo- and hyper-immune responders, respectively.51–53 Previous studies have measured the expression of the cytokines IL1B, IL6, and IL8 in the cervical fluid and discovered that patients with low concentrations of 2 of 3 of these cytokines were more likely to subsequently develop clinical chorioamnionitis.53 We consider that the five TIL samples showing high expression are more likely to correspond to hyper-immune responders (orange leaves of top dendrogram, Figure 3B).51, 52 Conversely, the three TIL low expressors are more likely to correspond to hypo-immune responders (green leaves, Figure 3B).52, 53 Since three TNL samples clustered with the three TIL low expressors, it is also possible that these three TNL samples correspond to immune hyper-responders that have not yet been subject to the stimulus of labor (red leaves, Figure 3B). Our results demonstrate clearly that labor increases expression of genes involved in acute inflammation. Given that the “acute inflammation gene expression signature” is over-expressed in the absence of detectable inflammation, the fetal membranes may be primed for a massive inflammation reaction, in the case of a triggering event.52 Although a previous study analyzed cervical fluid and its effects on chorioamnionitis53, our study focuses exclusively on normal chorioamniotic membranes that have undergone labor or not. Nevertheless, our results demonstrate that sub-classes of TIL samples are evident and can be differentiated on the level of expression of genes associated with acute inflammation.
The second model is predicated on the expression levels of inflammatory genes in TNL samples. Although TIL patient samples demonstrated over-expression of the “acute inflammation gene expression signature”, the TNL samples did show high levels of a considerable fraction of these inflammatory genes. Thus, about half of the genes associated with each of the three principle phases of acute inflammation exhibited mean expression levels in the TNL samples that were at least at the 50th percentile or higher in the discriminant probe sets. Specifically, 3 of 6 neutrophil-specific chemokines, 1 of 2 transition genes and 2 of 4 monocyte-specific chemokines were expressed at high levels in TNL samples. Given that all of the chorioamniotic membrane samples were selected based on their lack of inflammation (as defined by histological examination of the extra-placental membranes) this result implies that genes involved in acute inflammation may serve functions not traditionally associated with acute inflammation. In this context, TLR2 signaling has been shown to be necessary for normal epithelial homeostasis in the mouse intestine.54 It is, therefore, conceivable that TLR2 and other genes associated with acute inflammation may be involved in maintaining tissue homeostasis of the chorioamniotic membranes.
This study has investigated global transcriptional changes during labor in chorioamniotic membranes. Nevertheless, multiple lines of evidence are consistent with the translation of transcripts from the inflammatory response signature into protein products. First, we observed gene expression changes that have been reported previously to be temporally linked, including the down-regulation of CCR1 mRNA expression in response to the binding of CCR1 receptor protein by its ligands CCL3 and CCL4.35 Second, studies measuring protein in chorioamniotic membranes are consistent with the results presented here and have demonstrated over-expression of IL8,9,25,43,44 IL6,45 TLR246 and SOD225 protein in TIL samples compared to their TNL counterparts. Finally, virtually all previous studies measuring amniotic fluid protein levels of genes in the inflammatory response signature are consistent with our results including the protein levels of IL1A, IL1B, IL6, IL8 and CCL3 (MIP1α) (See Table V for references and details). Since protein in amniotic fluid is most likely derived from the fetus and the fetal membranes, the level probably reflects synthesis and secretion by the membranes and fetal neutrophils.
Table V.
Summary of protein determinations of cytokines in amniotic fluid samples.
| Study | Protein | Gene Symbol | Number of TIL Subjects | CentralityATIL (ng/mL) | Number of TNL Subjects | CentralityATNL (ng/mL) | PValueB, C |
|---|---|---|---|---|---|---|---|
| Keelan, J.A. 200450 | ENA78 | CXCL5 | 16 | 1.4 | 39 | 1.7 | 0.0010D |
| Cohen, J. 199655 | GROα | CXCL1 | 20 | 2.1 | 20 | 1.9 | N.S. |
| Opsjln, S.L. 199356 | IL1 | IL1 | 25 | 0.680 | 24 | 0.188 | 0.0001 |
| Romero, R. 198957 | IL1α | IL1A | 21 | Not Determined | 16 | Not Determined | 0.0010 |
| Romero, R. 199058 | IL1ß | IL1B | 41 | Not Determined | 39 | Not Determined | 0.002 |
| Romero, R. 199259 | IL1ß | IL1B | 30 | 0.0515 | 19 | 0 | 0.0017 |
| Cox, S.M. 199760 | IL6 | IL6 | 175 | 11.5* | 120 | 0.446* | 0.0010 |
| Fukuda, H. 200261 | IL6 | IL6 | 7 | 1.97 | 11 | 0.119 | 0.0010 |
| Hebisch, G. 200162 | IL6 | IL6 | 7 | 12.561 | 36 | 0.269 | 0.001 |
| Olah, K.S. 199663 | IL6 | IL6 | 10 | 1.5 | 19 | 0.01 | 0.0080 |
| Opsjln, S.L. 199356 | IL6 | IL6 | 25 | 4.8 | 24 | 0.399 | 0.0001 |
| Romero, R., 199058 | IL6 | IL6 | 40 | 19.5 | 31 | 13.0 | 0.0500 |
| Santhanam, U. 199164 | IL6 | IL6 | 40 | 74 | 33 | 15 | 0.05 |
| Hebish, G. 200162 | IL8 | IL8 | 7 | 9.553 | 33 | 1.556 | 0.001 |
| Laham, N. 199365 | IL8 | IL8 | 6 | 3.896* | 12 | 0.969* | 0.0030 |
| Olah, K.S. 199663 | IL8 | IL8 | 10 | Not Indicated | 19 | Not Indicated | N.S. |
| Romero, R. 199166 | IL8 | IL8 | 49 | 2.68 | 38 | 0.000 | 0.0500 |
| Dudley, D.J. 199667 | MIP1α | CCL3 | 36 | Not Indicated | 29 | Not Indicated | 0.0010 |
| Romero, R. 199468 | MIP1α | CCL3 | 20 | 0.017 | 19 | 0.000 | 0.0010 |
Centrality describes median except for * which are mean.
All but one study (Cox, et. al.) used non-parametric statistical tests.
N.S. indicates expression change was reported to be not significant.
Direction of expression change was opposite to that reported in this paper.
The previous protein studies were performed for one or at most a few gene products at a time. Although they hinted at the role of inflammation during parturition, the transcriptional profile established here provides, for the first time, the full extent of gene expression associated with acute inflammation during parturition in the chorioamniotic membrane. Thus, while transcriptional activity does not necessarily reflect translational activity, for many of the genes we have investigated in the “acute inflammation gene expression signature”, we find that increased transcription is consistent with multiple studies demonstrating increased protein levels.
In conclusion, the results presented here suggest that labor induces gene expression changes in chorioamniotic membranes consistent with a localized acute inflammatory response, despite the absence of histological evidence of inflammation. Further research is required to determine which of the two models we propose explains the clinical and biochemical findings.
Acknowledgments
We thank Ms. Magdalena Skunca, Ms. Irene Broner, Ms. Carrie Couyoumjian, Ms. Tamara Briazova and Mr. Guy M. Lenk for expert technical assistance in RNA isolations and Dr. Susan Land and Mr. Daniel Lott at the Applied Genomics Technology Center of Wayne State University for performing the microarray hybridizations and scanning with the RNA samples isolated from blood. We gratefully acknowledge the expert secretarial assistance of Ms. Krista Mitchell. We thank Dr. David Womble and Mr. Daniel Liu at the Bioinformatics Facility of the Center for Molecular Medicine and Genetics for configuring the appropriate software and giving us access to the “BlueGene” Linux cluster. We thank Drs. Kyle Furge and Wendell Jones for critical comments on the manuscript.
Footnotes
Condensation
Genome-wide transcriptome analysis of chorioamniotic membranes at term after spontaneous labor reveals a localized acute inflammation gene expression signature in the absence of histologic inflammation.
This research was supported by the Intramural Research Program of the National Institute of Child Health and Human Development, NIH, DHHS.
References
- 1.Romero R, Mazor M, Munoz H, Gomez R, Galasso M, Sherer DM. The preterm labor syndrome. Ann N Y Acad Sci. 1994;734:414–29. doi: 10.1111/j.1749-6632.1994.tb21771.x. [DOI] [PubMed] [Google Scholar]
- 2.Skinner SJ, Liggins GC. Glycosaminoglycans and collagen in human amnion from pregnancies with and without premature rupture of the membranes. J Dev Physiol. 1981;3:111–21. [PubMed] [Google Scholar]
- 3.McLaren J, Malak TM, Bell SC. Structural characteristics of term human fetal membranes prior to labour: identification of an area of altered morphology overlying the cervix. Hum Reprod. 1999;14:237–41. doi: 10.1093/humrep/14.1.237. [DOI] [PubMed] [Google Scholar]
- 4.Parry S, Strauss JF., 3rd Premature rupture of the fetal membranes. N Engl J Med. 1998;338:663–70. doi: 10.1056/NEJM199803053381006. [DOI] [PubMed] [Google Scholar]
- 5.Liggins G. Cervical ripening as an inflammatory reaction. In: Ellwood DA, editor. The Cervix in Pregnancy and Labour: Clinical and Biochemical Investigations. Edinburgh: Churchill Livingstone; 1981. [Google Scholar]
- 6.Keelan JA, Blumenstein M, Helliwell RJ, Sato TA, Marvin KW, Mitchell MD. Cytokines, prostaglandins and parturition--a review. Placenta. 2003;24 (Suppl A):S33–46. doi: 10.1053/plac.2002.0948. [DOI] [PubMed] [Google Scholar]
- 7.Romero R, Kuivaniemi H, Tromp G. Functional genomics and proteomics in term and preterm parturition. J Clin Endocrinol Metab. 2002;87:2431–4. doi: 10.1210/jcem.87.6.8689. [DOI] [PubMed] [Google Scholar]
- 8.Tromp G, Kuivaniemi H, Romero R, et al. Genome-wide expression profiling of fetal membranes reveals a deficient expression of proteinase inhibitor 3 in premature rupture of membranes. Am J Obstet Gynecol. 2004;191:1331–8. doi: 10.1016/j.ajog.2004.07.010. [DOI] [PubMed] [Google Scholar]
- 9.Marvin KW, Keelan JA, Eykholt RL, Sato TA, Mitchell MD. Use of cDNA arrays to generate differential expression profiles for inflammatory genes in human gestational membranes delivered at term and preterm. Mol Hum Reprod. 2002;8:399–408. doi: 10.1093/molehr/8.4.399. [DOI] [PubMed] [Google Scholar]
- 10.Ognjanovic S, Tashima LS, Bryant-Greenwood GD. The effects of pre-B-cell colony-enhancing factor on the human fetal membranes by microarray analysis. Am J Obstet Gynecol. 2003;189:1187–95. doi: 10.1067/s0002-9378(03)00591-x. [DOI] [PubMed] [Google Scholar]
- 11.Marvin KW, Keelan JA, Eykholt RL, Sato TA, Mitchell MD. Expression of angiogenic and neurotrophic factors in the human amnion and choriodecidua. Am J Obstet Gynecol. 2002;187:728–34. [PubMed] [Google Scholar]
- 12.Pacora P, Chaiworapongsa T, Maymon E, et al. Funisitis and chorionic vasculitis: the histological counterpart of the fetal inflammatory response syndrome. J Matern Fetal Neonatal Med. 2002;11:18–25. doi: 10.1080/jmf.11.1.18.25. [DOI] [PubMed] [Google Scholar]
- 13.Gentleman RC, Carey VJ, Bates DM, et al. Bioconductor: open software development for ocmputational biology and bioinformatics. Genome Biology. 2004;5:R80. doi: 10.1186/gb-2004-5-10-r80. [DOI] [PMC free article] [PubMed] [Google Scholar]
- 14.Gautier L, Cope L, Bolstad BM, Irizarry RA. affy--analysis of Affymetrix GeneChip data at the probe level. Bioinformatics. 2004;20:307–15. doi: 10.1093/bioinformatics/btg405. [DOI] [PubMed] [Google Scholar]
- 15.Dudoit S, Gentleman RC, Quackenbush J. Open source software for the analysis of microarray data. Biotechniques. 2003;(Suppl):45–51. [PubMed] [Google Scholar]
- 16.Wu Z, Irizarray R. Stochastic models inspired by hybridization theory for short oligonucleotide arrays. Annual Conference on Research in Computational Molecular Biology; 2004; [DOI] [PubMed] [Google Scholar]
- 17.Benjamini Y, Hochberg Y. Controlling the false discovery rate: A practical and powerful approach to multiple testing. J R Stat Soc Ser B. 1995;57:289–300. [Google Scholar]
- 18.Dudoit SSJP, Boldrick JC. Multiple hypothesis testing in microarray experiments Statistical. Science. 2003;18:71–103. [Google Scholar]
- 19.Yu H. Rmpi: parallel statistical computing in R. R News. 2002;2:10–14. [Google Scholar]
- 20.De Hoon MJ, Imoto S, Nolan J, Miyano S. Open source clustering software. Bioinformatics. 2004;20:1453–1454. doi: 10.1093/bioinformatics/bth078. [DOI] [PubMed] [Google Scholar]
- 21.Zhang B, Schmoyer D, Kirov S, Snoddy J. GOTree Machine (GOTM): a web-based platform for interpreting sets of interesting genes using Gene Ontology hierarchies. BMC Bioinformatics. 2004;5:16. doi: 10.1186/1471-2105-5-16. [DOI] [PMC free article] [PubMed] [Google Scholar]
- 22.Ashburner M, Ball CA, Blake JA, et al. Gene ontology: tool for the unification of biology. The Gene Ontology Consortium Nat Genet. 2000;25:25–9. doi: 10.1038/75556. [DOI] [PMC free article] [PubMed] [Google Scholar]
- 23.Sidak Z. Rectangular Confidence Regions for the Means of Multivariate Normal Distributions. Journal of the American Statistical Association. 1967;62:626–633. [Google Scholar]
- 24.Goeman JJ, van de Geer SA, de Kort F, van Houwelingen HC. A global test for groups of genes: testing association with a clinical outcome. Bioinformatics. 2004;20:93–9. doi: 10.1093/bioinformatics/btg382. [DOI] [PubMed] [Google Scholar]
- 25.Chan EC, Fraser S, Yin S, et al. Human myometrial genes are differentially expressed in labor: a suppression subtractive hybridization study. J Clin Endocrinol Metab. 2002;87:2435–41. doi: 10.1210/jcem.87.6.8439. [DOI] [PubMed] [Google Scholar]
- 26.Smiley ST, King JA, Hancock WW. Fibrinogen stimulates macrophage chemokine secretion through toll-like receptor 4. J Immunol. 2001;167:2887–94. doi: 10.4049/jimmunol.167.5.2887. [DOI] [PubMed] [Google Scholar]
- 27.Luster AD. The role of chemokines in linking innate and adaptive immunity. Curr Opin Immunol. 2002;14:129–35. doi: 10.1016/s0952-7915(01)00308-9. [DOI] [PubMed] [Google Scholar]
- 28.Kaplanski G, Marin V, Montero-Julian F, Mantovani A, Farnarier C. IL-6: a regulator of the transition from neutrophil to monocyte recruitment during inflammation. Trends Immunol. 2003;24:25–9. doi: 10.1016/s1471-4906(02)00013-3. [DOI] [PubMed] [Google Scholar]
- 29.Palucka KA, Taquet N, Sanchez-Chapuis F, Gluckman JC. Dendritic cells as the terminal stage of monocyte differentiation. J Immunol. 1998;160:4587–95. [PubMed] [Google Scholar]
- 30.Goodman RB, Pugin J, Lee JS, Matthay MA. Cytokine-mediated inflammation in acute lung injury. Cytokine Growth Factor Rev. 2003;14:523–35. doi: 10.1016/s1359-6101(03)00059-5. [DOI] [PubMed] [Google Scholar]
- 31.Proudfoot AE. Chemokine receptors: multifaceted therapeutic targets. Nat Rev Immunol. 2002;2:106–15. doi: 10.1038/nri722. [DOI] [PMC free article] [PubMed] [Google Scholar]
- 32.Janeway CAT, Walport P, Shlomchik MM. Immunobiology: the immune system in health and disease. New York: Garland Publishing; 2001. [Google Scholar]
- 33.Hurst SM, Wilkinson TS, McLoughlin RM, et al. Il-6 and its soluble receptor orchestrate a temporal switch in the pattern of leukocyte recruitment seen during acute inflammation. Immunity. 2001;14:705–14. doi: 10.1016/s1074-7613(01)00151-0. [DOI] [PubMed] [Google Scholar]
- 34.Alexander WS, Hilton DJ. The role of suppressors of cytokine signaling (SOCS) proteins in regulation of the immune response. Annu Rev Immunol. 2004;22:503–29. doi: 10.1146/annurev.immunol.22.091003.090312. [DOI] [PubMed] [Google Scholar]
- 35.Sozzani S, Allavena P, D'Amico G, et al. Differential regulation of chemokine receptors during dendritic cell maturation: a model for their trafficking properties. J Immunol. 1998;161:1083–6. [PubMed] [Google Scholar]
- 26.Sun R, Iribarren P, Zhang N, et al. Identification of neutrophil granule protein cathepsin G as a novel chemotactic agonist for the G protein-coupled formyl peptide receptor. J Immunol. 2004;173:428–36. doi: 10.4049/jimmunol.173.1.428. [DOI] [PubMed] [Google Scholar]
- 37.McLoughlin RM, Hurst SM, Nowell MA, et al. Differential regulation of neutrophil-activating chemokines by IL-6 and its soluble receptor isoforms. J Immunol. 2004;172:5676–83. doi: 10.4049/jimmunol.172.9.5676. [DOI] [PubMed] [Google Scholar]
- 38.Garcia-Ramallo E, Marques T, Prats N, Beleta J, Kunkel SL, Godessart N. Resident cell chemokine expression serves as the major mechanism for leukocyte recruitment during local inflammation. J Immunol. 2002;169:6467–73. doi: 10.4049/jimmunol.169.11.6467. [DOI] [PubMed] [Google Scholar]
- 39.Croker BA, Krebs DL, Zhang JG, et al. SOCS3 negatively regulates IL-6 signaling in vivo. Nat Immunol. 2003;4:540–5. doi: 10.1038/ni931. [DOI] [PubMed] [Google Scholar]
- 40.Schutyser E, Struyf S, Van Damme J. The CC chemokine CCL20 and its receptor CCR6. Cytokine Growth Factor Rev. 2003;14:409–26. doi: 10.1016/s1359-6101(03)00049-2. [DOI] [PubMed] [Google Scholar]
- 41.Ognjanovic S, Bryant-Greenwood GD. Pre-B-cell colony-enhancing factor, a novel cytokine of human fetal membranes. Am J Obstet Gynecol. 2002;187:1051–8. doi: 10.1067/mob.2002.126295. [DOI] [PubMed] [Google Scholar]
- 42.Jia SH, Li Y, Parodo J, et al. Pre-B cell colony-enhancing factor inhibits neutrophil apoptosis in experimental inflammation and clinical sepsis. J Clin Invest. 2004;113:1318–27. doi: 10.1172/JCI19930. [DOI] [PMC free article] [PubMed] [Google Scholar]
- 43.Keelan JA, Marvin KW, Sato TA, Coleman M, McCowan LM, Mitchell MD. Cytokine abundance in placental tissues: evidence of inflammatory activation in gestational membranes with term and preterm parturition. Am J Obstet Gynecol. 1999;181:1530–6. doi: 10.1016/s0002-9378(99)70400-x. [DOI] [PubMed] [Google Scholar]
- 44.Elliott CL, Loudon JA, Brown N, Slater DM, Bennett PR, Sullivan MH. IL-1beta and IL-8 in human fetal membranes: changes with gestational age, labor, and culture conditions. Am J Reprod Immunol. 2001;46:260–7. doi: 10.1034/j.1600-0897.2001.d01-11.x. [DOI] [PubMed] [Google Scholar]
- 45.Maul H, Nagel S, Welsch G, Schafer A, Winkler M, Rath W. Messenger ribonucleic acid levels of interleukin-1 beta, interleukin-6 and interleukin-8 in the lower uterine segment increased significantly at final cervical dilatation during term parturition, while those of tumor necrosis factor alpha remained unchanged. Eur J Obstet Gynecol Reprod Biol. 2002;102:143–7. doi: 10.1016/s0301-2115(01)00606-6. [DOI] [PubMed] [Google Scholar]
- 46.Kim YM, Romero R, Chaiworapongsa T, et al. Toll-like receptor-2 and -4 in the chorioamniotic membranes in spontaneous labor at term and in preterm parturition that are associated with chorioamnionitis. Am J Obstet Gynecol. 2004;191:1346–55. doi: 10.1016/j.ajog.2004.07.009. [DOI] [PubMed] [Google Scholar]
- 47.Akira S, Takeda K, Kaisho T. Toll-like receptors: critical proteins linking innate and acquired immunity. Nat Immunol. 2001;2:675–80. doi: 10.1038/90609. [DOI] [PubMed] [Google Scholar]
- 48.Yasukawa H, Ohishi M, Mori H, et al. IL-6 induces an anti-inflammatory response in the absence of SOCS3 in macrophages. Nat Immunol. 2003;4:551–6. doi: 10.1038/ni938. [DOI] [PubMed] [Google Scholar]
- 49.Lang R, Pauleau AL, Parganas E, et al. SOCS3 regulates the plasticity of gp130 signaling. Nat Immunol. 2003;4:546–50. doi: 10.1038/ni932. [DOI] [PubMed] [Google Scholar]
- 50.Keelan JA, Yang J, Romero RJ, et al. Epithelial cell-derived neutrophil-activating peptide-78 is present in fetal membranes and amniotic fluid at increased concentrations with intra-amniotic infection and preterm delivery. Biol Reprod. 2004;70:253–9. doi: 10.1095/biolreprod.103.016204. [DOI] [PubMed] [Google Scholar]
- 51.Goepfert AR, Goldenberg RL, Andrews WW, et al. The Preterm Prediction Study: association between cervical interleukin 6 concentration and spontaneous preterm birth. National Institute of Child Health and Human Development Maternal-Fetal Medicine Units Network. Am J Obstet Gynecol. 2001;184:483–8. doi: 10.1067/mob.2001.109653. [DOI] [PubMed] [Google Scholar]
- 52.Romero R, Chaiworapongsa T, Kuivaniemi H, Tromp G. Bacterial vaginosis, the inflammatory response and the risk of preterm birth: a role for genetic epidemiology in the prevention of preterm birth. Am J Obstet Gynecol. 2004;190:1509–19. doi: 10.1016/j.ajog.2004.01.002. [DOI] [PubMed] [Google Scholar]
- 53.Simhan HN, Caritis SN, Krohn MA, Martinez de Tejada B, Landers DV, Hillier SL. Decreased cervical proinflammatory cytokines permit subsequent upper genital tract infection during pregnancy. Am J Obstet Gynecol. 2003;189:560–7. doi: 10.1067/s0002-9378(03)00518-0. [DOI] [PubMed] [Google Scholar]
- 54.Rakoff-Nahoum S, Paglino J, Eslami-Varzaneh F, Edberg S, Medzhitov R. Recognition of commensal microflora by toll-like receptors is required for intestinal homeostasis. Cell. 2004;118:229–41. doi: 10.1016/j.cell.2004.07.002. [DOI] [PubMed] [Google Scholar]
- 55.Cohen J, Ghezzi F, Romero R, et al. GRO alpha in the fetomaternal and amniotic fluid compartments during pregnancy and parturition. Am J Reprod Immunol. 1996;35:23–9. doi: 10.1111/j.1600-0897.1996.tb00004.x. [DOI] [PubMed] [Google Scholar]
- 56.Opsjln SL, Wathen NC, Tingulstad S, et al. Tumor necrosis factor, interleukin-1, and interleukin-6 in normal human pregnancy. Am J Obstet Gynecol. 1993;169:397–404. doi: 10.1016/0002-9378(93)90096-2. [DOI] [PubMed] [Google Scholar]
- 57.Romero R, Brody DT, Oyarzun E, et al. Infection and labor. III. Interleukin-1: a signal for the onset of parturition. Am J Obstet Gynecol. 1989;160:1117–23. doi: 10.1016/0002-9378(89)90172-5. [DOI] [PubMed] [Google Scholar]
- 58.Romero R, Avila C, Santhanam U, Sehgal PB. Amniotic fluid interleukin 6 in preterm labor. Association with infection J Clin Invest. 1990;85:1392–400. doi: 10.1172/JCI114583. [DOI] [PMC free article] [PubMed] [Google Scholar]
- 59.Romero R, Mazor M, Brandt F, et al. Interleukin-1 alpha and interleukin-1 beta in preterm and term human parturition. Am J Reprod Immunol. 1992;27:117–23. doi: 10.1111/j.1600-0897.1992.tb00737.x. [DOI] [PubMed] [Google Scholar]
- 60.Cox SM, Casey ML, MacDonald PC. Accumulation of interleukin-1beta and interleukin-6 in amniotic fluid: a sequela of labour at term and preterm. Hum Reprod Update. 1997;3:517–27. doi: 10.1093/humupd/3.5.517. [DOI] [PubMed] [Google Scholar]
- 61.Fukuda H, Masuzaki H, Ishimaru T. Interleukin-6 and interleukin-1 receptor antagonist in amniotic fluid and cord blood in patients with pre-term, premature rupture of the membranes. Int J Gynaecol Obstet. 2002;77:123–9. doi: 10.1016/s0020-7292(02)00016-4. [DOI] [PubMed] [Google Scholar]
- 62.Hebisch G, Grauaug AA, Neumaier-Wagner PM, Stallmach T, Huch A, Huch R. The relationship between cervical dilatation, interleukin-6 and interleukin-8 during term labor. Acta Obstet Gynecol Scand. 2001;80:840–8. doi: 10.1034/j.1600-0412.2001.080009840.x. [DOI] [PubMed] [Google Scholar]
- 63.Olah KS, Vince GS, Neilson JP, Deniz G, Johnson PM. Interleukin-6, interferon-gamma, interleukin-8, and granulocyte-macrophage colony stimulating factor levels in human amniotic fluid at term. J Reprod Immunol. 1996;32:89–98. doi: 10.1016/s0165-0378(96)00990-4. [DOI] [PubMed] [Google Scholar]
- 64.Santhanam U, Avila C, Romero R, et al. Cytokines in normal and abnormal parturition: elevated amniotic fluid interleukin-6 levels in women with premature rupture of membranes associated with intrauterine infection. Cytokine. 1991;3:155–63. doi: 10.1016/1043-4666(91)90037-e. [DOI] [PubMed] [Google Scholar]
- 65.Laham N, Rice GE, Bishop GJ, Ransome C, Brennecke SP. Interleukin 8 concentrations in amniotic fluid and peripheral venous plasma during human pregnancy and parturition. Acta Endocrinol (Copenh) 1993;129:220–4. doi: 10.1530/acta.0.1290220. [DOI] [PubMed] [Google Scholar]
- 66.Romero R, Ceska M, Avila C, Mazor M, Behnke E, Lindley I. Neutrophil attractant/activating peptide-1/interleukin-8 in term and preterm parturition. Am J Obstet Gynecol. 1991;165:813–20. doi: 10.1016/0002-9378(91)90422-n. [DOI] [PubMed] [Google Scholar]
- 67.Dudley DJ, Hunter C, Mitchell MD, Varner MW. Elevations of amniotic fluid macrophage inflammatory protein-1 alpha concentrations in women during term and preterm labor. Obstet Gynecol. 1996;87:94–8. doi: 10.1016/0029-7844(95)00366-5. [DOI] [PubMed] [Google Scholar]
- 68.Romero R, Gomez R, Galasso M, et al. Macrophage inflammatory protein-1 alpha in term and preterm parturition: effect of microbial invasion of the amniotic cavity. Am J Reprod Immunol. 1994;32:108–13. doi: 10.1111/j.1600-0897.1994.tb01101.x. [DOI] [PubMed] [Google Scholar]