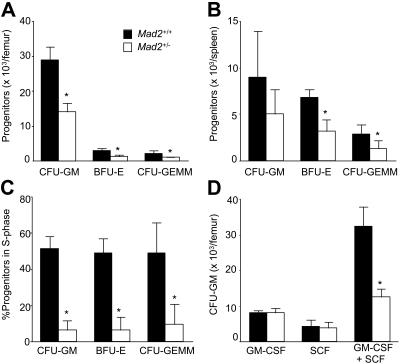
Figure 2.
Comparative analysis of hematopoietic progenitor cells in bone marrow and spleen of Mad2+/− and Mad2+/+ mice. Absolute numbers of immature hematopoietic progenitor cells (responsive to stimulation by multiple cytokines (5% [vol/vol] PWMSCM, 50 ng/mL rmuSCF, and 1 U/mL rhuEpo in vitro) in bone marrow (A) and spleen (B), and the percentage of BM progenitor cells in S phase (C). Absolute numbers of immature (responsive to 50 ng/mL rmuSCF and 10 ng/mL rmuGM-CSF) and mature (responsive to stimulation by 50 ng/mL rmuSCF or 10 ng/mL rmuGM-CSF) CFU-GM in BM (D). ■ and □ indicate Mad2+/+ and Mad2+/−, respectively. Data represent the average of a total of 5 mice of each phenotype from 2 independent experiments. Error bars represent 1 SD. *P < .05 (+/− vs +/+).

