Abstract
Over the past 15 years advances in the porcine genetic linkage map and discovery of useful candidate genes have led to valuable gene and trait information being discovered. Early use of exotic breed crosses and now commercial breed crosses for quantitative trait loci (QTL) scans and candidate gene analyses have led to 110 publications which have identified 1,675 QTL. Additionally, these studies continue to identify genes associated with economically important traits such as growth rate, leanness, feed intake, meat quality, litter size, and disease resistance. A well developed QTL database called PigQTLdb is now as a valuable tool for summarizing and pinpointing in silico regions of interest to researchers. The commercial pig industry is actively incorporating these markers in marker-assisted selection along with traditional performance information to improve traits of economic performance. The long awaited sequencing efforts are also now beginning to provide sequence available for both comparative genomics and large scale single nucleotide polymorphism (SNP) association studies. While these advances are all positive, development of useful new trait families and measurement of new or underlying traits still limits future discoveries. A review of these developments is presented.
Keywords: Pig, Quantitative trait Loci, QTL, genome sequence, database
1. Introduction
The pig was most likely one of the first animals to be domesticated over 9,000 years ago. Pork is an important food source now representing forty-three percent of red meat consumed in the world 1 and is a valuable resource economically in many parts of the world. There are over 250 'non-extinct' breeds of swine 2 world wide, many which are pictured at http://www.ansi.okstate.edu/breeds/swine/). For most of the commercial pork industry less than 10 of these breeds are actively used for pork production as either purebreds or in synthetic crosses. Coordinated efforts to better understand the pig genome were initiated in the early 1990s with the development of the international PiGMaP gene mapping project as well as projects by the USDA and US agricultural universities. There were two significant linkage maps published by the mid-1990s 3, 4 of which the largest contained over 1,200 microsatellite markers. Since that time, growth of the linkage map has slowed though new gene markers such as microsatellites, amplified fragment length polymorphism (AFLPs), and single nucleotide polymorphisms (SNPs) have been continuously identified and mapped with limited integration of large linkage maps taking place. Substantial pig bioinformatics efforts have been undertaken by the Roslin Institute, Scotland (www.thearkdb.org) and in the US (http://www.animalgenome.org) supporting pig genome efforts as well as displaying the gene maps and other features of interest to pig genomics researchers.
A review of factors affecting pork's efficient production have been recently summarized 5 and include traits important for efficient production and traits that affect consumer preferences and pork consumption. Briefly, the most important traits for pork production in the growing phase are lean growth, feed intake, and pig survival. Arguably however, the two most economically important traits overall to pork production are reproductive traits and disease resistance. Though consumers are most concerned about the degree of fatness or carcass merit as well as pork quality, pork producers must also pay attention to the ever-growing demand by consumers that the pigs be grown without the use of antibiotics as growth promoters and in facilities that are more welfare conscious. Additionally, pork producers must do all of this while becoming more environmentally friendly by having pigs reduce feed wastage, improve feed efficiency, and produce waste that contains less contaminants.
2. QTL and candidate gene discovery
Initially many QTL experiments were undertaken by using initial linkage maps to help determine regions underlying traits of importance to the pig industry. These early QTL scans used families developed by generally crossing European Wild Boar with a commercial breed or crossing the exotic Chinese Meishan breed with a commercial breed. The first such QTL that was discovered was a major locus for fat deposition on chromosome 4 6. Such scans generally used 300 to 700 pigs and usually produced in a F2 design. More recently researchers have used two commercial breeds for F2 families or large commercial synthetic lines or breeds for candidate gene studies and large scale SNP association analyses.
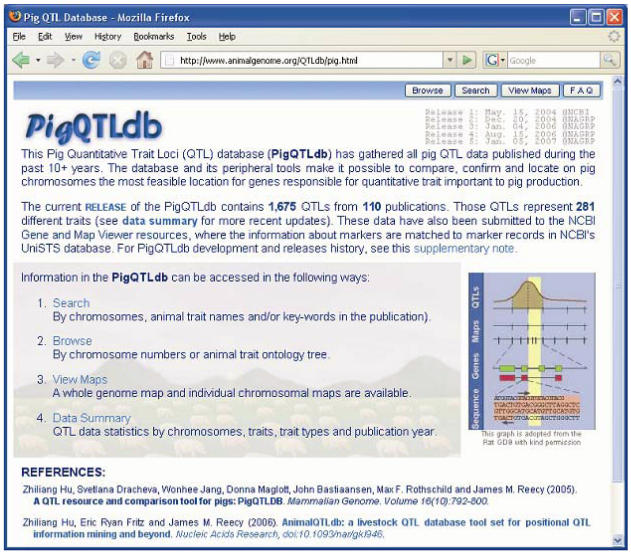
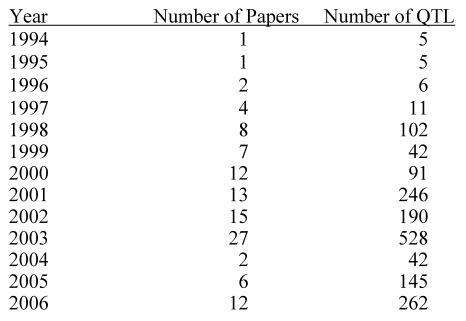
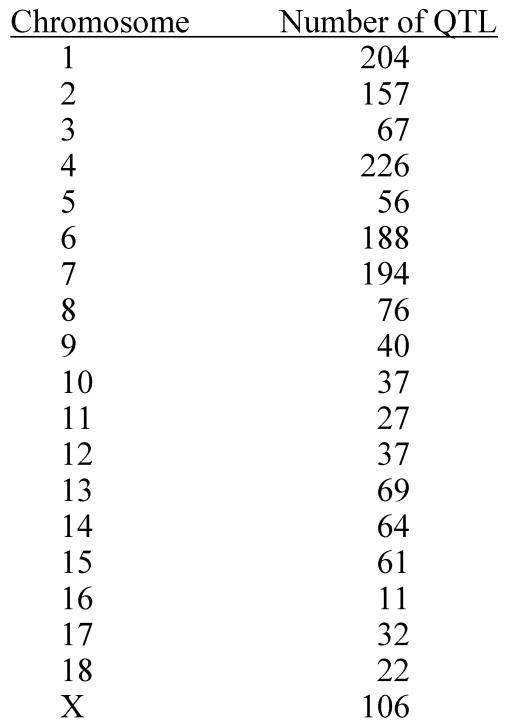
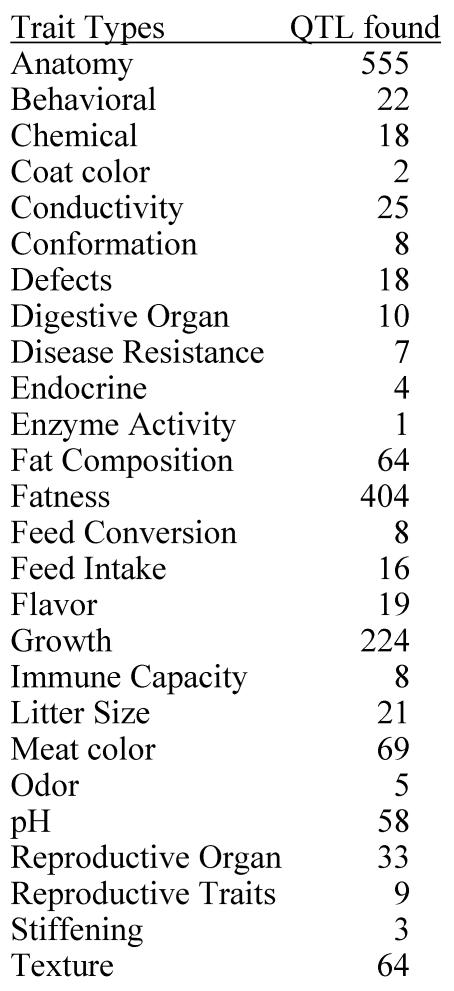
Previous papers 7, 8 have reviewed QTL results with an emphasis on each trait. However, given the level of database development such efforts seem redundant here. QTL results from 110 papers have identified 1,675 QTL. An extensive summary can be found at a new database called PigQTLdb (http://www.animalgenome.org/QTLdb/pig.html; Figure 1) that combines all the published QTL information into one searchable database and allows the user to search by either, chromosome, trait, or key words from the publications 9. For completeness the results are summarized in Tables 1-5 in this paper. As can be seen some traits have extensive numbers of QTL (i.e. fatness) while others (i.e. health, disease resistance) have had few being discovered. Perhaps more interesting is the fact that only a limited number of these QTL have been further investigated to the point that a known causative mutation has been implicated or proven 5. These include IGF2 for muscling and CAST for tenderness on chromosome 2, and PRKAG3 for meat quality on chromosome 15. For some qualitative traits like coat color or some single gene abnormalities scans have proved quite useful. Interestingly, the first QTL found on chromosome 4 for fatness has yet to be identified. Candidate gene analyses have on the other hand been more successful. Four genes (ESR, PRLR, RBP4, FSHB) identified to date have shown significant associations with litter size with effects ranging from 0.25 to over 1 pig per allele per gene copy with variations depending on breed background 8. Over 20 genes have been examined in multiple laboratories for growth and backfat traits with a causative mutation in MC4R being clearly identified affecting feed intake, growth and backfat 5. Extensively examined meat quality genes (HAL, RN) have been reported and genetic markers identified within these genes now permit genetic testing and therefore have allowed producers to remove the alleles deleterious to meat quality. Several candidate genes or gene regions (K88, FUT1, SLA, NRAMP) have been identified to be associated with differences in immune response or disease resistance with FUT1 being currently used to reduce post weaning diarrhea in commercial pork production. Recently, a polymorphism has been identified as showing an association with resistance to K88 E. coli 10.
Figure 1.
Front page of the Pig QTLdb (http://www.animalgenome.org/QTLdb/pig.html), showing database summaries and ways the database may be accessed.
Table 1.
Number of Publications and QTL by Years Reported
Source: PigQTLdb (http://www.animalgenome.org/QTLdb/, 9)
Table 5.
Number of QTL by Chromosomes
Source: PigQTLdb (http://www.animalgenome.org/QTLdb/, 9)
3. Sequencing the pig genome
A swine genome community effort produced a 'White Paper' that outlined the role pigs play in agriculture and as biological models for humans. Efforts to sequence the pig genome have come from many fronts using multiple approaches 11. Sequences for the pig genome have been generated from ESTs of cDNA clones from various tissues, the sequencing of candidate genes, and more recently large scale genomic sequencing efforts from the swine genome community. Most recently, the efforts of the Sino-Danish generated ~3.84 million shotgun sequences of the pig genome resulting in a 0.66X coverage of the porcine genome translating to 48% of the pig genome being sequenced by this project 12. For the past 3 years, collaboration has taken the form of an “International Swine Genome Sequencing” committee, which is active in pushing the pig genome sequencing agenda. Sequencing efforts are taking place at the Sanger Institute in the UK, through this international collaboration composed of many different laboratories. These efforts are also being directed at SNP identification for future large scale association trials. As sequencing efforts gain momentum then SNP discovery will also increase. Private efforts by at least two commercial companies have also produced large SNP maps for association studies within commercial company breeding lines and these SNPs are being actively used for genetic improvement.
4. Opportunities for increased QTL discovery
Traditional QTL analyses in the pig have been generally limited to the usual traits affecting growth, carcass composition, reproduction and meat quality. A very limited number of QTL analyses have been devoted to health, disease susceptibility or immune response traits. Given the importance of disease susceptibility to the overall pork production economic enterprise this is one area where considerably more information must be gained. Limitations of course include development of appropriate families and disease challenge models.
Furthermore, while the approach to directly associate genomic regions with traits of interests has been effective in looking for useful markers for marker assisted selection to make genetic improvement, it should be realized that the composition of a trait is a complex process that involves physiological, biochemical, genetic, and often environmental factors. Traditional QTL analyses, because of their usual requirements to easily and inexpensively measure traits might have limited our view of understanding the nature of how a trait has developed. Systematic studies of factors that may contribute to the ultimate trait outcome may help to illustrate the underlying cause of a specific phenotype with better accuracy. For example, including ovulation rate, follicle stimulation hormone levels, uterine length and feed intake and environmental factors may likely add value to QTL analyses and functional evaluation of candidate mutations affecting litter size.
A second advance for QTL analyses was the development of imprinting models to look for imprinted QTL in pigs. Several such studies have been completed and many imprinted QTL have been found. Many of these imprinted QTL make good sense when compared to imprinted gene information from other species such as the mouse. Further opportunity to understand the underlying genes have been made possible with the development of models which consider epistasis 13. To date such analyses have however been rare in most species and no large epistatic model in the pig has been considered.
The development of expression arrays and the measurement of expression under different environmental conditions 14 have led to the opportunity of eQTL which measure and treat each observation for gene expression from an array or chip as a new “trait”. This creates the opportunity for tens of thousands of new traits and the possibility to discover underlying genes and mutations affecting certain traits. Several eQTL experiments are underway but at this time none in the pig are fully published.
One opportunity, apart from in silico approaches to combine QTL have been to do joint QTL analyses. These are complicated by a lack of similar markers and often by slightly different trait definitions and measurements. On the other hand, there are many “repeated” discoveries of some QTL, each with limited population size, slightly different testing methods and experimental designs. Combining of the existing results will help to better utilize the resources and correct for possible experimental bias, and add power for detecting “real QTL”. There are already some combined QTL analysis studies 15, 16. The emergence of new approaches will definitely improve multi-factorial and complex trait analysis for QTL 17. The active development of the QTLdb 18 has provided a powerful tool for QTL comparisons and alignment of related structural genomic information for positional QTL mining. However, in order to fully utilize the power of meta-analysis, it is necessary to emphasize that individual QTL experiments should be “standardized” in order for the ease of future such analysis. These may include but not limited to, standardized terminology and measurement methods for traits, well described experimental design, clear criteria to define a QTL, minimum required statistical parameters to find a QTL, and common reference maps to name a few.
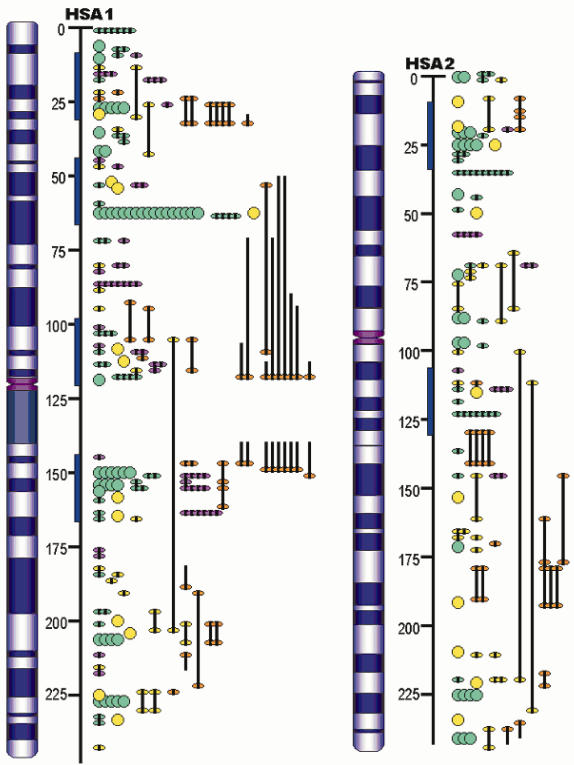
Furthermore, the QTL identified in the porcine genome contributes to construction of concordant QTL maps in mammals. Although the organization of mammalian genomes by chromosomal rearrangements has been ongoing since their divergence from a common ancestor approximately 60 – 110 million years ago, evidence has shown that most orthologous genes were retained within each genome 19. Therefore, the same orthologous gene may have conserved functions in biological or biochemical pathways, and thus explain the same or similar variations of the concordant QTL among different species. For example, Wang and colleagues 20-21 reported that 93% of high density lipoprotein cholesterol QTL, 100% of low density lipoprotein cholesterol QTL, 80% of triglyceride QTL and 63% of atherosclerosis QTL were found to be concordant between human and mouse. As indicated in Table 3, more than 400 fat QTL have been identified in the pig genome. Initial research examined some of these genes 22 in pigs and humans and now a more advanced pilot study by Jiang et al. 23 has assigned pig, human, mouse and cattle fat QTL to the human ortholgous regions and has indicated that there are at least six putative concordant QTL regions for lipogenesis on human chromosomes 1 and 2 (HSA1 and HSA2), corresponding to pig chromosomes 4, 6, 9, 10, 14 and 3, 15, respectively (Figure 2). On one hand, these data provide evidence that the pig is a unique model organism to study and validate obesity QTL and candidate genes in humans 22, on the other hand, QTL information from other species may be used to accelerate the QTL discoveries in pigs.
Table 3.
Number of QTL by Pig Trait Types
Source: PigQTLdb (http://www.animalgenome.org/QTLdb/, 9)
Figure 2.
Example of mammalian concordant lipogenesis QTL maps for human chromosomes 1 and 2 (HSA1 and HSA2) as references according to number of obesity/fat QTL reported in pig (purple), human (green), mouse (yellow), and cow (orange). The blue bars indicate the putative concordant fat QTL regions.
5. Limitations to future QTL discovery
Traditional traits with moderate heritabilities (>25%) can be measured in QTL experiments with relative ease and with family or population sizes of 500 to 700 F2 individuals QTL effects of 3% or larger are usually detected. However, it is clear from the review of many experiments that for traits like reproduction and disease susceptibility with heritabilities of approximately 10%, such sample sizes are inadequate to find the effects desired. Furthermore, researchers often dismiss discoveries from candidate gene analyses because they are not found in QTL studies. Such conclusions are the result of faulty reasoning since QTL experiments are often much smaller and have less power than association or candidate gene studies. The bottom line however is that much larger experiments must be formulated to find small QTL effects. These should include several thousands of individuals. Clearly the production of such families and populations is quite difficult and very expensive. Additionally, specialized families segregating for genetic abnormalities or special disease problems must be developed if the underlying mutations are to be found.
Another limitation to advancing QTL study is the measurement of complex phenotypes. Collection of health and disease susceptibility phenotypes has been previously discussed. However, additional phenotypes of underlying traits might also yield interesting and useful information. For instance, for reproduction more attention could be paid to ovulation rate, hormone levels and other underlying factors. For growth and muscle composition levels of certain hormones and metabolites could be measured and considered traits of interest. Such collection of more useful and descriptive traits would aid in QTL discovery and ultimately in discovering the underlying genes of real interest.
6. Conclusions
QTL discovery in the pig has advanced rapidly but the ultimate goal of discovery of the underlying mutations affecting certain traits has been limited. Funding remains a limiting factor as does the development and maintenance of specialized pig families and populations for certain traits and disorders. New methods and experiments, combined with the pig genome sequence, which is expected in the next year should aid in these efforts. Ultimately QTL discovery will improve efficiency of pig production, cut costs, make it possible to have healthier products for consumers and make the pig a more useful biomedical model.
Table 2.
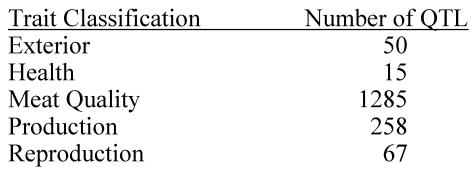
Number of QTL by general Trait Classification
Source: PigQTLdb (http://www.animalgenome.org/QTLdb/, 9)
Table 4.
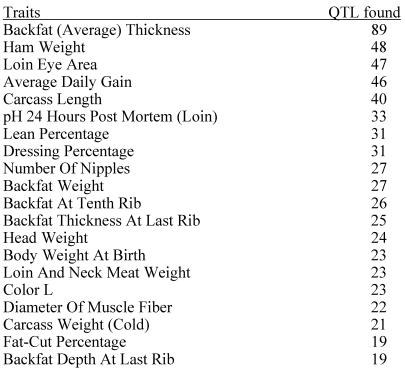
Top 20 Traits in Terms of Number of QTL Reported.
Source : PigQTLdb (http://www.animalgenome.org/QTLdb/, 9)
Acknowledgments
The authors thank members of the Rothschild laboratory for their assistance and previous contributions. This work was supported in part by the USDA CSREES National Animal Genome Research Program NRSP8 which supports the US Pig Genome Coordination Program and the US Bioinformatics Coordination program. Support from the Iowa Agriculture and Home Economics Experiment Station, Ames, Iowa and by Hatch Act and State of Iowa funds is also appreciated. The Agricultural Research Center, Washington State University also supported this project.
References
- 1.Rothschild MF, Ruvinsky A. Genetics of the Pig. Oxon, UK: CABI Press; 1998. [Google Scholar]
- 2.Mason IL. A World Dictionary of Livestock Breeds, Types, and Varieties. 2nd Edition. Farnham Royal, UK: CAB International; 1969. [Google Scholar]
- 3.Archibald AL, Brown JF, Couperwhite S et al. The PiGMaP consortium linkage map of the pig (Sus scrofa) Mammalian Genome. 1995;6:157–175. doi: 10.1007/BF00293008. [DOI] [PubMed] [Google Scholar]
- 4.Rohrer GA, Alexander LJ, Hu ZL et al. A comprehensive map of the porcine genome. Genome Research. 1996;6:371–391. doi: 10.1101/gr.6.5.371. [DOI] [PubMed] [Google Scholar]
- 5.Mote B, Rothschild MF. Cracking the Genomic Piggy Bank: Identifying Secrets of the Pig Genome. Genome Dynamics. 2006;2:86–96. doi: 10.1159/000095097. [DOI] [PubMed] [Google Scholar]
- 6.Andersson L, Haley CS, Ellegren H et al. Genetic mapping of quantitative trait loci for growth and fatness in pigs. Science. 1994;263(5154):1771–1774. doi: 10.1126/science.8134840. [DOI] [PubMed] [Google Scholar]
- 7.Bidanel JP, Rothschild MF. Current status of quantitative trait locus mapping in pigs. Pig News and Information. 2002;23(2):39N–53N. [Google Scholar]
- 8.Buske B, Sternstein I, Brockmann G. QTL and candidate genes for fecundity in sows. Anim Reprod Sci. 2006;95(3-4):167–183. doi: 10.1016/j.anireprosci.2005.12.015. [DOI] [PubMed] [Google Scholar]
- 9.Hu ZL, Dracheva S, Jang W et al. A QTL resource and comparison tool for pigs: PigQTLDB. Mammalian Genome. 2005;15:792–800. doi: 10.1007/s00335-005-0060-9. [DOI] [PubMed] [Google Scholar]
- 10.Jørgensen CB, Cirea S, Anderson SI et al. Linkage and comparative mapping of the locus controlling susceptibility towards E.coli F4ab/ac diarrhea in pigs. Cytogenetics and Genome Research. 2003;102:157–162. doi: 10.1159/000075742. [DOI] [PubMed] [Google Scholar]
- 11.Chen K, Baxter T, Muir W, Groenen M, Schook L. Genetic resources, genome mapping and evolutionary genomics of the pig (Sus scrofa) Int J Biol Sci. 2007;3:153–165. doi: 10.7150/ijbs.3.153. [DOI] [PMC free article] [PubMed] [Google Scholar]
- 12.Wernersson R, Schierup MH, Jørgensen FG et al. Pigs in sequence space: A 0.66X coverage pig genome survey based on shotgun sequencing. BMC Genomics. 2005;6:70. doi: 10.1186/1471-2164-6-70. [DOI] [PMC free article] [PubMed] [Google Scholar]
- 13.Carlborg O, Haley CS. Epistasis: too often neglected in complex trait studies? Nat Rev Genet. 2004;5(8):618–625. doi: 10.1038/nrg1407. [DOI] [PubMed] [Google Scholar]
- 14.Tuggle CK, Wang YF, Couture O. Advances in Swine Transcriptomics. Int J Biol Sci. 2007;3:132–152. doi: 10.7150/ijbs.3.132. [DOI] [PMC free article] [PubMed] [Google Scholar]
- 15.Kim JJ, Zhao H, Thomsen H et al. Combined line-cross and half-sib QTL analysis of crosses between outbred lines. Genet Res. 2005;85(3):235–48. doi: 10.1017/S0016672305007597. [DOI] [PubMed] [Google Scholar]
- 16.Walling GA, Visscher PM, Andersson L et al. Combined analyses of data from QTL mapping studies: Chromosome 4 effects on porcine growth and fatness. Genetics. 2000;155(3):1369–1378. doi: 10.1093/genetics/155.3.1369. [DOI] [PMC free article] [PubMed] [Google Scholar]
- 17.Andersson L, Georges M. Domestic-animal genomics: deciphering the genetics of complex traits. Nat Rev Genet. 2004;5(3):202–212. doi: 10.1038/nrg1294. [DOI] [PubMed] [Google Scholar]
- 18.Hu ZL, Fritz ER, Reecy JM. AnimalQTLdb: a livestock QTL database tool set for positional QTL information mining and beyond. Nucleic Acids Research. 2007. [DOI] [PMC free article] [PubMed]
- 19.Nadeau JH, Sankoff D. Counting on comparative maps. Trends Genet. 1998;14(12):495–501. doi: 10.1016/s0168-9525(98)01607-2. [DOI] [PubMed] [Google Scholar]
- 20.Wang X, Ishimori N, Korstanje R et al. Identifying novel genes for atherosclerosis through mouse-human comparative genetics. American Journal of Human Genetics. 2005;77(1):1–15. doi: 10.1086/431656. [DOI] [PMC free article] [PubMed] [Google Scholar]
- 21.Wang X, Paigen B. Genome-wide search for new genes controlling plasma lipid concentrations in mice and humans. Current Opinion in Lipidology. 2005;16(2):127–137. doi: 10.1097/01.mol.0000162317.09054.9d. [DOI] [PubMed] [Google Scholar]
- 22.Kim KS, Thomsen H, Bastiaansen J et al. Investigation of obesity candidate genes on porcine fat deposition quantitative trait loci regions. Obes Res. 2004;12(12):1981–1994. doi: 10.1038/oby.2004.249. [DOI] [PubMed] [Google Scholar]
- 23.Jiang Z, Rothschild MF. The mammalian concordant QTL map for lipogenesis. Manuscript.


