Abstract
SYNOPSIS
This article presents a review of the literature published from 1989 to 2005 for articles that examined the economic burden incurred by families as a result of caring for a child with disabilities. The review was performed according to a comprehensive economic conceptual model developed by the authors and to the guidelines set out by Canadian Coordinating Office for Health Technology Assessment.
The analysis indicated that the burden incurred by these families can be substantial, especially among families who care for a child with a severe disability. However, the variability and the quality of methods is such that the return on investment in knowledge of costs in this area is not as high as it could have been had methodological procedures been more standardized. A comprehensive and systematic approach is suggested for future research.
In Canada, more than half a million children and people younger than 20 years old have some form of disability.1 Approximately one hundred fifty-five thousand children from 5 to 14 years of age live with activity limitations; of these, 43% live with severe to very severe limitations.2 Advances in medical technology have improved the chances for a premature baby or a child with a complex condition to survive into adolescence and adulthood. Consequently, the number of children with disabilities is on the rise. These children, like any child, require care, but children with disabilities often require exceptional levels of care and related costs. Many of these costs were previously supported through public funds via institutionalization. However, there has been a growing trend toward deinstitutionalization, resulting in the vast majority of children with disabilities being cared for in the home, leaving families as the most important source of long-term care and assistance.3–6
Of concern is evidence that indicates that these families are bearing more than their “fair share” of the costs of caring for their children. Families who care for a child with a disability are more likely to have non-reimbursed expenses for disability-related supports. The literature reports troubling findings that uncover an association between low income and children with special needs, with associations between these factors that might go both ways.7 In other words, children with a disability are often born into low income families; however, it has also been reported that families who care for a children with a disability often find themselves sliding towards poverty. A recent national U.S. study reported that 40% of families of children with special health care needs experience a financial burden due to their child's condition.8 Similar findings have been reported in other countries.9,10 Hence, not only is the child with the disability affected, but so is the family. For example, in order to meet their child's needs, families who care for a child with a disability are more likely to be single income families with lower quality jobs yielding lower incomes, to live in poor quality housing, and to live in poverty. Furthermore, these families are more likely to be single-parent families. Moreover, parents of a disabled child require more time off work and are more likely to work reduced hours and to decline overtime.4,11–14 The size and impact of the burden incurred by these families, however, is not well-known.
Policy can play a key role in supporting families in their caregiving role. At the same time, though, cost data is not readily available to policy makers. For the most part, legislators make decisions about policy based on program data and program contributions to public expenditures, while the costs to families are usually hidden and overlooked. Consequently, the development of evidence-based policy is hindered.
There is evidence in the literature that parents of children with disabilities face unique financial challenges and meeting their child's needs and making financial ends meet is difficult for most. Many efforts have been deployed and initiatives undertaken to help alleviate the economic burden associated with caring for these children. A considerable amount has been written about policies related to children with disabilities. This is an area where needs are great and the resources often lacking. Yet much of what has been written has focused on specific deficit areas, such as medical care, education, child care, and home support. These policies are seldom analyzed in an integrated way. To make a policy assessment, one should analyse them by taking a broad perspective. The economic approach is one that lends itself to such a broad viewpoint. By taking this approach, one can incorporate money income, costs, nonmonetary resources such as caregiving time, and health outcomes into a unified assessment.
This article commences with an explanation of the economic approach as it can be related to the issues of families who care for a child with a disability. Next, a conceptual economic model depicting the sources of income and types of consumption is described. Finally, with the aim of drawing a clear picture of the magnitude of costs incurred by families who care for children with disabilities, a review of the literature from 1989 to 2005 based on the economic model is presented and discussed, conclusions drawn, and recommendations for future research presented. From a policy perspective, it is important to understand the costs and circumstances that influence costs.
ECONOMIC APPROACH
Very broadly, there are two types of economic questions in social policy matters. The first type deals with economic efficiency. Using this approach, one may ask the question, “What do we get for our money for different approaches to development for children with disabilities?” In this type of question, one estimates the total costs of each approach and compares these to outcomes. The interest behind such a question lies in knowing what differences in outcomes are obtained for the cost incurred when one invests in one intervention rather than another.
The second type of question refers to equity. Equity relates to fairness, in the sense that the economic burden may be too great for some. Equity generally refers to income, and lack thereof has been recognized by the World Health Organization (WHO) as an important determinant of ill health. Furthermore, children are well aware of inequalities in income and the negative impact it can have on their lives.15 Economic burden can be assumed by both the family and the rest of society; equity refers to how the burden is shared between the two. From a societal perspective, there exists no gold standard as to what is and is not an acceptable level of burden. Studies in the area of family burden have been driven by equity concerns. Hence, equity costing is the main focus of this paper.
To facilitate the assessment of the magnitude of the burden, it is very useful to have a comparator statistic. One statistic that will be helpful in measuring economic burden is the total cost of caring for a disabled child compared with that for a nondisabled child. Another statistic that is useful in analyzing burden is the ratio of the amount spent on caring for a disabled child to family income. Gross or net cost could be used, and as will be seen below, there are many ways of conceptualizing net income. All of these statistics are descriptive, and a threshold value needs to be set to allow one to judge whether a burden is acceptable or not from a societal perspective.
CONCEPTUAL MODEL
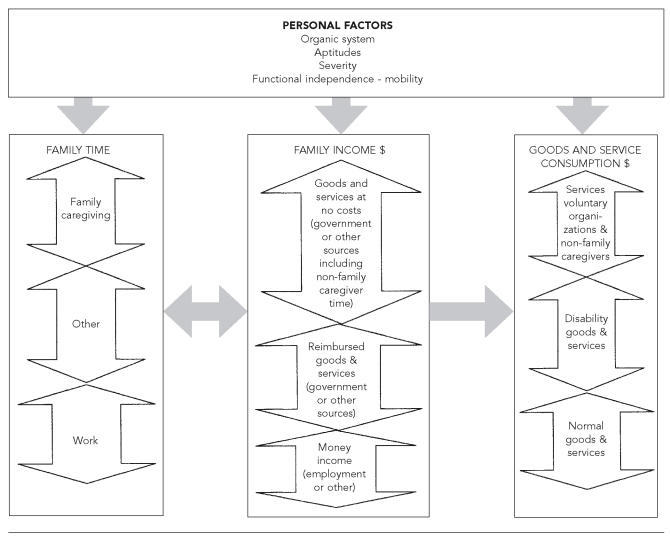
The conceptual model has two levels. The first level refers to the personal factors that characterize the child's disability including aptitudes, severity of the disability, and functional independence. Studies have shown that the severity of the disability has an impact on the resources and cost of care.16,17 The second level of the model depicts the broad categories of costs incurred by families and society. The model also integrates income from a broader perspective, including revenue from social policies in place and employment income, which are part of the dynamics of costs.
Family time is broken down into caregiving time (for family members only), employment time, and other time (leisure, sleep). The model recognises the value of caregiving time. Time of individuals other than family members that is provided at no charge falls under goods and service consumption under services from voluntary organizations.
Family income is viewed broadly to include money income (from employment and other sources), reimbursement for goods and services that the family pays for, and an imputed value for goods and services that are received at no cost from voluntary agencies or government. Taxes reduce family income and subsidies increase it. The rationale for such a broad definition is as follows: the income measure should encompass all of the means by which the families obtain goods and services to care for the disabled child. Thus, if an otherwise low income family received considerable public support for services, the family's income should reflect this support (which would also appear in the goods and services consumed category, see below).
It should be noted that employment income is measured in monetary terms in the income category, and since it is employment time that generates employment income, one can alternatively use employment time as an indicator of income. However, if one were to obtain a single overall measure of the resources available to the family, only the employment income variable would be measured. Other time—that is, non-employment time—should be included as a resource available to the family. Despite this, the variable employment time still has importance in its own right, as a component of how a family uses its time resources.
The consumption category is the third category in our model. Families can use their incomes on savings, consumption of “normal” goods and services, and on goods and services for the disabled child's care (e.g., equipment, travel, special diet, special clothing, renovation, relocation, wheelchairs). In addition, they receive services such as in-kind support from voluntary organizations. Ideally, all of these should be identified and recorded. If they are subsidized, then, as stated above, the value of the subsidy should also be included as income. In this way one can measure both the use of services and all of the resources available to obtain them.
Institutionalized care could be incorporated in this scheme by considering this care as being government-provided. Both education and health care from governments could also be included. In that case, there would be a much larger government component and a much smaller personal or family component to income. However, for the purpose of the current review, institutionalized care and government-provided health and education services are not included.
There is an interaction between many of the variables in the model. First, patient descriptors such as age and severity can influence time use as well as consumption. Second, employment time will have an impact on family income. And third, family income will influence the pattern of consumption of goods and services. An example of the model's dynamics is illustrated here: households with more time available for work would likely have more income from employment and, in return, may be prone to spending more money to meet some of the child's needs such as babysitting or special equipment needs. On the other hand, households that spend more time providing care will have less time for work and, therefore, lower employment incomes. Lower incomes will likely result in less spending and consequently some of the child's needs may not be met. The economic model depicted herein highlights items to consider when calculating economic burden.
The above mentioned model is an ideal. Often, one will not have sufficient data to measure the value of some services such as support from voluntary organizations, and also to devise a measure to capture the imputed income to the family by receiving the support service. However, the model reminds us that we need to be consistent, and if a free service is consumed, then the income measure should be adjusted to reflect this. Otherwise, family costs relative to “true” (money plus imputed) income will be distorted as a measure of burden.
LITERATURE REVIEW
The economic model described above served as a conceptual model for reviewing and analyzing the literature. This review focuses on the economic burden incurred by families as a result of caring for a child with disabilities. This article excludes items from the review conducted by Jacobs and McDermott in 1989, at the time of which merely six studies had examined the financial cost to families who care for a chronically ill or disabled child.18
The population of interest to the authors is children with a physical disability such as cerebral palsy or spina bifida. Consequently, articles that examine costs in children with a chronic illness only such as cancer or HIV, or a mental deficiency or other psychological disorders, attention deficit hyperactivity disorder, or arthritis were not included in this review.
METHOD
Literature search and article selection strategy
An electronic search of articles from Medline, CINAHL, EconoLit, ERIC, PsycINFO, SWAD, PAIS and FRANCIS databases was conducted for articles published between January 1989 and March 2005. Key words included in the search were: cost, indirect costs, financial burden, caring, disability, children, poverty, economic aspects of illness, special needs, and impact of disability. In addition to the published literature pertaining to the cost of caring for a disabled child, government documents and documents published by key university-based research institutes (e.g., ROEHER Institute) and Canadian not-for-profit organizations (e.g., Caledon Institute of Social Policy, Canadian Council on Social Development, Canadian Policy Research Network) were also reviewed.
The article title and abstract was reviewed to ensure that the study was specific to caregiver cost of caring for a disabled child. References from each article were scanned for missed articles and pertinent references were obtained. These articles were then scanned and retained for review if they examined either family-incurred time or consumption costs specific to caring for a child with a disability who was living at home. Of the original 100 articles, 17 were kept for the review.
Abstracting articles
Articles were abstracted for resources as described in the proposed economic conceptual model, including family time, family income, and family consumption. Articles were also abstracted for the following descriptive categories: country of study, study population and number of participants, time period observed, costing method, and main results according to consumption costs, reported as: gross cost per child, net cost per child, gross cost/family income, time cost, and foregone employment. In addition, article results were searched for a frequency distribution of the numbers of families with regard to costs incurred, age-cost profile, and the presence of a standard cost.
Evaluation of costing method
The unit of observation is the family. The evaluation of the costing method used in each of the studies was directed by guidelines established by the Canadian Coordinating Office for Health Technology Assessment (CCOHTA).19 Ideally, costing consists of three steps: the identification of resources, the measurement of resource use (physical quantities of resources), and cost valuation (unit cost or price). The first step, identification of resources, should consist of listing the resources consumed by the family related to caring for the disabled child. The second step, measurement of resource use, consists of determining the quantities of resources consumed or purchased. Two method categories are identified here: first, synthetic methods, which consist of using secondary data such as administrative databases, expert panel, or retrospective chart reviews; second, primary data gathering or the prospective collection of data specifically for the study at hand. The second source is the most relevant to time and non-health consumption costs because there are no databases that contain these components of the analysis. The final step, cost valuation, consists of assigning a price to the resources consumed. In this step, the source of the price determination should be identified or the method employed to estimate the dollar value should be detailed. As for caregiver time, the CCOHTA guidelines state that citing the extent of caregiver time in units of time is appropriate.19
While reviewing the results, it is important to take into account that all currencies were converted to U.S. dollars. The exchange rate employed was that of the year average rate, which refers to the year data were collected in the different studies.20 Finally, if the observation time is greater than one year, we noted whether the author discounted future period costs.
Interpreting the results
In order to interpret the results of a costing study, one should have a threshold or decision rule in light of which one could judge a specific cost burden, however it was calculated, to be acceptable or not. Even if one had a comparator statistic (e.g., cost of a non-disabled child), one would still need to stipulate a (subjective) threshold in order to make a judgement as to whether the burden was “large” or “unacceptably large.” Such thresholds are often absent from costing studies in this area.
RESULTS
General overview
Since 1989, seventeen articles have been published on the personal cost of caring for a disabled child (Tables 1 and 2). Most of the studies were from the U.S. (n=11), followed by the U.K. (n=3).
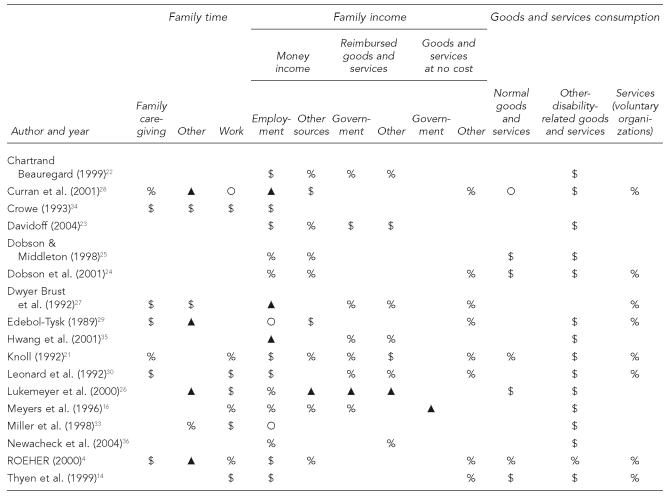
Table 1.
Profile of economic resources in studies investigating economic costs to families who care for a child with disabilities
Ο = reported as mentioned
▲ = measured but not reported
% = measured and reported as frequency or percentage
§ = measured and magnitude indicated
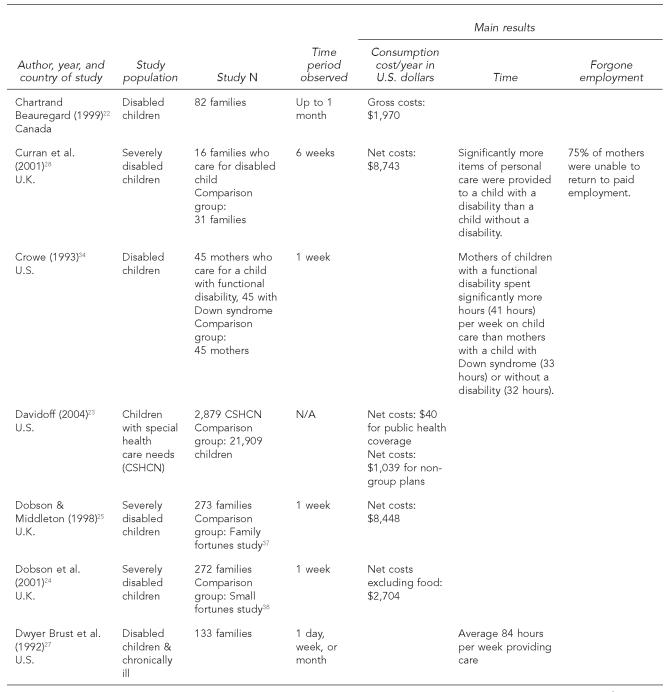
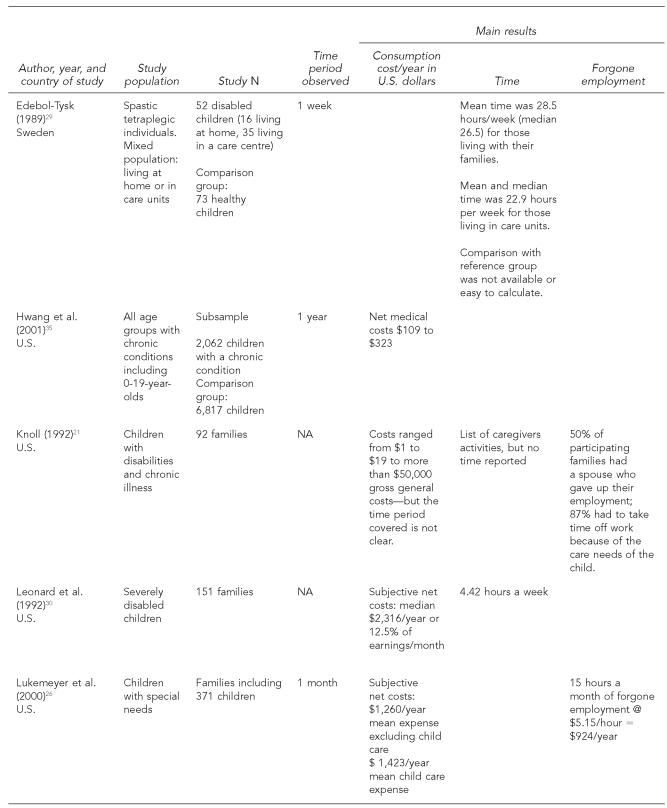
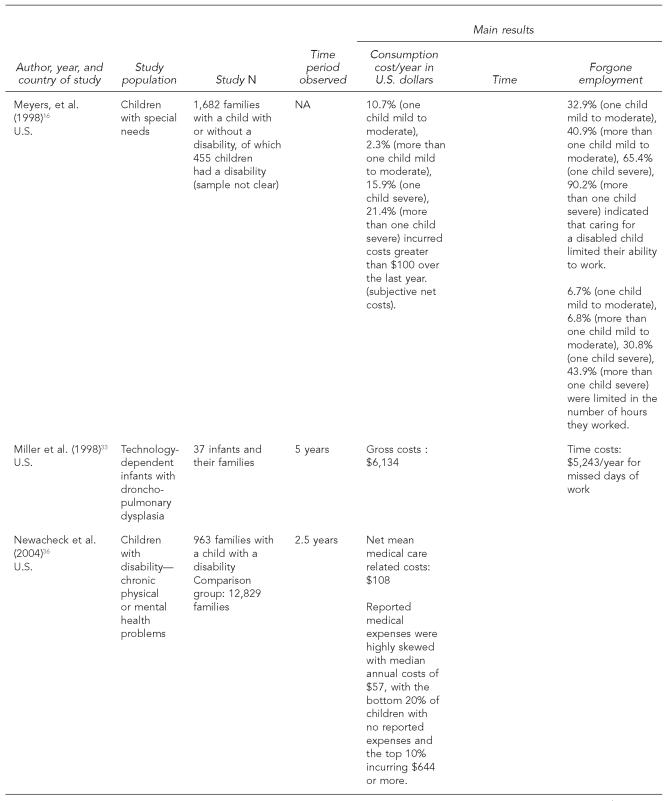
Table 2.
Profile of studies investigating the economic costs to families who care for a child with disabilities
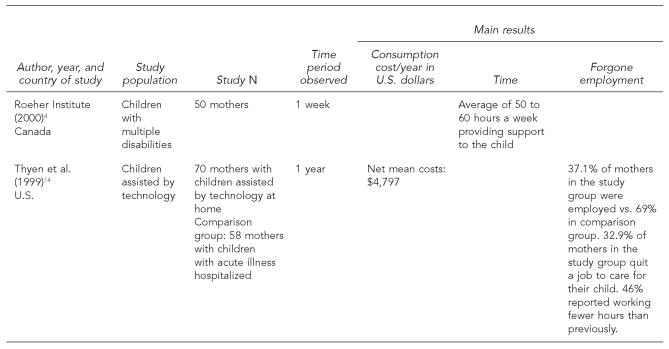
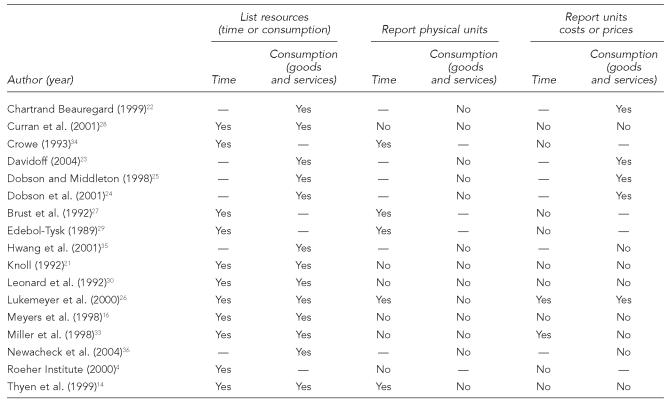
Table 1 provides a profile of the large categories of costs and resources as depicted in the Figure. In particular, it provides an overview of which and the extent to which costs and resources were included in the studies reviewed. It does this by highlighting whether or not the studies simply mentioned an item (Ο), measured but did not report the item in the results (▲), measured and reported results, as a frequency or percentage to a “yes” or “no” question, for example (%), or measured and reported the magnitude of item in hours or dollars ($) for each cost or resource included in the study. The data in Table 1 indicate that while many studies measured costs and resources, none of the studies collected sufficient data to provide a “true” measure of burden. For example, Knoll measured family caregiving time, work time, and different sources of family income, as well as goods and services consumption.21 However, the magnitude of the items measured was not reported for most of these measures, with the exception of income and some disability-related goods and services, the latter of which were reported as gross general costs only. In most cases, only global costs were reported, as shown in Table 2. The exception is the four studies22–26 that reported unit cost or prices as depicted in Table 3.
Figure.
The dynamics of economic costs incurred by families who care for a disabled child
Table 3.
Portrait of CCOHTA costing method by study
CCOHTA = Canadian Coordinating Office for Health Technology Assessment
In Table 2 an overview of the characteristics of each study is presented. Depending on the study, not all fields were completed, as not all categories were applicable to all studies, or the study did not provide sufficient information. As observed in this table, there was little methodological consistency between studies. Specifically, the period of observation in the studies varied from 24 hours to five years. One-time mail-out or telephone administered surveys were the main source of data collection. Sample sizes ranged from 16 to 37,000, with most samples ranging from 100 to 300. Disability-related consumption cost incurred by families varied depending on the country of study, the scope of cost included, the time period observed, the type of disability and/or the severity of the disability, and the calculation of net (there is a comparator) or gross cost (absolute values of burden). While many of the studies included information on the type and severity of disability,16,24–31 definitions and means of measurement varied from one study to another. Furthermore, few studies accounted for the severity of disability in their analysis. Of these few, results point to severity as a strong predictor that a family will incur expenses,16,26,30 and provide increased frequency of care28,30 or time.27 In contrast, one study reported no difference in spending according to severity.24
Reported consumption cost of caring for a child with a disability varied from $108 to $8,742 a year. Similarly, there was a large range in caregiver time cost, with reported results ranging from four hours to 84 hours per week. While there was little information on forgone employment, the information that was available presents results that differ greatly from one study to the next. Specifically, one study provided values of $77 to $80 per month depending on the severity of the disability,26 and another reported a net value of seven hours of lost work hours per week.32 In contrast, another study reported important time costs for missed work days and employment changes of $5,243 per year.33
A number of studies included age/cost profiles in their analysis; however, results were inconsistent. For example, two studies out of the U.K. showed no significant difference in spending24 or frequency of care28 according to age, while another provided evidence of increased material cost among families whose children were younger.25 Another study reported increased caregiving time for toddlers as opposed to infants and preschoolers.34
The inclusion of a comparison group in a study is seen as a methodological advantage since it provides a direct estimate of cost over and above that required for a child without a disability. Nine studies included a comparison group;23–25,28,29,32,34–36 that is, they collected data on the net cost of caring for a child with a disability. This was possible when the study included a reference group of families who care for a non-disabled child. In spite of the inclusion of comparison groups, reported consumption and time costs varied greatly from one study to the next. For example, Curran et al.28 (2001) reported additional annual net costs of $8,742, whereas Newacheck36 (2004) reported a net annual cost of $108. At the same time, while the inclusion of a comparison group is advantageous to uncovering net costs, it does not serve its purpose when comparisons are not provided in the analysis. This was the case for the study by Edebol-Tysk, where the additional amount of time required to care for a child with a disability compared to a child without a disability was not clearly presented in the results section.29 In lieu of a comparison group, Dobson and Middleton employed a previously established standard cost of caring for a child without a disability as their reference.24,25 The standard costs employed in the 1998 and 2001 publications date from 199437 and 1997,38 respectively. The standard was then compared to the cost of caring for a child with a disability. In one study, they reported costs of caring for a child with a disability at two to three times that of a non-disabled child.25 The remaining studies relied on subjective standards such as instructing the respondents to indicate cost related to their child's disability,22,26,30 collected gross cost,4,21 or in some cases did not specify or clarify.33,39,40
While most studies relied on retrospective research designs that rely heavily on recall, the data analyzed by Newacheck et al. (2004) was collected prospectively with repeated measures over a period of 2.5 years, increasing the reliability of their research findings.36 Curran et al. (2001) were also original in their study design as they collected data over a period of six weeks, including the vacation and school period.28 The longer data collection periods allowed these studies to help control for time biases. Curran et al. reported significantly higher additional consumption costs when compared to Newacheck, with values of $8,742 vs. $108. Interestingly, Newacheck adopted a very broad definition of disability and limited costs to medical costs whereas Curran et al. examined costs among families who care for a child with a severe disability. Unfortunately, Curran provided no indication as to the nature of the disability-related consumption costs incurred by the family.
Only one study, Newacheck et al., established a threshold as an indication of an unfair burden of cost incurred by families.36 They used out-of-pocket costs exceeding 5% of family income as an indication of unfair burden. Their results highlight that the financial burden carried by low income families exceeds that of the higher income families. Specifically, low income families with a child with disabilities are approximately 19 times more likely to incur expenses exceeding 5% of their families' income than their higher income counterparts. Two other studies reported average family spending on costs related to their child's disability at 5% (Dobson et al.)24 and 12.5% (Leonard et al.)30 of their earnings. While these studies did not establish a threshold, if one keeps the 5% of family income as a threshold in mind, the burden incurred by the families in the latter study seems disastrous. The higher burden here may be a reflection of the severity of disability or a reflection of real net24,36 vs. subjective net costs.30
Review of costing method
A portrait of the CCOHTA costing methods included in each of the studies is available in Table 3. While all studies employed costing methods similar to those suggested by CCOHTA, details on how lists were determined, or valuation of resources used, were rarely available.16,22,24,25,36 As revealed in Table 3, only one of the studies26 clearly followed the three steps recommended by CCOHTA, first by identifying resources, then measuring resources, followed by valuation of resources used or purchased. Few studies reported costs by resource;22–26 rather, most reported a global cost. The studies that measured time cost were not likely to provide a valuation for total time; however, this is considered adequate following CCOHTA criteria. Two studies took their analysis to this final step by providing a value for work time measured as forgone opportunities. Specifically, Miller et al. (1998) provided a monetary value for missed work days and employment changes,33 while Lukemeyer et al. (2000) provided a monetary estimation for forgone employment.26
DISCUSSION
The main purpose of this article was to present a review of the literature from 1989 to 2005 for articles that examined the cost incurred by families as a result of caring for a child with disabilities. The review was performed according to an economic model developed by the authors and the guidelines set out by CCOHTA. Although not consistent across studies, the results show that the burden incurred by these families can be substantial, especially among those families who care for a child with a severe disability.
The absence of a consensus arising from the literature can be attributed to three factors: the absence of a theoretical base, methodological difficulties, and the absence of a standard in terms of which the resulting costs can be judged.
When analyzed according to the economic model proposed in the paper, it becomes evident that none of the studies reviewed employed a comprehensive economic approach to measuring costs. Of concern is that these costs cannot be accurately calculated or results interpreted without the full consideration of which resources and costs are relevant, and where they fit into the model. It is not feasible to measure all items, due to possible constraints in budgets, time, resources, and respondent burden. Yet, it is important that studies start off with a “big picture,” measure what is feasible, and then highlight the limits of their study in reference to this big picture. The commencement of the study with an inclusive and transparent approach would provide an indication of the extent of costs accounted for, which in turn would facilitate interpretation of results.
While results suggest that families can incur a substantial cost burden, there exists great variability across studies in reported costs. We noted a lack of uniformity in data collection and research methods across studies. The variability in costs is likely due to the variety of methods employed from one study to the next. Specifically, not all studies measured severity or included information on how disabilities were categorized and severity determined. All but two studies failed to account for time biases in data collection. Only one study employed a method that would allow the researchers to capture recurring costs over time. As well, some studies collected data on net cost while others collected data on gross cost of caring for a child with a disability. For the most part, studies were limited by their period of observation, which was short, consisted of one-time data collections, and relied on recall. What is more, a limited number of studies provided details on how resources included were determined, nor did they provide a cost per resource consumed, and few provided a monetary value for time or forgone opportunities.
With the exception of one study, there was an absence of a threshold net cost or decision rule in terms of which one could judge whether the burden was acceptable or not. In the absence of a stated threshold (which is, of course, subjective), it is impossible to determine the acceptability of the burden—gross or net. However, the results from some of the studies seem to suggest that the burden is in some cases excessive, with costs exceeding 5% to up to 12% of families' incomes and with net costs of up to $8,000 a year.
Despite the aforementioned methodological limitations, it must be acknowledged that the quality of some of these studies has improved when compared to those reviewed by Jacobs and McDermott (1989).18 The most noticeable improvement was the inclusion of variations of cost-time profiles in four of the 17 studies reviewed and the adoption of a prospective research design in two of the studies. Explicit reporting of variations in costs profiles, especially as depicted in frequency distributions, are of particular significance to policy makers as it helps to identify target groups (e.g., age, severity, disability) in need of public assistance.18
The lack of studies examining the economic cost of caring for a child with a disability gives impetus for further research in this area. To help guide further research, it is suggested that researchers adopt a conceptual model. For example, the economic model described in this paper is comprehensive and may prove useful for future research as it draws attention to the different variables that may be considered in calculating financial burden. Ideally, subsequent research should employ an economic framework and adopt a prospective and cross-sectional research design to capture recurring costs over time, at different ages, and during different seasons. Efforts should be made to report on specific costs as opposed to global cost. A breakdown of where money is spent could be useful to policy makers. In the future, researchers should make the effort to systematically review the local policies in force that could potentially offset family costs. A prime example of such a review is demonstrated in the work by Dobson et al.24 In their study, the authors made the effort to compare cost to the maximum benefits available. The studies should be transparent to facilitate interpretation of research findings, generalization across studies, and policy implications.
There are several limits to this review. First, the review is limited in that it focused on studies of family-incurred costs related to caring for a child with a physical disability. This type of sample was selected in an attempt to report on the most homogeneous population possible. Studies that reported on costs of caring for a child with a chronic illness or other condition only, such as cancer, epilepsy, HIV, or arthritis, were excluded from this review. Second, while we set out to include children with a physical disability only, sometimes samples included children with other conditions; however, they usually made up a smaller portion of the sample than children with a physical disability.
In conclusion, this review of literature demonstrates that little research has been performed to reveal the magnitude of costs imposed on families as caregivers for children with disabilities. This observation has been highlighted by many authors interested in the costs incurred by these families.3,22,33,41–43 Because of the variability and quality of methods, the return on investment in knowledge of costs in this area is not as high as it could have been had methodological procedures been more standardized.
REFERENCES
- 1.Hanvey L. Children and youth with special needs. Summary report of findings. Ottawa: Canadian Council on Social Development (CCSD) 2001. [cited 2006 Sep 12]. Available from: URL: http://www.ccsd.ca/pubs/2001/specialneeds.pdf.
- 2.Statistics Canada. Children with disabilities and their families. Participation and activity limitation survey. 2001. Ottawa: Statistics Canada. 2003. [cited 2006 Sep 12]. Report No.: no 89-585-XIE. Available from: URL: http://www.statan.ca/francais/freepub/89-585-XIF2003001.pdf.
- 3.Hanvey L Children with disabilities and their families in Canada. A discussion paper commissioned by the National Children's Alliance for the First National Roundtable on Children with Disabilities. 2002. Nov, [cited 2006 Sep 12]. Available from: URL: http://www.nationalchildrensalliance.com/nca/pubbs/2002/hanvey02.pdf.
- 4.Roeher Institute. Beyond the limits. Mothers caring for children with disabilities. Children and Family Series. North York, Canada: Roeher Institute; 2000. pp. 1–40. [Google Scholar]
- 5.Eicher P, Batshaw M. Cerebral palsy. Pediatr Clin North Am. 1993;40:537–51. doi: 10.1016/s0031-3955(16)38549-2. [DOI] [PubMed] [Google Scholar]
- 6.Prince M. Governing in an integrated fashion: lessons from the disability domain. [cited 2006 Sep 12];Ottawa: Canadian Policy Research Networks. 2001 CPRN Discussion Paper F13, 1-119. Available from: URL: http://www.cprn.org/documents/3662_en.pdf.
- 7.Birenbaum A. Poverty, welfare reform, and disproportionate rates of disability among children. Ment Retard. 2002;40:212–8. doi: 10.1352/0047-6765(2002)040<0212:PWRADR>2.0.CO;2. [DOI] [PubMed] [Google Scholar]
- 8.Kuhlthau K, Hill KS, Yucel R, Perrin JM. Financial burden for families of children with special health care needs. Matern Child Health J. 2005;9:207–18. doi: 10.1007/s10995-005-4870-x. [DOI] [PubMed] [Google Scholar]
- 9.Fawcett G, Ciceri C, Tsoukalas S, Gibson-Kierstead A. Supports and services for adults and children aged 5–14 with disabilities in Canada. An analysis of data needs and gaps. Ottawa: Canadian Council on Social Development. 2004 [Google Scholar]
- 10.Beresford B. Expert opinions: a national survey of parents caring for a severely disabled child. Bristol: The Policy Press; 1995. [Google Scholar]
- 11.Irwin S, Lero D. Child care barriers to full workforce participation experienced by parents of children with special needs—and potential remedies. Wreck Cove (Nova Scotia): Breton Books; 1997. In our way. [Google Scholar]
- 12.Bumbalo J, Ustinich L, Ramcharran D, Schwalberg R. Economic impact on families caring for children with special health care needs in New Hampshire: the effect of socioeconomic and health-related factors. Matern Child Health J. 2005;9(2 Suppl):S3–11. doi: 10.1007/s10995-005-4350-3. [DOI] [PubMed] [Google Scholar]
- 13.Breslau N, Salkever D, Staruch K. Women's labor force activity and responsibilities for disabled dependents: a study of families with disabled children. J Health Soc Behav. 1982;23:169–83. [PubMed] [Google Scholar]
- 14.Thyen U, Kuhlthau K, Perrin JM. Employment, child care, and mental health of mothers caring for children assisted by technology. Pediatrics. 1999;103(6 Pt 1):1235–42. doi: 10.1542/peds.103.6.1235. [DOI] [PubMed] [Google Scholar]
- 15.Philip K, Backett-Milburn K, Cunningham-Burley S, Davis J. Practising what we preach? A practical approach to bringing research, policy and practice together in relation to children and health inequalities. Health Educ Res. 2003;18:568–79. doi: 10.1093/her/cyf038. [DOI] [PubMed] [Google Scholar]
- 16.Meyers M, Lukemeyer A, Smeeding T. The cost of caring: childhood disability and poor families. Soc Serv Rev. 1998 Jun;:209–33. [Google Scholar]
- 17.Dowling M, Dolan L. Families with children with disabilities—inequalities and social model. Disabil Soc. 2001;16:21–35. [Google Scholar]
- 18.Jacobs P, McDermott S. Family caregiver costs of chronically ill and handicapped children: method and literature review. Public Health Rep. 1989;104:158–63. [PMC free article] [PubMed] [Google Scholar]
- 19.Canadian Coordinating Office for Health Technology Assessment (CCOHTA). Canada: 1996. A guidance document for the costing process. Version 1.0. Jean-FranÇois Baladi, editor. Version 1.1. [Google Scholar]
- 20.Bank of Canada. Taux de change. [cited 2005 Jul 27]. Availiable from: URL: http://www.bankofcanada.ca/fr/taux/echange_avg_pdf-f.html.
- 21.Knoll J. Being a family: the experience of raising a child with a disability or chronic illness. In: Bradley V, Knoll J, Agosta J, editors. Emerging issues in family support. Washington: American Association of Mental Retardation; 1992. pp. 9–56. [PubMed] [Google Scholar]
- 22.Chartrand Beauregard J. Étude exploratoire sur les dépenses supplémentaires des familles en réponse aux besoins des enfants handicapés. Québec: Ministère de la santé et des services sociaux. 1999 [Google Scholar]
- 23.Davidoff AJ. Insurance for children with special health care needs: patterns of coverage and burden on families to provide adequate insurance. Pediatrics. 2004;114:394–403. doi: 10.1542/peds.114.2.394. [DOI] [PubMed] [Google Scholar]
- 24.Dobson B, Middleton S, Beardworth A. The impact of childhood disability on family life. York: Joseph Rowntree Foundation; 2001. [Google Scholar]
- 25.Dobson B, Middleton S. The cost of childhood disability. York: YPS for the Joseph Rowntree Foundation; 1998. Paying to care. [Google Scholar]
- 26.Lukemeyer A, Meyers M, Smeeding T. Expensive children in poor families: out-of-pocket expenditures for the care of disabled and chronically ill children in welfare families. J Marriage Fam. 2000;62:399–415. [Google Scholar]
- 27.Brust J, Leonard B, Sielaff B. Maternal time and the care of disabled children. Public Health Nurs. 1992;9:177–84. doi: 10.1111/j.1525-1446.1992.tb00097.x. [DOI] [PubMed] [Google Scholar]
- 28.Curran AL, Sharples PM, White C, Knapp M. Time costs of caring for children with severe disabilities compared with caring for children without disabilities. Dev Med Child Neurol. 2001;43:529–33. doi: 10.1017/s0012162201000962. [DOI] [PubMed] [Google Scholar]
- 29.Edebol-Tysk K. Evaluation of care-load for individuals with spastic tetraplegia. Dev Med Child Neurol. 1989;31:737–45. doi: 10.1111/j.1469-8749.1989.tb04069.x. [DOI] [PubMed] [Google Scholar]
- 30.Leonard B, Dwyer J, Sapienza J. Financial and time costs to parents of severely disabled children. Public Health Rep. 1992;107:302–12. [PMC free article] [PubMed] [Google Scholar]
- 31.Roberts K, Lawton D. Financial assistance for families with severely disabled children and transport costs. Child Soc. 1999;13:333–45. [Google Scholar]
- 32.Barnett S, Boyce G. Effects of children with Down syndrome on parents' activities. Am J Ment Retard. 1995;100:115–27. [PubMed] [Google Scholar]
- 33.Miller V, Rice J, DeVos M, Fos P. An analysis of program and family costs of case managed care for technology-dependent infants with bronchopulmonary dysplasia. J Pediatric Nurs. 1998;13(4):244–51. doi: 10.1016/s0882-5963(98)80051-1. [DOI] [PubMed] [Google Scholar]
- 34.Crowe TK. Time use of mothers with young children: the impact of a child's disability. Dev Med Child Neurol. 1993;35:621–30. doi: 10.1111/j.1469-8749.1993.tb11700.x. [DOI] [PubMed] [Google Scholar]
- 35.Hwang W, Weller W, Ireys H, Anderson G. Out-of-pocket medical spending for care of chronic conditions. Health Aff (Millwood) 2001;20(6):267–78. doi: 10.1377/hlthaff.20.6.267. [DOI] [PubMed] [Google Scholar]
- 36.Newacheck P, Inkelas M, Kim S. Health services use and health care expenditures for children with disabilities. Pediatrics. 2004;114:79–85. doi: 10.1542/peds.114.1.79. [DOI] [PubMed] [Google Scholar]
- 37.Middleton S, Ashworth K, Walker R. Family fortunes: pressure on parents and children in the 1990s. London: CPAG Ltd; 1994. [Google Scholar]
- 38.Middleton S, Ashworth K, Braithwaite I. Spending on children, childhood poverty and parental sacrifice. York: John Rowntree Foundation; 1997. Small fortunes. [Google Scholar]
- 39.Brust JD, Leonard B, Sielaff B. Maternal time and the care of disabled children. Public Health Nurs. 1992;9(3):177–84. doi: 10.1111/j.1525-1446.1992.tb00097.x. [DOI] [PubMed] [Google Scholar]
- 40.Myles J. Postponed adulthood. Dealing with the new economic inequality. Canadian Council on Social Development. 2005. [cited 2006 Sep 12]. Available from: URL: http://www.ccsd.ca/pubs/2005/pa/pa.pdf#s.
- 41.Tilford JM, Robbins JM, Hobbs CA. Improving estimates of caregiver time cost and family impact associated with birth defects. Teratology. 2001;64(Suppl 1):S37–S41. doi: 10.1002/tera.1097. [DOI] [PubMed] [Google Scholar]
- 42.Ward L. Supporting disabled children and their families. Child Soc. 1999;13:394–400. [Google Scholar]
- 43.Kirk S. Families' experiences of caring at home for a technology-dependent child: a review of the literature. Child Care Health and Dev. 1998;24:101–14. doi: 10.1046/j.1365-2214.1998.00043.x. [DOI] [PubMed] [Google Scholar]


