Abstract
Although immunological memory is characterized by both an increase in the frequency of antigen-specific T cells and a qualitative change in the pattern of their subsequent response, it is not clear which of these components is more significant in the overall enhanced response to secondary stimulation. To address this question for the CD4+ T-cell response, T-cell receptor (TCR) Tg T cells were adoptively transferred to normal syngeneic mice that were immunized with the relevant peptide. After the initial expansion of TCR Tg T cells, the size of the subsequent memory population of T cells was approximately the same as the size of the starting population, independent of the number of TCR Tg cells initially transferred. This result was not caused by redistribution of memory cells into non-lymphoid tissues, although the relative frequency of antigen-specific T cells in these sites was increased after immunization. The fraction of the antigen specific TCR Tg cells that responded by production of either interleukin-2 or interferon-γ in vitro was substantially higher after immunization. Thus, the increased frequency of functionally responsive T cells was primarily caused by a higher fraction of responding T cells, rather than a substantial increase in the absolute number of antigen specific CD4+ TCR Tg T cells.
Keywords: CD4+, immunological memory, antigen specific cell frequency
Introduction
Understanding the mechanisms operative in the development of T-cell memory is a central goal in the development of effective vaccination strategies for both infectious diseases and other clinically relevant immune responses. A key measure of an effective immunization is the demonstration of an increased frequency of antigen-specific T cells in the population, following the conceptual scheme of the clonal selection theme first articulated almost 50 years ago.1 The clonal selection theory combines two simple ideas – that individual lymphocytes possess a single antigenic specificity and changes in the frequency of such cells within a population is driven by antigen – and provides a symmetrical mechanism that accounts for both memory by an increased number of cells and tolerance by a decreased number of cells. Despite many refinements in our understanding of lymphocyte biology, this concept remains a central feature of our approach to experimentally measuring the effectiveness of a particular immunization. The conventional approach was to measure the precursor frequency of cells that could mediate a particular functional activity by limiting dilution analysis and assume that this frequency corresponded to the physical number of antigen-specific cells.2–6 More recently, the frequency of T cells that produce cytokines immediately after in vitro antigen stimulation has been taken as a surrogate for T-cell memory. This measure obviates the requirement for substantial growth of the precursor cells in order to experimentally detect the functional response. Both of these approaches make the fundamental assumption that all of the antigen-specific cells functionally respond when exposed to antigen in the particular assay system used.
The advent of tetramers of major histocompatibility complex (MHC) molecules with a specific peptide was a significant advancement, that allows the direct physical measurement of cells that bind a particular peptide/MHC (pMHC) epitope, independent of the functional capacity of these cells.7,8 Because of the greater stability of pMHC class I tetramers, most of the systems analysed with this approach have been CD8 T-cell responses,9–11 although some pMHCII tetramers have more recently been developed.12 However, analysis of CD4 T-cell responses by using an alternative approach focusing on T-cell receptor (TCR) transgenic T cells has demonstrated substantial heterogeneity in the functional cytokine responses, even within a population of T cells with exactly the same clonal TCR sequence.13,14 Similar results have been found with influenza-specific clones of CD4+ T cells obtained from the periphery of normal mice.15 While pMHC tetramer binding allows the analysis of normal (non-transgenic) T cells, the avidity threshold for tetramer binding is not necessarily the same as that required for a particular functional response.
Another issue which complicates the rigorous measurement of the number of memory cells present in an organism is the altered recirculation pathways of memory cells compared to naive cells.16–18 T-cell activation leads to altered chemokine receptor expression and differential trafficking of naïve, effector, and memory cells through various tissue compartments.19 The situation is further complicated by the existence of effector and central memory T cells which have distinct recirculation patterns.20 The relative enrichment of both CD421 and CD822 memory cells in non-lymphoid tissues has been well documented, but this analysis has not been coupled with a precise measurement of the absolute number of T cells present in naïve and memory situations. Thus the question remains: to what degree does an increase in the frequency of a single clonotype of antigen-specific CD4+ T cell contribute to immunological memory?
To address this question we have employed the DO11.10 adoptive transfer system23 to measure the expansion and contraction of CD4+ T cells following immunization of the adoptive transfer recipient mice. In this system, antigen-specific TCR transgenic cells are detected with the KJ1.26 monoclonal antibody (mAb) KJ1.26, which recognizes the DO11.10 ovalbumin (OVA)p-specific, transgenic TCR.24 Using a combination of flow cytometry and immunohistochemistry, we have measured the number of T cells present in adoptive transfer recipient mice immediately before immunization and 30 days following immunization. Our data show that the fraction of KJ1.26+ TCR Tg cells that expressed cytokines after peptide restimulation was substantially higher within the memory pool, suggesting that an altered quality of response is a more critical feature of memory among CD4 T cells than a physical increase in numbers of antigen specific cells.
Materials and methods
Mice
The DO11.10 transgenic TCR mice were the kind gift of Dr Dennis Loh. DO11.10 mice and BABL/cByJ mice (The Jackson Laboratory, Bar Harbor, ME) were bred in our facility in accordance with NIH regulations.
Flow cytometry
Cell surface staining was performed by standard procedures. KJ1.26 mAb was purified and conjugated to FITC by Southern Biotechnology Associates (Birmingham, AL). KJ1.26PE and F4/80PE were purchased from Caltag (Burlingame, CA). All other antibodies were purchased from BD-Pharmingen (San Diego, CA). Splenocytes or lymph node cells were incubated with KJ1.26FITC specific for the transgenic TCR clonotype and PE-Cy5 conjugated anti-CD4 (RM4-5). For large list mode acquisitions, only F4/80 negative cells were analysed to exclude CD4lo non-T cells and autofluorescent cells for a precise enumeration of very rare CD4+ KJ1.26 + T cells. For analysis of activation and memory marker expression, cells were incubated with KJ1.26FITC, CD4APC, F4/80PE and biotin conjugated α-CD25 (7D4), α-CD45RB (16A), α-CD62L (MEL-14), or α-CD122 (TM-β1). Biotin-labelled primary mAbs were developed with streptavidin-conjugated Red670 (Invitrogen, Carlsbad, CA). Flow cytometry was performed on either a Becton Dickinson FACScan or FACScalibur and analysed with CellQuest software on list mode acquisitions of up to 1·5 × 106 lymphocytes based on forward and side-scatter.
Adoptive transfer and immunization
Pooled DO11.10 splenocytes and lymph node cells were analysed by flow cytometry to determine the percentage of CD4+ KJ1.26+ cells in the population. An appropriate number of cells sufficient to achieve 0·04 × 106, 1 × 10⁶, or 25 × 106 were injected into the tail veins of recipient mice in a final volume of 0·5 ml phosphate-buffered saline (PBS). For analysis of cell division, 5 × 10⁶ cells per ml were incubated in 5 µm 5-(and-6)-carboxyfluorescein diacetate, succinimidyl ester (CFSE, Molecular Probes, Eugene, OR) for 8 min at 37°. Labelling was quenched by the addition of newborn calf serum and the cells were washed twice in serum-free PBS before transfer into recipient mice. One to 3 days following cell transfer, recipient mice were killed or immunized with 100 µg OVA323−339 in 100 µl of a multiple emulsion (ME) adjuvant (Pluronic F-127, squalene, Span 80, Tween-80, and Triton-X-100 purchased from Sigma (St. Louis, MO), adapted from the methods of Tomasi et al.25 When compared with complete Freund's adjuvant (CFA), ME adjuvant generated higher responses of DO11.10 CD4+ T cells as measured by both induction of interleukin-2 (IL-2) expression in the primary response and expansion of antigen specific cell numbers (unpublished observations). Fifty µl of adjuvant was injected intraperitoneally (i.p.), 25 µl subcutaneously (s.c.) at the base of the tail, and 25 µl s.c. at the scruff of the neck.
Quantification of antigen-specific T cells
Mice were killed without immunization (day 0) or 5, 10, or 30 days after immunization. On the day of sacrifice, lymph nodes and spleens were harvested from the recipient mice. Half of each compartment was placed in an OCT block and snap frozen in liquid nitrogen. The remaining half was teased into suspension and counted in a haemocytometer. Cells were analysed by flow cytometry to determine the percentage of CD4+ and KJ+ cells present. For immunohistochemistry, 4 µm thick sections were cut from the frozen tissue blocks and immediately dried in acetone. Sections were next incubated in fluoroscein isothiocyanate (FITC)-labelled KJ1.26 at room temperature and subsequently with horseradish peroxidase conjugated anti-FITC antibody (Vector Laboratories, Burlingame, CA). For anti-CD4+ staining, cells were incubated in purified anti-CD4 antibody (H129.19 from BD Pharmingen) followed by a biotin-labelled anti-rat immunoglobulin G (IgG) antibody, and ABC (Dako, Carpentaria, CA). Bound antibody was detected by precipitation of 3,3′-diaminobenzidine (Dako), a substrate of horseradish peroxidase. Sections were counterstained with methyl green, and positive cells were quantified with bright field microscopy and direct counting. Tissue area was measured by grid point counting.
To measure the number of KJ1.26+ cells present in non-lymphoid compartments, each organ was weighed at the time of death and the number of KJ1.26+ cells per mm2 of tissue (4 µm thick sections) was calculated in a given mass of tissue assuming a density of 1 g/ml. For the lamina propria, the length of the small intestine and the contribution of the lamina propria to the cross-sectional area of the small intestine were measured. After determining these two values, the number of KJ1.26+ cells present in the entire lamina propria was calculated using the same technique as used for the non-lymphoid compartments. The number of KJ1.26+ cells present in Peyer's patches was calculated by finding the ratio of KJ1.26+ cells to all CD4+ cells by immunohistochemistry, and the number of CD4+ cells per average Peyer's patch was measured by flow cytometry. Observations were made to detect KJ1.26+ populations in several other tissues including salivary gland, kidney, heart and smooth muscle. Extremely rare positive events were present in these tissues, but we calculated the combined populations of these compartments to be less than 300 cells per mouse and thus not a significant contribution to the whole body population of over 2 × 10⁵ KJ1.26+ cells.
Detection of cytokine producing cells in vitro
Splenocytes from adoptive transfer recipient mice that received 4 × 10⁶ CD4+ KJ1.26+ cells were plated at 3 × 10⁶ cells per well in a 48-well plate and stimulated for 5 hr in RPMI-1640 complete media (10% fetal calf serum, FCS). GolgiPlug was added to the wells for the final 2·5 hr of stimulation. Cells were then stained with KJ1.26PE (Caltag) and a cocktail of biotinylated antibodies, F4/80 (Caltag), PK136, 1D3, and SF1-1.1 (BD-Pharmingen) to exclude macrophages, natural killer (NK) cells, B cells, and all MHCII expressing cells, respectively. Biotinylated antibodies were developed with streptavidin-conjugated Red670 (Invitrogen) and CD4-expressing cells were detected with allophycocyanin (APC)-conjugated RM4-5 (BD-Pharmingen). Cytokine staining was performed with JES6-5H4FITC to detect IL-2-producing cells and XMG1·2FITC to detect interferon-γ (IFN-γ) producing cells using the Cytofix-Cytoperm system from BD-Pharmingen according to the manufacturer's instructions.
Results
In vivo expansion and contraction of antigen specific CD4+ T cells
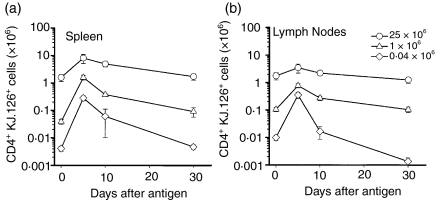
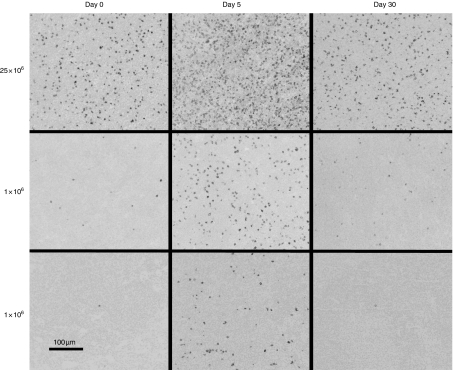
To determine the effect of initial antigen-specific cell frequency on T-cell population dynamics following exposure to antigen, various numbers of CD4+ KJ1.26+ T cells from DO11.10 donor mice were adoptively transferred into normal BALB/c recipient mice. Immunization with OVAp triggered clonal expansion in all recipients. In each case, the antigen specific populations present in the lymph nodes (Fig. 1a) and spleen (Fig. 1b) expanded by day 5 and then began a contraction phase until the last time point at day 30. For each cell dose, the number of antigen-specific cells remaining on day 30 was approximately the same as the starting population (Fig. 1a, b). However, a striking inverse relationship exists between the initial cell dose and the extent of cellular expansion. The 25 × 106 cell dose expanded only two- to fivefold, while the 0·04 × 106 and 1 × 10⁶ cell doses expanded by about 40- and 70-fold, respectively. Likewise, the expansion and contraction of each dose of KJ1.26+ cells was observed in histologically stained lymph nodes, spleen and multiple other tissues (Fig. 2). CD4+ KJ1.26+ cells did not expand in recipients after immunization with keyhole limpet haemocyanin (data not shown).
Figure 1.
Expansion and contraction of adoptively transferred CD4+KJ1.26+ cell populations in recipient BALB/c ByJ mice as measured by flow cytometry in (a) spleen and (b) lymph nodes. Cell transfers were performed on day −2 and mice were killed on day 0 (unimmunized) and on days 5, 10, and 30 following immunization with 100 µg of OVA peptide in adjuvant. Circles – 25 × 106 cell dose; triangles – 1 × 10⁶; diamonds – 0·04 × 106. Error bars indicate the standard error of the mean.
Figure 2.
Photomicrograph of lymph node sections stained with KJ1.26 on days 0, 5, and 30 following immunization. Mice received 0·04 × 106, 1 × 10⁶ or 25 × 106 CD4+ KJ1.26+ cells. Equivalent expansion and contraction of the numbers of KJ1.26+ cells per square millimetre was observed in the spleen.
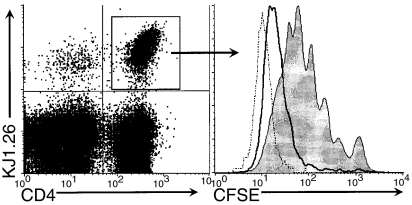
To further characterize the in vivo expansion of the KJ+ populations following immunization with OVAp, CFSE-labelled DO11.10 cells were transferred into normal BALB/c mice. In agreement with the increases in absolute cell numbers, smaller starting populations of CD4+ KJ1.26+ cells underwent more cell cycles of division than larger starting populations by day 3 (Fig. 3). Analysis of CSFE dilution was also performed at day 2 and day 5 and showed similar results, but by day 5 the dilution of CSFE were indistinguishable from autofluorescence thereby obscuring the differences between the different initial cell doses (data not shown). CD4+ KJ1.26+ cells from unimmunized control mice did not proliferate (data not shown).
Figure 3.
CFSE dilution profiles of CD4+ KJ1.26 + lymphocytes from the spleen on day 3 following immunization. 25 × 106– grey fill; 1 × 10⁶– solid line; 0·04 × 106– dotted line.
Activation and memory marker expression by KJ+ cells
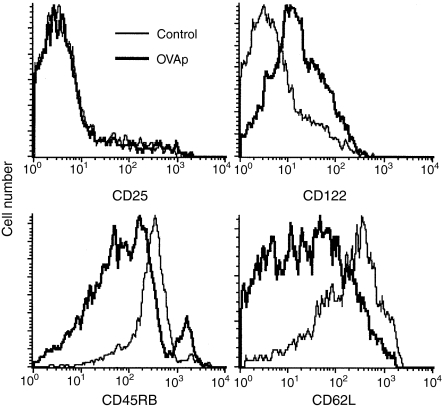
Decreased expression of CD45RB and of CD62L are commonly used to distinguish antigen experienced from naïve cells. Expression of four activation/memory markers by memory and control immunized cells were examined on day 30 (Fig. 4). Expression of CD25, the IL-2Rα subunit, was up-regulated on day 1 after immunization (data not shown), but returned to control levels by day 30. Expression of CD122, the IL-2Rβ subunit, was also increased soon after immunization (data not shown) but was expressed at elevated levels through day 30 compared to cells from mice immunized with control antigen. As expected, KJ1.26+ cells from mice immunized with OVAp showed reduced expression of CD45RB and CD62L. Similar results were found in spleen cells.
Figure 4.
Comparison of activation and memory marker expression by CD4+ KJ1.26+ lymph node cells from OVAp immunized (thick line) and KLH control immunized (thin line) mice 30 days following immunization. Modulation of activation and memory marker expression by CD4+ KJ1.26+ splenocytes was equivalent.
Antigen-specific CD4+ T cells in non-lymphoid tissues
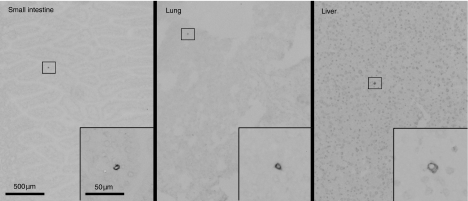
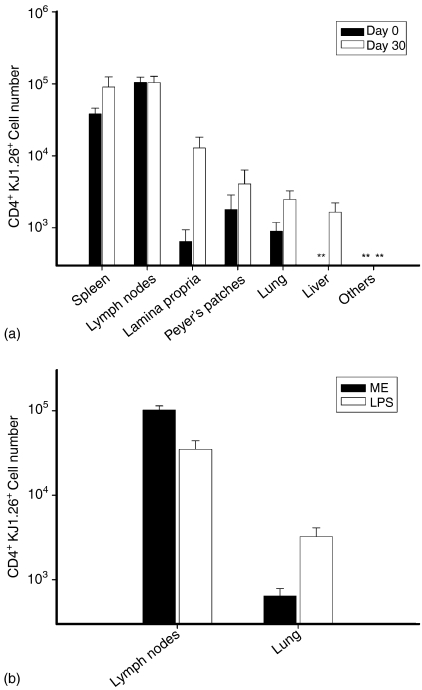
The contraction of activated antigen-specific cell populations results mostly from activation-induced cell death,26 but redistribution into other compartments may contribute to the disappearance of TCR Tg cells from the spleen and lymph nodes. To quantify redistribution into other compartments 30 days after immunization, we used an immunohistochemistry technique with accuracy equal to flow cytometry.27 Immunostained objects that were counted as KJ1.26+ cells by confirmation of cell membrane ‘rim’ staining without stained intracellular granules by high magnification observation (Fig. 5), while bits of debris that can simulate positive staining when observed from low magnification were excluded. The number of KJ+ cells present in the lamina propria of the small intestine, Peyer's patches, lung, liver, salivary gland, heart, kidney and skeletal muscle was measured on days 0 and 30 in mice that received 1 × 10⁶ KJ1.26+ cells (Fig. 6a). Although the fraction of the total CD4 T cells that coexpressed KJ1.26 was significantly increased in the non-lymphoid compartments (Fig. 6a), the vast majority of KJ1.26+ cells present in the mouse resided in the lymphoid compartment.
Figure 5.
Photomicrograph showing KJ1.26+ cells in the small intestine, lung and liver in mice which received 1 × 10⁶ CD4+ KJ1.26+ cells.
Figure 6.
(a) KJ1.26+ cell numbers in spleen, lymph nodes, small intestine, Peyer's patches, lung, liver, and combined other compartments (salivary gland, kidney, heart, and skeletal muscle) on day 0 without immunization (black) and day 30 following immunization (unfilled). Asterisks indicate total populations sizes below the limit of detection for the respective compartment. Results are from four mice on day 0 and five mice on day 30. Adoptive transfer mice received 1 × 10⁶ CD4+ KJ1.26+ cells. (b) KJ1.26+ cell number in the lymph nodes and lungs of adoptive transfer recipient mice that were immunized with OVAp in ME adjuvant or with OVAp in LPS. Results are from three mice for each condition.
The above result contrasts with that reported by Reinhardt et al. which showed net redistribution of antigen specific T cells from the lymph nodes to the non-lymphoid tissues 30 days following immunization with OVAp and lipopolysaccharide (LPS) which were injected intravenously (i.v.) into the adoptive transfer recipient mice. Thus, we compared the effect of immunization route and adjuvant on antigen specific cell distribution 30 days after immunization in adoptive transfer recipient mice, which received 3 × 10⁶ CD4+ KJ1.26+ cells (Fig. 6b). These results showed that i.v. immunization using LPS as an adjuvant resulted in only one-third as many CD4+ KJ1.26+ T cells remaining in the lymph nodes compartment as compared to mice which were immunized s.c. and i.p. with multiple emulsion adjuvant. Additionally, OVAp + LPS immunized mice showed a fivefold increase in the number of KJ1.26+ cells found in the lungs 30 days following immunization. No significant difference was found in cell numbers in other compartments. However, the basic result that the majority of the CD4+ TCR Tg cells in the entire animal 30 days after immunization reside in the spleen and lymph nodes, was not altered by this alternative form of antigen delivery.
Functional differences in memory and naïve cells
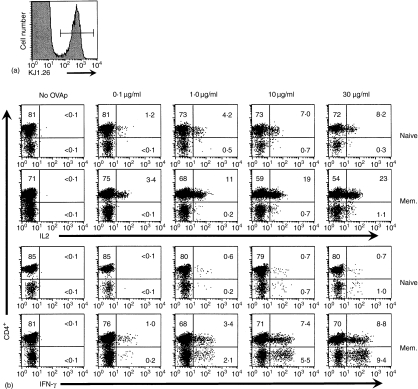
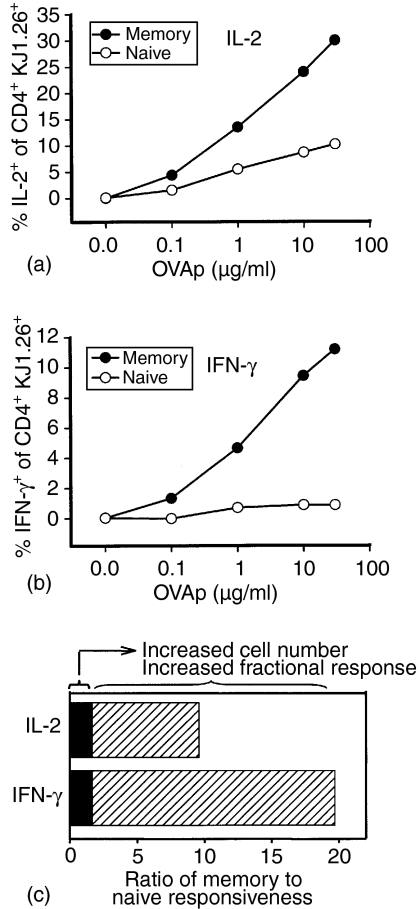
To determine whether the quality of the secondary response of these memory CD4+ T cells was altered, despite the minor change in total cell number, production of both IL-2 and IFN-γ after in vitro stimulation was measured by intracellular cytokine staining. At the time of death, 35 days after immunization, the KJ1.26+ T cells comprised approximately 1% of the splenic CD4+ population (Fig. 7a). Upon restimulation in vitro, a greater fraction of the antigen-specific cell population from adoptive transfer recipient mice previously immunized with OVAp produced IL-2 and IFN-γ than did populations containing similar frequencies of naïve DO11.10 cells at all doses of antigen tested (Fig. 7b). Approximately 30% of the memory CD4+ KJ1.26+ population produced IL-2 compared with only 10% of the naïve CD4+ KJ1.26+ population after stimulation with 30 µg/ml OVAp (Fig. 8a). The fraction of antigen-specific cells producing IFN-γ at this antigen dose (11% positive) was also substantially higher in the memory population compared to 0·9% positive in the naïve population (Fig. 8b). Thus, the number of OVA323−339 responsive cells was substantially increased within the memory population but this increase is caused by a higher fraction of the clonotype positive cells making a functional response, not an increase in the actual number of antigen-specific cells. Although immunization may have activated some non-TCR Tg cells in these adoptively transferred mice, about 90% of the total cytokine expressing cells measured by intracellular staining were KJ1.26+, indicating that the TCR Tg population comprises the bulk of the OVA323−339 peptide response in this experimental model (data not shown). A small fraction of the KJ1.26+ cells express CD8 rather than CD4 and they produce IFN-γ at higher levels than the CD4+ cells. Selection of TCR Tg T cells that recognize their specific antigen across MHC restriction barriers and thus develop as either CD4+ or CD8+ T cells has been previously reported.28 The increased fractional response of antigen-specific CD4+ T cells contributes more to the heightened memory response than does the increase in numbers of antigen specific cells (Fig. 8c).
Figure 7.
Enhanced functional response in memory cells compared to naïve cells in adoptive transfer recipient mice that received 4 × 10⁶ CD4+ KJ1.26+ cells. (a) KJ1.26+ cells composed approximately 1% of the total splenic CD4+ lymphocyte population. (b) Intracellular IFN-γ and IL-2 production by KJ+ CD4+ and KJ+ CD4– splenocytes from OVAp-immunized adoptive transfer recipient mice and unimmunized control mice following five hr in vitro stimulations. Plots are gated on the KJ1.26+ population.
Figure 8.
The percentage of CD4+ KJ1.26+ cells which produce IL-2 (a) and IFN-γ (b) following in vitro stimulation with OVAp is greater in memory populations (hatched) than in populations of naïve cells (black fill). Relative contributions of increased cell number and increased fractional response to the ratio of memory to naïve responsiveness (c).
Discussion
An increase in the number of antigen-specific cells has conventionally been regarded as a key component of the increased intensity of secondary immune responses. This measure has been widely applied in vaccine studies, in which the number of cells capable of responding to a specific antigen as judged by a given assay during a recall challenge was measured rather than physical identification of cells with identical TCR sequences. The relative contribution of increased precursor frequency compared to the enhanced fractional response within a clonotype is unknown. Our results indicate that net increases in the absolute number of antigen-specific CD4+ T cells is relatively modest compared to the more substantial enhanced fractional response and dose sensitivity which are characteristic of memory populations.
Our data show that regardless of the initial size of the adoptively transferred cell population, the respective populations at 0 and 30 days in the lymphoid compartments are approximately the same size. Kearney et al. saw similar expansion and contraction when they first transferred a single dose of CD4+ TCR Tg cells into recipient.23 When the adoptive transfer results in a supra-physiological frequency, the final population size might be determined by a limitation in the total size of a particular specificity. However, the result that the final population of memory cells is roughly equivalent to the stating cell number over a wide range of initial frequencies, suggests that some property inherent to the individual T cell governs the final population size. At the lowest transfer dose examined, the precursor frequency prior to antigen exposure is about 1 in 10 000 CD4 T cells, not radically higher than previous estimates of the frequency of naïve CD4 T cells in non-TCR Tg mice2–6 suggesting that the substantial decline in numbers between day 5 and 10 is relatively independent of the initial precursor frequency even at quite low initial frequencies. The contraction of antigen-stimulated CD4+ populations to approximately the starting size contrasts with the well demonstrated biology of CD8+ cells, which expand and subsequently contract to a population size that may be many fold larger than the naïve population.29–31
Interestingly, the behaviour of activated cells is more affected by total population size than the behaviour of resting cells. During the several days following immunization, the adoptive transfer cell populations proliferate in response to antigen regardless of their initial population size, but the highest transferred cell dose expanded approximately fivefold in the spleen and twofold in the lymph nodes while the 0·04 × 106 transfer population expands 73-fold in the spleen and 37-fold in the lymph nodes. The blunted response in mice that received 25 × 106 CD4+ KJ1.26+ cells likely results from the high frequency of antigen-specific cells and the consequent competition for limited resources necessary for antigen-specific population expansion. These results support previously published findings showing that labelled TCR Tg populations transferred into TCR Tg recipient mice compete for resources available in the host animal32 and that intraclonal competition can suppress the number of antigen-specific cells that produce IL-2 following immunization.33 Additionally, we noted that the magnitude of change in activation marker expression by the largest transfer cell dose was also less than the change in activation marker expression shown by the smaller transfer doses (data not shown). There was a decrease in the frequency of TCR Tg T cells in the lymph node (but not the spleen) at day 30 in the group that received the lowest number of transferred T cells (Fig. 1), perhaps because of the relative redistribution into peripheral tissues and decreased trafficking into the lymph node via CD62L mediated interaction with high endothelial venules.
Another novel observation reported here concerns the pattern of re-circulation of the memory T cells between lymphoid and non-lymphoid tissues. Although the fraction KJ1.26+ OVA-specific CD4+ cells increased after immunization, the majority of the memory cells were found in the lymphoid tissues. Previous reports have shown conflicting results on this point. Schiemann et al.31 quantified the number of antigen responsive CD4+ and CD8+ cells in lymphoid and non-lymphoid compartments 35 days after recall infection with Listeria and reported that the decline in the number of antigen-specific cells in the lymphoid tissues was not the result of net redistribution into non-lymphoid compartments. By contrast, Masopust et al. found that memory CD8 T cells preferentially localize in non-lymphoid tissues, using a VSV model system to study CD8 T cell memory.22 However, they looked only at the percentage of the CD8+ population that was tetramer positive rather than measuring the absolute number of cells present in each compartment. Enrichment of CD8+ memory cells in these locations occurs, but this result does not indicate large scale redistribution of bulk numbers of cells into these tissues. Reinhardt reported net redistribution of the antigen specific CD4+ population into non-lymphoid compartments.21 They obtained this result by quantifying the number of TCR transgenic (OT-II) cells that express Thy1.1 present in single mid-line sections of an entire mouse. This single section samples many tissues simultaneously, but may not accurately reflect the relative abundance of all body compartments, particularly the regional lymph nodes which are not present in a single midline section. The analysis reported here involves analysis of all body compartments with direct measurement of the mass and volume of each tissue by conventional techniques, rather than a single plane of section. Our results showed some redistribution of memory cells into non-lymphoid tissues, but we found 93% of the antigen specific CD4+ cells remained in secondary lymphoid tissues 30 days following immunization. It is likely that this relative enrichment of memory CD4+ cells in non-lymphoid peripheral tissues corresponds to a greater rate of recirculation through these compartments. These memory cells can gain access to the regional lymph nodes via drainage in the afferent lymph, and not merely through immigration directly from blood via the high endothelial venules.34 Precise measurement of the rates at which T cells recirculate through different compartments has not been performed, but the profound T-cell depletion associated with thoracic duct drainage and short residence time of T cells in blood35,36 strongly suggest that these rates are quite rapid. Thus, the localization of T cells in different compartments most likely reflects a highly dynamic equilibrium of recirculation patterns rather than a static localization of T cells in these sites.
It has long been assumed, that the enhanced functional response of a T-cell population after a primary response is primarily caused by an increase in the frequency of the antigen specific subset of cells. The underlying rationale for this concept is that all of the antigen specific cells mediate functional activity, such as cytokine production, when stimulated with adequate amounts of the specific antigen in vitro. However, the activation of cytokine expression by individual T cells is far from uniform, even within clonal populations.13,14 Because the fraction of antigen-specific CD4 T cells that produce cytokine with optimal stimulation is actually fairly low in naïve cells, a higher functional response could be due to either an increase in number of antigen specific cells or to a higher probability of response for each individual cell. In the experimental system examined here, the frequency of CD4+ T cells that produce IFN-γ is increased by about 25-fold in the memory population of cells compared to the naïve cells. A relatively small proportion of this increase (about twofold) was caused by the increase in the physical number of antigen-specific KJ1.26+ cells, while each KJ1.26+ cell was about 12 times more likely to produce this cytokine with optimal in vitro stimulation (Fig. 8). Figure 8 shows the ratio of memory cells which produce IL-2 and IFN-γ following in vitro stimulation compared to naïve cells. As the actual frequency of antigen specific T cells can be determined directly by KJ1.26 mAb staining, the significant increase in the frequency of functionally active antigen-specific T cells is revealed to be primarily associated with an increased responsiveness of individual T cells. Determination of cellular frequencies based only on antigen-activated functional activity would significantly over-estimate the population expansion within the memory pool driven by the primary immunization. The memory cells show about a 10-fold increase in the sensitivity to antigen dose for functional activation (Fig. 7), while the increase in physical cell number is approximately twofold. In the physiological context of immunity to an infectious agent, the increased sensitivity to low amounts of antigen would result in a greater magnitude of effector response at lower organism load, associated with an earlier time point after infection and growth of the infectious agent. Because the CD4 T-cell response most likely functions to initiate and control responses of several effector modalities, the increased antigen sensitivity, kinetics of cytokine expression, and fractional response per cell with an identical TCR all contribute to rapid clearance of an incipient infection before pathological consequences develop.
Because the functional phenomenon of antigen specific memory in the CD4 T-cell population can result primarily from changes in the quality of the response, the assessment of CD4 T-cell function in vitro in various clinical conditions should also focus on the quality of the response. Measures such as a change in the pattern of cytokine expression and shifts in the sensitivity to peptide stimulation may be more relevant in some circumstances than direct frequency measurements.
Acknowledgments
Supported by HL50924 and T32A107051. We gratefully acknowledge Dr Maurizio Tomasi for providing the formulation for multiple emulsion adjuvant. We thank Dr Kazuhito Honjo and Carlos A. Garcia for critical comments and suggestions and Drs Judith Kapp, Shiqian Shen, and Casey T. Weaver for helpful discussions and review of the manuscript.
References
- 1.Burnet FM. A modification of Jerne's theory of antibody production using the concept of clonal selection. Aust J Exp Biol Med Sci. 1957;20:67–9. doi: 10.3322/canjclin.26.2.119. [DOI] [PubMed] [Google Scholar]
- 2.Topham DJ, Doherty PC. Longitudinal analysis of the acute Sendai virus-specific CD4+ T cell response and memory. J Immunol. 1998;161:4530–5. [PubMed] [Google Scholar]
- 3.Gebel HM, Scott JR, Parvin CA, Rodey GE. In vitro immunization to KLH. II. Limiting dilution analysis of antigen-reactive cells in primary and secondary culture. J Immunol. 1983;130:29–32. [PubMed] [Google Scholar]
- 4.Powers GD, Abbas AK, Miller RA. Frequencies of IL-2- and IL-4-secreting T cells in naive and antigen-stimulated lymphocyte populations. J Immunol. 1988;140:3352–7. [PubMed] [Google Scholar]
- 5.Ewing C, Topham DJ, Doherty PC. Prevalence and activation phenotype of Sendai virus-specific CD4+ T cells. Virology. 1995;210:179–85. doi: 10.1006/viro.1995.1329. [DOI] [PubMed] [Google Scholar]
- 6.Burton RC, Fortin JL, Russell PS. T cell responses to alloantigens. I. Studies of in vivo and in vitro immunologic memory and suppression by limit dilution analysis. J Immunol. 1980;124:2936–43. [PubMed] [Google Scholar]
- 7.Altman JD, Moss PA, Goulder PJ, et al. Phenotypic analysis of antigen-specific T lymphocytes. Science. 1996;274:94–6. [PubMed] [Google Scholar]
- 8.Crawford F, Kozono H, White J, Marrack P, Kappler J. Detection of antigen-specific T cells with multivalent soluble class II MHC covalent peptide complexes. Immunity. 1998;8:675–82. doi: 10.1016/s1074-7613(00)80572-5. [DOI] [PubMed] [Google Scholar]
- 9.Murali-Krishna K, Altman JD, Suresh M, et al. Counting antigen-specific CD8 T cells: a reevaluation of bystander activation during viral infection. Immunity. 1998;8:177–87. doi: 10.1016/s1074-7613(00)80470-7. [DOI] [PubMed] [Google Scholar]
- 10.Appay V, Rowland-Jones SL. The assessment of antigen-specific CD8+ T cells through the combination of MHC class I tetramer and intracellular staining. J Immunol Methods. 2002;268:9–19. doi: 10.1016/s0022-1759(02)00195-3. [DOI] [PubMed] [Google Scholar]
- 11.Doherty PC, Christensen JP. Accessing complexity. the dynamics of virus-specific T cell responses. Annu Rev Immunol. 2000;18:561–92. doi: 10.1146/annurev.immunol.18.1.561. [DOI] [PubMed] [Google Scholar]
- 12.Cameron TO, Norris PJ, Patel A, et al. Labeling antigen-specific CD4 (+) T cells with class II MHC oligomers. J Immunol Methods. 2002;268:51–69. doi: 10.1016/s0022-1759(02)00200-4. [DOI] [PubMed] [Google Scholar]
- 13.Bucy RP, Panoskaltsis-Mortari A, Huang GQ, et al. Heterogeneity of single cell cytokine gene expression in clonal T cell populations. J Exp Med. 1994;180:1251–62. doi: 10.1084/jem.180.4.1251. [DOI] [PMC free article] [PubMed] [Google Scholar]
- 14.Weaver CT, Saparov A, Kraus LA, Rogers WO, Hockett RD, Bucy RP. Heterogeneity in the clonal T cell response. Implications for models of T cell activation and cytokine phenotype development. Immunol Res. 1998;17:279–302. doi: 10.1007/BF02786452. [DOI] [PubMed] [Google Scholar]
- 15.Graham CM, Smith CA, Thomas DB. Novel diversity in Th1, Th2 type differentiation of hemagglutinin-specific T cell clones elicited by natural influenza virus infection in three major haplotypes (H-2b,d,k) J Immunol. 1998;161:1094–103. [PubMed] [Google Scholar]
- 16.Mackay CR, Marston WL, Dudler L, Spertini O, Tedder TF, Hein WR. Tissue-specific migration pathways by phenotypically distinct subpopulations of memory T cells. Eur J Immunol. 1992;22:887–95. doi: 10.1002/eji.1830220402. [DOI] [PubMed] [Google Scholar]
- 17.Mackay CR. Migration pathways and immunologic memory among T lymphocytes. Semin Immunol. 1992;4:51–8. [PubMed] [Google Scholar]
- 18.Mackay CR, Marston W, Dudler L. Altered patterns of T cell migration through lymph nodes and skin following antigen challenge. Eur J Immunol. 1992;22:2205–10. doi: 10.1002/eji.1830220904. [DOI] [PubMed] [Google Scholar]
- 19.Weninger W, Manjunath N, von Andrian UH. Migration and differentiation of CD8+ T cells. Immunol Rev. 2002;186:221–33. doi: 10.1034/j.1600-065x.2002.18618.x. [DOI] [PubMed] [Google Scholar]
- 20.Sallusto F, Geginat J, Lanzavecchia A. Central memory and effector memory T cell subsets. Function, generation, maintenance. Annu Rev Immunol. 2004;22:745–63. doi: 10.1146/annurev.immunol.22.012703.104702. [DOI] [PubMed] [Google Scholar]
- 21.Reinhardt RL, Khoruts A, Merica R, Zell T, Jenkins MK. Visualizing the generation of memory CD4 T cells in the whole body. Nature. 2001;410:101–5. doi: 10.1038/35065111. [DOI] [PubMed] [Google Scholar]
- 22.Masopust D, Vezys V, Marzo AL, Lefrancois L. Preferential localization of effector memory cells in nonlymphoid tissue. Science. 2001;291:2413–7. doi: 10.1126/science.1058867. [DOI] [PubMed] [Google Scholar]
- 23.Kearney ER, Pape KA, Loh DY, Jenkins MK. Visualization of peptide-specific T cell immunity and peripheral tolerance induction in vivo. Immunity. 1994;1:327–39. doi: 10.1016/1074-7613(94)90084-1. [DOI] [PubMed] [Google Scholar]
- 24.Haskins K, Kubo R, White J, Pigeon M, Kappler J, Marrack P. The major histocompatibility complex-restricted antigen receptor on T cells. I. Isolation with a monoclonal antibody. J Exp Med. 1983;157:1149–69. doi: 10.1084/jem.157.4.1149. [DOI] [PMC free article] [PubMed] [Google Scholar]
- 25.Tomasi M, Dertzbaugh MT, Hearn T, Hunter RL, Elson CO. Strong mucosal adjuvanticity of cholera toxin within lipid particles of a new multiple emulsion delivery system for oral immunization. Eur J Immunol. 1997;27:2720–5. doi: 10.1002/eji.1830271036. [DOI] [PubMed] [Google Scholar]
- 26.Van Parijs L, Abbas AK. Homeostasis and self-tolerance in the immune system: turning lymphocytes off. Science. 1998;280:243–8. doi: 10.1126/science.280.5361.243. [DOI] [PubMed] [Google Scholar]
- 27.Honjo K, Xu XY, Kapp JA, Bucy RP. Activation and migration of allo-peptide specific TCR transgenic T cells in cardiac allograft rejection. Cell Immunol. 2004;230:44–55. doi: 10.1016/j.cellimm.2004.09.001. [DOI] [PubMed] [Google Scholar]
- 28.Kirberg J, Baron A, Jakob S, Rolink A, Karjalainen K, von Boehmer H. Thymic selection of CD8+ single positive cells with a class II major histocompatibility complex-restricted receptor. J Exp Med. 1994;180:25–34. doi: 10.1084/jem.180.1.25. [DOI] [PMC free article] [PubMed] [Google Scholar]
- 29.Hou S, Hyland L, Ryan KW, Portner A, Doherty PC. Virus-specific CD8+ T-cell memory determined by clonal burst size. Nature. 1994;369:652–4. doi: 10.1038/369652a0. [DOI] [PubMed] [Google Scholar]
- 30.Blattman JN, Antia R, Sourdive DJ, et al. Estimating the precursor frequency of naive antigen-specific CD8 T cells. J Exp Med. 2002;195:657–64. doi: 10.1084/jem.20001021. [DOI] [PMC free article] [PubMed] [Google Scholar]
- 31.Schiemann M, Busch V, Linkemann K, Huster KM, Busch DH. Differences in maintenance of CD8+ and CD4+ bacteria-specific effector-memory T cell populations. Eur J Immunol. 2003;33:2875–85. doi: 10.1002/eji.200324224. [DOI] [PubMed] [Google Scholar]
- 32.Smith AL, Wikstrom ME, Fazekas de St Groth B. Visualizing T cell competition for peptide/MHC complexes: a specific mechanism to minimize the effect of precursor frequency. Immunity. 2000;13:783–94. doi: 10.1016/s1074-7613(00)00076-5. [DOI] [PubMed] [Google Scholar]
- 33.Sojka DK, Bruniquel D, Schwartz RH, Singh NJ. IL-2 secretion by CD4+ T cells in vivo is rapid, transient, and influenced by TCR-specific competition. J Immunol. 2004;172:6136–43. doi: 10.4049/jimmunol.172.10.6136. [DOI] [PubMed] [Google Scholar]
- 34.Rannie GH, Donald KJ. Estimation of the migration of thoracic duct lymphocytes to non-lymphoid tissues. A comparison of the distribution of radioactivity at intervals following i.v. transfusion of cells labelled with 3H, 14C, 75Se, 99mTc, 125I and 51Cr in the rat. Cell Tissue Kinet. 1977;10::523–41. [PubMed] [Google Scholar]
- 35.Westermann J, Puskas Z, Pabst R. Blood transit and recirculation kinetics of lymphocyte subsets in normal rats. Scand J Immunol. 1988;28:203–10. doi: 10.1111/j.1365-3083.1988.tb02432.x. [DOI] [PubMed] [Google Scholar]
- 36.Westermann J, Puskas Z, Pabst R. The migration of lymphocyte subsets from blood to lymph in the normal rat. Adv Exp Med Biol. 1988;237:547–51. doi: 10.1007/978-1-4684-5535-9_83. [DOI] [PubMed] [Google Scholar]


