Abstract
Our aim is to determine whether the disulfide bonds of α-lactalbumin account for the lack of cooperative folding behavior reported for some molten globule variants, in contrast to the highly cooperative folding reported for the pH 4 molten globule of apomyoglobin. Two different α-lactalbumin genetic constructs are studied: [28–111], which has a single disulfide bond connecting two segments of the α-helix domain, and [all-Ala], which has no disulfide bonds. The superposition test used earlier to probe for cooperative folding of the apomyoglobin molten globule is used to determine whether there is an important difference in folding cooperativity between the molten globules of [28–111] and [all-Ala]. The [all-Ala] construct behaves in the same manner as the apomyoglobin molten globule: its folding satisfies the superposition test in the three sets of anion conditions studied, and anions stabilize it against urea unfolding. The [28–111] construct behaves differently in both respects: the folding of its molten globule does not satisfy the superposition test in two of the three sets of anion conditions, and anions barely affect its stability. The 28–111 disulfide bond stabilizes the molten globule substantially, as expected from earlier work. Comparison of the unfolding transition curves monitored by circular dichroism also demonstrates that [28–111] folds in a less cooperative manner than [all-Ala]: the unfolding curve of [28–111] is significantly broader. Moreover, the unfolding curves indicate that [28–111] has a lower helix content than [all-Ala]. Consequently, the 28–111 bond constrains the folding behavior of the molten globule and weakens its cooperativity of folding.
Whether molten globules (MGs) fold cooperatively is controversial, and the cooperative folding reported for the recombinant sperm whale apomyoglobin (apoMb) MG is surprising because a large part of the apoMb MG (1, 2) is either unfolded or poorly folded. Likewise, the β-domain of the recombinant human α-lactalbumin (α-LA) MG is unfolded (3). Nevertheless, highly cooperative (≈ two-state) folding of the apoMb MG has been reported (4–6), in contrast to poorly cooperative folding of the α-LA MG (7, 8). Although opposite results have been found for these two MGs, nevertheless self-consistent results have been obtained for each one by using different methods. Thus, the results reported for each protein are likely to be correct. We ask here whether the conflicting results found for the two proteins are explained by the disulfide bonds present in α-LA but absent in apoMb.
The superposition test used here to probe for cooperative folding has been successful in detecting intermediates (when they exist) in the unfolding reactions of native proteins (9, 10). The test is to compare the normalized unfolding curves monitored by probes of secondary and tertiary structure. The superposition test is a good starting point for analyzing cooperative folding: a positive result provides a necessary, but not a sufficient, condition for two-state folding. More detailed and sensitive methods, such as NMR monitoring of the unfolding transition (8) or analysis of the kinetics of folding and unfolding (5), can be used afterward. The question asked here is whether the superposition test reveals a clear difference between the folding cooperativity of two α-LA MGs: [28–111], which has a single disulfide bond, and [all-Ala], which has no disulfide bonds. These two constructs were used by Kim and coworkers to measure the effects of MG formation on the equilibrium constants for forming the four different single disulfide bonds of α-LA (11).
Cooperative folding is a relative term: highly cooperative folding means that folding intermediates are not easily detected. Weakly cooperative folding means that intermediates are obviously present although folding is still cooperative, because folding of one segment affects the folding of a neighboring segment. Single-domain native proteins commonly show highly cooperative (two-state) folding in which intermediates cannot be detected. On the other hand, although α-helix formation is cooperative because helix propagation depends on a prior nucleation step, it is weakly so because most molecules are only partly helical at equilibrium.
Highly cooperative folding of the apoMb MG is not an invariant property: cooperative folding may be weakened by destabilizing mutations (6, 12) and partially restored by stabilizing anion conditions (6). Consequently, in investigating the cooperativity of folding it is desirable to examine a range of stabilizing anion conditions. We use the three sets of conditions used earlier in a study of the apoMb MG (6): 30 mM NaCl/20 mM Na2SO4/50 mM NaClO4, pH 4.2. The stability of the apoMb MG increases with anion conditions in the order given. The rationale for anion stabilization is that a MG at acidic pH has a high net positive charge that tends to destabilize the MG, and the positive charge can be reduced by binding specific anions (13, 14). Dependence of stability on net charge has been tested and confirmed for the apoMb MG by making charge replacement mutants (15).
Far-UV CD is used as a standard probe of secondary structure in monitoring protein unfolding. On the other hand, molten globules are frequently said to have no organized tertiary structure, and it may seem paradoxical that tryptophan fluorescence (FL) can be used for this purpose. The different FL spectra of the MG and acid-unfolded forms of apoMb indicate that the increased FL of the MG, as well as the redshift of its wavelength of maximum emission, arises from partial burial of the Trp residues in the substantially nonpolar interior of the MG (16). Results found for apoMb mutants are also consistent with this interpretation (4, 6).
MATERIALS AND METHODS
Construction of Variants and Protein Preparations.
Plasmids containing genes for the two constructs [28–111] and [all-Ala] were gifts from Peter Kim at Massachusetts Institute of Technology. The proteins were expressed in Escherichia coli BL21/DE3/pLysS and purified by ion exchange chromatography as described (11). Protein concentrations were determined in 6 M guanidine HCl, pH 6.0, by UV absorbance at 280 nm, assuming ɛ280 = 23,150 M−1 cm−1 (18). Oxidized α-lactalbumin [28–111] was prepared in 4 M guanidium Cl and 0.2 M Tris⋅HCl, pH 8.5, at room temperature for 72 hr, as described (11). The concentration of remaining unoxidized cysteine residues in the oxidized α-lactalbumin [28–111] was determined by Ellman’s reagent (17). Less than 0.1% cysteine was found in oxidized [28–111].
CD and FL Measurements and Analysis of Unfolding Transitions.
CD data were collected at 222 nm with a 1-cm cuvette by using an Aviv 62A DS (Aviv Associates, Lakewood, NJ) CD spectropolarimeter. FL measurements were made by using an SLM AB2 (SLM—Aminco, Urbana, IL) spectrofluorimeter with a 1-cm light path. Excitation was at 280 nm (with a bandpass of 4 nm) for both [28–111] and [all-Ala], whereas emission was monitored at 340 nm (with a bandpass of 16 nm) for [28–111] and 320 nm for [all-Ala]. Protein concentrations of 1 μM and 2 μM were used for FL and CD measurements, respectively. The CD-monitored helix content at 222 nm did not vary with protein concentration between 0.5 and 50 μM for [all-Ala] at pH 4.2 (data not shown.) The buffer used for measuring the urea-induced unfolding curve was 2 mM sodium acetate, pH 4.2, and the temperature was 20°C.
Urea-induced unfolding curves were analyzed by a two-state equation with linear baselines, according to a procedure (19) that uses data inside as well as outside the transition zone to fix the baselines. The linear extrapolation model was used to express the dependence of the unfolding free energy (ΔG) on the molar urea concentration [C], according to ΔG = ΔG(H2O) − mC. At the midpoint of the urea unfolding transition (Cm) ΔG is zero and mCm= ΔG(H2O), the free energy of unfolding at C = 0.
RESULTS
The Superposition Test Applied to [all-Ala] and [28–111].
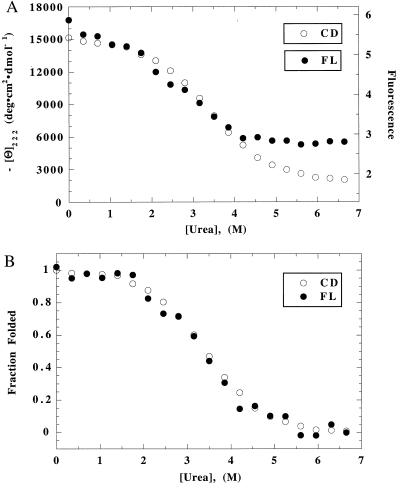
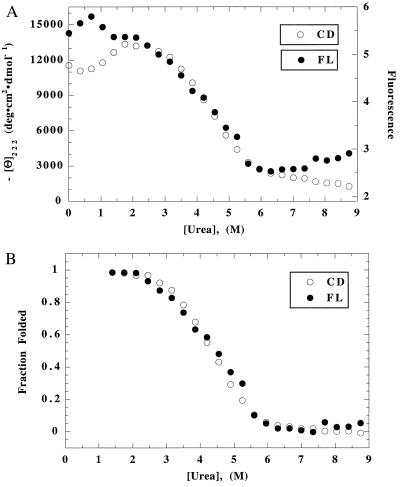
The superposition test for cooperative unfolding of [all-Ala] is shown in Fig. 1 (30 mM NaCl) and in Fig. 2 (20 mM Na2SO4). The raw data, scaled to allow superposition in the transition zone, are shown in Figs. 1A and 2A. In the unfolded baseline region, the FL baseline is approximately level, although the CD baseline continues to decline with increasing [urea]: by eye, the CD baseline region cannot be distinguished from the transition zone. The native baseline region is short and not very helpful in determining the baseline contribution of the native protein. There is a glitch in the CD native baseline in Na2SO4 (a decline, rather than an increase, in CD below 1.5 M urea), which appears also in NaClO4 but not in NaCl.
Figure 1.
(A) Unfolding curves of [all-Ala] in 30 mM NaCl/2 mM NaAc, pH 4.2, 20°C, monitored by CD and FL. The scales of the two curves have been linearly adjusted to make them superimpose in the transition zone. (B) Superposition test: the two curves of A have been fitted separately to the two-state equation (20) to determine the baselines; they were normalized by subtracting the baseline contribution. Then the two curves were plotted together to determine whether they are superimposable.
Figure 2.
(A) Raw data for unfolding of [all-Ala] in 20 mM Na2SO4: other conditions are the same as Fig. 1A. (B) Superposition test for unfolding of [all-Ala] in 20 mM Na2SO4: see legend to Fig. 1B.
The CD and FL-monitored unfolding curves are fitted separately to the two-state equation. This procedure fixes the native and unfolded baselines, and it uses the extensive data inside the transition zone as well as the limited data above and below the transition zone to determine the baselines. After subtracting the baseline contributions to CD and FL, the normalized curves are compared with each other in Figs. 1B and 2B. Within error, the CD and FL-monitored unfolding transitions are superimposable. The same result is found in NaClO4 (data not shown). The data points corresponding to the glitch in the CD unfolding curves of [all-Ala] (in Na2SO4 and NaClO4) are omitted in fitting the raw data to the two-state equation.
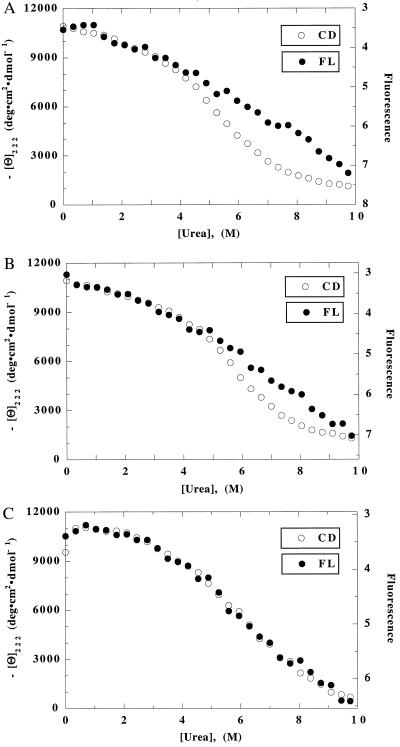
The raw data for CD and FL-monitored unfolding of [28–111] are shown in Fig. 3 A–C for all three anion conditions. Although CD-monitored unfolding gives an S-shaped curve that resembles a two-state unfolding transition, FL-monitored unfolding gives approximately linear curves in NaCl and Na2SO4. It is not possible to fit these FL unfolding curves to the two-state equation, and the superposition test for cooperative folding of [28–111] fails even at the level of inspecting the raw data for unfolding. FL-monitored unfolding of [28–111] in NaClO4 does give an S-shaped curve (Fig. 3C), and the CD- and FL-monitored unfolding curves can be superimposed by adjusting the scales of the raw data. Nevertheless, analysis of the breadth of the unfolding transition curves indicates that unfolding of [28–111] in NaClO4 is not two state (see Discussion).
Figure 3.
Unfolding curves of [28–111], monitored by CD and FL in (A) 30 mM NaCl, (B) 20 mM Na2SO4, and (C) 50 mM NaClO4. For conditions, see legend to Fig. 1A.
Comparison of the CD-Monitored Unfolding Curves of [all-Ala] and [28–111].
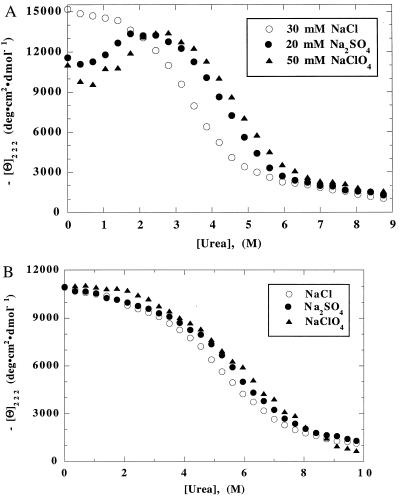
The CD-monitored unfolding curves of [all-Ala] and [28–111] in NaCl, Na2SO4, and NaClO4 are compared in Fig. 4 A and B. Several points can be seen by eye. (i) The three [all-Ala] curves share a common unfolded baseline above 7 M urea. Consequently, the unfolded CD baseline is known reliably for [all-Ala]. (ii) On the other hand, in the region of the native baseline the three [all-Ala] curves diverge widely, because there is a glitch in the unfolding curves in Na2SO4 and NaClO4, but not in NaCl. No corresponding glitch is seen in the CD unfolding curves of [28–111]. (iii) When the three unfolding curves of [all-Ala] are fitted to the two-state equation and data from the region of the glitch are omitted, the CD values at 0 M urea are −15,000 deg cm2 dmol−1 or higher for [all-Ala], whereas the values for [28–111] cluster closely around −11,000. Consequently, in our conditions, the MG has a higher helix content in [all-Ala] than in [28–111]. The opposite result was reported in other conditions (pH 8.5, no stabilizing anion) (11), but the unfolding curve was not determined, and a glitch like the one shown here may have been present. (iv) The unfolding curves of [28–111] appear to be significantly more broad than those of [all-Ala]. (v) The transition midpoint (Cm) of [all-Ala] changes substantially with anion conditions, but the Cm of [28–111] does not. Points (iv) and (v) are considered in more detail below.
Figure 4.
CD-monitored unfolding curves of (A) [all-Ala] and (B) [28–111] in 30 mM NaCl/20 mM Na2SO4/50 mM NaClO4. For conditions, see legend to Fig. 1A.
DISCUSSION
Use of the Superposition Test to Study Folding Cooperativity of Molten Globules.
Use of the superposition test to study folding cooperativity is well established for single-domain native proteins. They display two important properties that may or may not be shared by molten globules: first, their structures are uniform, and second, their folding reactions accurately fit the two-state model, except for those exceptional proteins that give rise to observable folding intermediates. Also, the unfolding transition curves of native proteins are sufficiently sharp that the native and unfolded baselines can be determined reliably with the aid of data above and below the transition zone. Although it is possible to determine the baselines for very broad transition curves by fitting the unfolding transition to the two-state model, the baselines determined in this way are less reliable than the ones found when the transition curves are sharp.
Because caution is needed in applying the superposition test to molten globules, we follow these rules. (i) Before using the superposition test, the raw data for CD- and FL-monitored unfolding are superimposed and examined. This comparison may reveal unexpected problems in applying the test. A positive superposition test, found after subtracting the baselines and normalizing the curves, should already be plausible from inspecting the raw data. (ii) A positive superposition test indicates that folding is clearly cooperative but not necessarily two state; more sensitive tests, such as NMR monitoring of the transition (8) or analysis of the kinetics of folding and unfolding (5), are needed. On the other hand, a negative superposition test is sufficient to show that folding is not highly cooperative.
Highly Cooperative Folding of [all-Ala] and Weakly Cooperative Folding of [28–111].
The superposition test is satisfied for [all-Ala] in all three sets of anion conditions (NaClO4 not shown) and inspection of the raw data (Figs. 1A and 2A) already suggests that the superposition test should be positive. On the other hand, the raw FL data for [28–111] in NaCl and Na2SO4 show that the superposition test cannot be positive. The FL-monitored unfolding curves are almost linear throughout the whole range of urea concentration, and the FL curves cannot be fitted to the two-state equation.
The CD-monitored unfolding curves by themselves suggest that [all-Ala] unfolding is more cooperative than that of [28–111]. Weaker cooperativity causes the unfolding transition curve to broaden. Quantitative comparison between the breadth of the unfolding curves of [28–111] and [all-Ala] may be made with the use of the linear extrapolation model (see Materials and Methods). The apparent m values (denoted by m*) provide a quantitative measure of transition breadth: a higher m* value means a sharper transition curve and higher cooperativity of folding. In a two-state folding reaction, the m value is known to be closely proportioned to ΔASA, the change in accessible surface area on unfolding (20). This is true of both urea- and guanidine-induced unfolding reactions. [28–111] and [all-Ala] should have the same values of ΔASA, if they form closely similar MGs, except that the disulfide of [28–111] should cause it to be more compact. This effect has been estimated as a decrease of 900 A°2 per disulfide bond (20), which equals a decrease of 99 cal⋅mol−1M−1 in m-value. The m*-value of [all-Ala] in 30 mM NaCl is 848 cal⋅mol−1M−1. If we accept the unfolding transition of [all-Ala] as two state, then we can calculate the m-value of [28–111] for two-state unfolding as 848–99 = 749 cal⋅mol−1M−1. The m* value of [28–111] is 577 cal⋅mol−1M−1 (Table 1), which is significantly lower, and the same behavior is seen in Na2SO4 and especially in NaClO4 (Table 1). Thus we can conclude from CD data alone that the unfolding of [28–111] is not two state, particularly in 50 mM NaClO4.
Table 1.
Parameters of the CD-monitored unfolding curves of [all-Ala] and [28-111]
| α-LA | Cm, m*
|
||
|---|---|---|---|
| 30 mM NaCl | 20 mM Na2SO4 | 50 mM NaCIO4 | |
| [all-Ala] | 3.42, 848 | 4.34, 880 | 4.62, 933 |
| [28-111] | 5.43, 577 | 5.85, 669 | 6.06, 270 |
The unfolding curves were measured in 2 mM NaAc, pH 4.2, at 20°C. Cm is the urea molarity at the midpoint of the unfolding transition and m* is the apparent m value defined by the linear extrapolation model (see Materials and Methods) in kcal·mol−1 M−1.
The 28–111 Disulfide Bond Places a Constraint on the Folding Behavior of the α-LA MG.
Measurements of Ceff, the effective concentration of one Cys thiol group in the vicinity of the other before the disulfide bond is formed, show that the 28–111 bond is exceptional among the four disulfide bonds of α-LA in being stabilized by the MG (11). Our results show that, as expected from thermodynamic linkage, the MG is stabilized by the 28–111 disulfide bond. The amount of stabilization can be estimated approximately from ΔΔG = mΔCm (see Materials and Methods), where m is m* for [all-Ala]; m is assumed to be approximately the same for [28–111] and for [all-Ala] when [28–111] unfolds in a [hypothetical] two-state reaction. This relation gives for ΔΔG: −2.0 kcal/mol (1 kcal = 4.18 kJ) in NaCl, −1.5 kcal/mol in Na2SO4, and −1.4 kcal/mol in NaClO4. The effect of the MG in stabilizing the 28–111 bond was estimated to be approximately −2.0 kcal/mol (11), or to be in the range −1.4 to −2.2 kcal/mol (21), at pH 8.5.
As pointed out above, the intrinsic CD value of [all-Ala] at 0 M urea is −15,000 deg cm2 dmol−1, whereas that of [28–111] is only −11,000. This difference provides direct evidence for a constraint placed by the 28–111 bond on the folding of the MG. The reason for the glitch at low [urea] in the unfolding curves of [all-Ala] in Na2SO4 and NaClO4 is not known. Unfolding of the apoMb MG shows a similar glitch at low [urea] in the FL-monitored unfolding curves (16). In the apoMb case, the cause of the glitch is known to be a [urea]- and pH-dependent interconversion between two forms of the MG (16).
Implications for the Mechanism of MG Folding.
Our results support the proposal (4–6, 22) that the folding reactions of structured molten globules are intrinsically highly cooperative, although MG folding is not very stable, and the cooperativity of folding is likewise fragile, easily perturbed by covalent crosslinks (as we report here), or by severely destabilizing mutations (6, 12). Cooperative folding of helical MGs implies specific hydrophobic packing interactions between helices. Mutational evidence for specific (or native-like) packing interactions between helices has been reported for a kinetic folding intermediate of cyt c (23) as well as for equilibrium MGs of cyt c (24, 25), apoMb (6, 12), and α-LA (21, 26.)
Acknowledgments
We thank Peter S. Kim for his plasmids and suggestions. Y.L. was a fellow of the National Institutes of Health. This work was supported by a National Institutes of Health Grant (GM 19988) to R.L.B.
ABBREVIATIONS
- α-LA
recombinant human α-lactalbumin
- apoMb
recombinant sperm whale apomyoglobin
- MG
molten globule
- FL
fluorescence
- Cm
molar urea concentration at the transition midpoint
Note Added in Proof
After this paper was completed, we received a preprint describing related work (27). The urea-induced unfolding transitions at pH 2 of [all-Ala] and of wild type (with four disulfide bonds) are compared in the absence of any stabilizing anion (except for the anion of the acid used to produce pH 2). The NMR method used earlier (8) to monitor the MG unfolding transition, which uses 15N-labeled protein, is used. Cooperativity of folding is not a main subject, but in the unfolding curve of [all-Ala] “cross peaks from the four α-domain helices of the native structure become observable in the NMR spectra over a relatively narrow range of urea concentrations,” and their results apparently are consistent with the ones reported here. Because they do not use a stabilizing anion, [all-Ala] unfolds in a lower range of urea concentrations (Cm ≈ 3.4 M) than found here in Na2SO4 or NaClO4 (Table 1).
References
- 1.Hughson F M, Wright P E, Baldwin R L. Science. 1990;249:1544–1548. doi: 10.1126/science.2218495. [DOI] [PubMed] [Google Scholar]
- 2.Eliezer D, Yao J, Dyson H J, Wright P E. Nat Struct Biol. 1998;5:148–155. doi: 10.1038/nsb0298-148. [DOI] [PubMed] [Google Scholar]
- 3.Wu L C, Peng Z-y, Kim P S. Nat Struct Biol. 1995;2:281–286. doi: 10.1038/nsb0495-281. [DOI] [PubMed] [Google Scholar]
- 4.Kay M S, Baldwin R L. Nat Struct Biol. 1996;3:439–445. doi: 10.1038/nsb0596-439. [DOI] [PubMed] [Google Scholar]
- 5.Jamin M, Baldwin R L. Nat Struct Biol. 1996;3:613–618. doi: 10.1038/nsb0796-613. [DOI] [PubMed] [Google Scholar]
- 6.Luo Y, Kay M S, Baldwin R L. Nat Struct Biol. 1997;4:925–930. doi: 10.1038/nsb1197-925. [DOI] [PubMed] [Google Scholar]
- 7.Schulman B A, Kim P S. Nat Struct Biol. 1996;3:682–687. doi: 10.1038/nsb0896-682. [DOI] [PubMed] [Google Scholar]
- 8.Schulman B A, Kim P S, Dobson C M, Redfield C. Nat Struct Biol. 1997;4:630–634. doi: 10.1038/nsb0897-630. [DOI] [PubMed] [Google Scholar]
- 9.Wong K-P, Tanford C. J Biol Chem. 1973;248:8518–8523. [PubMed] [Google Scholar]
- 10.Kuwajima K, Nitta K, Yoneyama M, Sugai S. J Mol Biol. 1976;106:359–373. doi: 10.1016/0022-2836(76)90091-7. [DOI] [PubMed] [Google Scholar]
- 11.Peng Z-y, Wu L C, Kim P S. Biochemistry. 1995;34:3248–3252. doi: 10.1021/bi00010a014. [DOI] [PubMed] [Google Scholar]
- 12.Kay M S, Ramos C H I, Baldwin R L. Proc Natl Acad Sci USA. 1999;96:2007–2012. doi: 10.1073/pnas.96.5.2007. [DOI] [PMC free article] [PubMed] [Google Scholar]
- 13.Goto Y, Takahashi N, Fink A L. Biochemistry. 1990;29:3480–3488. doi: 10.1021/bi00466a009. [DOI] [PubMed] [Google Scholar]
- 14.Hagihara Y, Tan Y, Goto Y. J Mol Biol. 1994;237:336–348. doi: 10.1006/jmbi.1994.1234. [DOI] [PubMed] [Google Scholar]
- 15.Kay M S, Baldwin R L. Biochemistry. 1998;37:7859–7868. doi: 10.1021/bi9802061. [DOI] [PubMed] [Google Scholar]
- 16.Jamin M, Baldwin R L. J Mol Biol. 1998;276:491–504. doi: 10.1006/jmbi.1997.1543. [DOI] [PubMed] [Google Scholar]
- 17.Ellman G L. Arch Biochem Biophys. 1959;82:70–77. doi: 10.1016/0003-9861(59)90090-6. [DOI] [PubMed] [Google Scholar]
- 18.Edelhoch H. Biochemistry. 1967;6:1948–1954. doi: 10.1021/bi00859a010. [DOI] [PubMed] [Google Scholar]
- 19.Santoro M M, Bolen D W. Biochemistry. 1988;27:8063–8068. doi: 10.1021/bi00421a014. [DOI] [PubMed] [Google Scholar]
- 20.Myers J K, Pace C N, Scholtz J M. Protein Sci. 1995;4:2138–2148. doi: 10.1002/pro.5560041020. [DOI] [PMC free article] [PubMed] [Google Scholar]
- 21.Song J, Bai P, Luo L, Peng Z-y. J Mol Biol. 1998;280:167–174. doi: 10.1006/jmbi.1998.1826. [DOI] [PubMed] [Google Scholar]
- 22.Uversky V N, Ptitsyn O B. Folding Des. 1996;1:117–122. doi: 10.1016/S1359-0278(96)00020-X. [DOI] [PubMed] [Google Scholar]
- 23.Colon W, Elove G A, Wakem L P, Sherman F, Roder H. Biochemistry. 1996;35:5538–5549. doi: 10.1021/bi960052u. [DOI] [PubMed] [Google Scholar]
- 24.Marmorino J L, Pielak G J. Biochemistry. 1995;34:3140–3143. doi: 10.1021/bi00010a002. [DOI] [PubMed] [Google Scholar]
- 25.Marmorino J L, Lehti M, Pielak G J. J Mol Biol. 1998;275:379–388. doi: 10.1006/jmbi.1997.1450. [DOI] [PubMed] [Google Scholar]
- 26.Wu L C, Kim P S. J Mol Biol. 1998;280:175–182. doi: 10.1006/jmbi.1998.1825. [DOI] [PubMed] [Google Scholar]
- 27.Redfield, C., Schulman, B. A., Milhollen, M. A., Kim, P. S. & Dobson, C. M. (1999) Nat. Struct. Biol., in press. [DOI] [PubMed]


