Abstract
The computational approach for identifying promoters on increasingly large genomic sequences has led to many false positives. The biological significance of promoter identification lies in the ability to locate true promoters with and without prior sequence contextual knowledge. Prior approaches to promoter modelling have involved artificial neural networks (ANNs) or hidden Markov models (HMMs), each producing adequate results on small scale identification tasks, i.e. narrow upstream regions. In this work, we present an architecture to support prokaryote promoter identification on large scale genomic sequences, i.e. not limited to narrow upstream regions. The significant contribution involved the hybrid formed via aggregation of the profile HMM with the ANN, via Viterbi scoring optimizations. The benefit obtained using this architecture includes the modelling ability of the profile HMM with the ability of the ANN to associate elements composing the promoter. We present the high effectiveness of the hybrid approach in comparison to profile HMMs and ANNs when used separately. The contribution of Viterbi optimizations is also highlighted for supporting the hybrid architecture in which gains in sensitivity (+0.3), specificity (+0.65) and precision (+0.54) are achieved over existing approaches.
INTRODUCTION
Motif identification in biological sequences is a common and growing task in bioinformatics, arising from ever growing numbers of genomic sequences. Specific motif identification tasks such as in this case promoter element recognition, enable context to be placed on raw sequences and aid knowledge discovery through autonomous sequence annotation. The problem specific to promoter identification centres on the ability to recognize consensus sequences often of short length, in large context unaware background sequences. In this manner a two-tiered issue arises, namely, sequence deviation from consensus and the shortness of signal relative to the background. The biological reality of promoter structure imposes these challenges, to which many computational techniques have attempted to answer.
The promoter is the key regulatory region which enables gene transcription. Its composition is dependent upon the taxonomic classification of the organism and the category of the gene under its control. Whilst conservation does exist broadly in promoters i.e. prokaryotic −35 and −10 boxes and the TATA box in eukaryotes, significant variability exists, including the absence of these sequences. Such sequences and associated upstream elements are very short and are easily lost when analysing large regions of nucleotides without prior context knowledge. In a study conducted by (1), a conclusion was drawn which stated that only 20% of the known promoters had scoring above the false positives for a 0.1 Mb genomic sequence. The question of search domain arises whereby 90.31% of sigma 70 promoters fall within 250 bp of the transcription start site (TSS) (2). These authors using a weight matrix approach and 250 bp window upstream from the TSS concluded that >50% of promoter sequences had false signals (promoter like) that score better than the true promoter. The −35 and −10 signal detection yielded 38 signals per 250 bp using 3 SDs. The discovery of so many potential RNA polymerase (RNAP) binding signals would suggest promoter degeneracy over evolutionary time due to mutations which lead to up and down effects on the promoter strength. Alternatively, another hypothesis for the prevalence of false signals was proposed by (3) in which the multitude of candidate promoters serve in negative competition or positively towards the channelling of the RNAP to the promoter.
In our study, such an accessory ‘up’ element was used. Other such elements exist, including the process whereby a false promoter element attracts the RNAP to the true promoter for the RNAP to then be relocated by an activator as in the CRP–MalT system (4).
Techniques to achieve promoter identification typically rely on the detection of consensus motifs. This scheme works well when identifying highly conserved motifs in short biological background sequences, however, motifs quickly get lost and produce many false positives in larger background sequences. The most effective use of consensus identification is toward seeking relatively large motifs, e.g. CpG islands, as by the classical hidden Markov models (HMMs) (5).
HMMs are statistical models based on a double stochastic process with hidden underlying states and observable emissions. The purpose of this model is to represent a motif in a stochastic framework which is then used for the classification of candidate sequences. Many applications in bioinformatics have benefited from HMMs, including binding site prediction (6), protein families and homology modelling (7), conserved sequence recognition (8), gene finding (9) and alignment (10). Another approach to motif identification involves artificial neural networks (ANNs). An ANN is a graph which is composed of computational elements that are loosely designed to model the human nervous system. ANNs have generally been applied to the identification of regulatory sequences (11–15). The purpose of this technique is to form associations in the data under analysis, which can be used to model motifs in situ.
To address the situation of incorporating additional neighbouring biological information into computational models, an effective motif extraction technique, such as the HMM, needs its results placed in a biological context, as can be achieved by the ANN. By filtering HMM results via an ANN, the false positives obtained by an HMM-only scheme can be reduced. This approach effectively builds a profile for the regulatory region using two of the most powerful pattern searching techniques available. The stimuli for this hybrid approach is founded in the properties of each model. Profile HMMs (5) model biological sequences and account for variation, whilst ANNs learn association between entities, in this case, promoter elements. Using these properties, it is logical to model and associate promoter elements to form a prediction algorithm. The first such use of HMM/ANN hybrids has been towards speech processing (16). In this case, the ANN applied contextual knowledge to the raw HMM scores. Hybrid architectures that are composed of HMMs and ANNs have been used in bioinformatics recently. Such applications involve (17), whereby an ANN is used primarily for eukaryote secondary structure prediction with a HMM then applied to filter the results. This is inverse to what our process involves. When compared with other techniques in the field of secondary structure prediction, such an approach meets current performance levels. Using an architecture similar to the model developed by the authors of this study, prediction of G-protein coupled with receptor specificity has been achieved (18). The reported finding indicates a 94% classification rate. Another application of the hybrid approach included (19), whereby an NN-HMM-ENSEMBLE is combined to predict all-alpha proteins with prediction accuracy better by 7–9% than other techniques.
The unified hybrid model developed by the authors for the purpose of promoter element recognition has proved a concept thematic in n-motif functional region identification. The ability to model composition variability and motif relative location was enabled by utilizing the attributed of pHMMs (motif composition) and ANNs (locality validation). The resultant property was a model that could identify motifs and further justify their predicted score by incorporating their positional arrangement. Performance outcomes involve improvements of sensitivity (+0.3), specificity (+0.65) and precision (+0.54) over existing techniques (20,21).
In this study, both pHMMs and ANNs are shown to be ineffective toward genomic promoter identification, therefore highlighting the need for an improved model. False positives and narrow signal detection in short backgrounds are the key motivations taken by the authors. The result is the development of an architecture for the integration of these two approaches, whereby the performances of either approach is extended through novel integration strategies. By combining the modelling and scoring optimizations of the pHMM with the associative power of ANN's, this architecture will more accurately represent the motifs under consideration in genomic contexts. The architecture of our model is comprised of a three-layer feed-forward neural network with a pHMM acting as the input neurons via a Viterbi scoring determination which is shown to provide more discriminative pHMM scoring optimization. The outcome is a hybrid model capable of locating promoters in large sequence backgrounds a goal which neither pHMM nor ANN can achieve when used in isolation.
MATERIALS AND METHODS
Combining the pHMM and ANN architectures to accomplish genomic scale promoter identification is the function of the hybrid architecture. The first stage in modelling specific regulatory regions involves pHMM construction and training. The promoter regions of prokaryote ‘housekeeping’ genes were used as an example system. The composition of such regions includes the −35 and −10 promoter elements. To incorporate such elements into the hybrid architecture, each conserved sequence requires modelling via a pHMM. Each pHMM is trained using 100 promoter element annotated Escherichia coli −10 and −35 signals, respectively, obtained from NCBI GenBank (22) which are aligned using ClustalW (23). These sequences were obtained using the query ‘−10_SIGNAL AND E.coli [ORGANISM] NOT PLASMID’ and then filtered to remove insertion sequences, therefore focusing on native chromosomal promoters (Supplementary Data ‘Core Promoter Data’). The outcome of the data mining task results in two profiles representing the −35 and −10 core signals respectively via pHMMs. Scoring follows a sliding window of size 6 bp for each position in the sequence. Numeric scores from the pHMMs are sent to the input layer of a three-layer feed-forward neural network which uses a sigmoidal transfer function as described below:
| 1 |
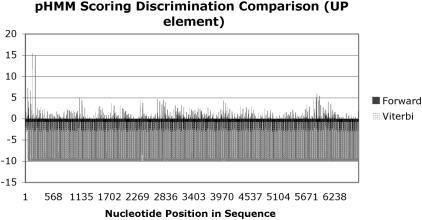
where v represents the Viterbi score for the final state k in the optimal path π though the pHMM for the candidate sequence x = (1… N). The requirement of integrating two disparate models falls upon the prerequisite modelling foundations of the pHMM. In order to achieve the best predictive outcomes, the pHMM scoring scheme has to be optimized for the problem under analysis. In this study, a pHMM is used to model each promoter element. The short motif e.g. 6 bp is represented by the pHMM by consensus, insert and delete states. The problem under analysis regards the determination of the candidate sequence being of a promoter element modelled by the pHMM. Two scoring schemes are classically applied to HMM analysis, the forward algorithm and the Viterbi algorithm. The forward algorithm generates a score indicating the likelihood of the observed sequence given in the model, an obvious choice. The Viterbi algorithm determines the optimal path through the model, given the observed sequence and effectively aligns the candidate sequence to the model. Upon analysis, the forward algorithm encompasses all paths through the model to generate the scoring outcome, however, the Viterbi algorithm only uses the maximal path. The desired property of the pHMM lies in its ability to model, as closely as possible, to the promoter element and discriminately score candidate sequences. The forward algorithm, when compared with the Viterbi algorithm as shown below, has lower discrimination ability, whereby forward values produce many false predictions, however the Viterbi scoring produces only 1 significant prediction, see Figure 1.
Figure 1.
pHMM scoring algorithm discrimination ability for Sequence AB102735.
Traditionally, the forward algorithm is used to answer the question surrounding candidate outcome for a given model, however, our investigation has found the Viterbi algorithm to be more discriminative. The underlying algorithm of taking the best path through the model is a more desirable property which is produced by the Viterbi algorithm. This property serves the pHMM portion of the hybrid better than traditional scoring via the forward algorithm. Capitalizing on this outcome, the Viterbi output serves as the bridge linking pHMM to ANN.
The HMM-ANN hybrid transfer function for the hidden layer that receives the pHMM values is:
| 2 |
The ANN training set was composed of 75 pHMM score distributions for positive genomic sequences which contain a promoter and 75 distributions for genomic sequences which do not contain a promoter sequence (Supplementary Data—‘ANN Training Data’). The test data, both positive and negative sequences, were obtained from the NCBI GenBank (22), which consisted of E.coli promoter (positive set) and E.coli coding sequence (negative dataset). The database queries for the positive dataset remained as before however the query for the negative dataset included a ‘NOT—xx_signal’ clause to reflect the absence of a promoter. Error backpropagation was used in these training epochs. The ANN output represents a score which indicates the likelihood of the candidate sequence score being a promoter.
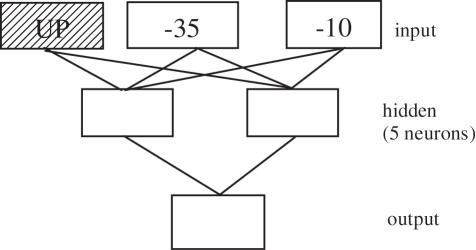
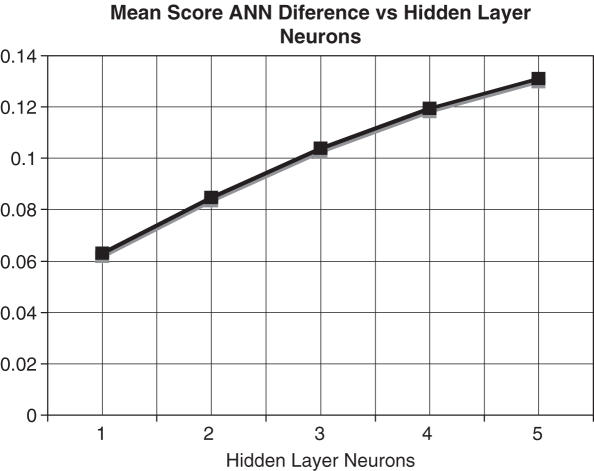
In the example of the architecture Figure 2, there are three pHMMs, each modelling separate prokaryote promoter elements. The pHMMs scores serve as input to the three-layer feed-forward ANN whose purpose is to classify the sequences based on its trained network parameters. The numeric classification of putative promoter sequence is achieved via initial ANN parameters whose input node values are initialized to the mean pHMM score for their respective promoter motif, with zeroed hidden and output neuron initial values. Error backpropagation values involve a momentum term of 0.001 and a threshold of 0.1. The determination regarding the number of hidden neurons was achieved via plotting the effect neuron count had on positive-negative dataset discrimination. The discrimination measure was calculated via computing the mean hybrid score for 25 promoter and 25 non-promoter motifs. The desirable trait of distinguishing promoter from non-promoter versus the required number of hidden neurons to achieve the maximal discrimination is shown in Figure 3.
Figure 2.
pHMMs as input to three-layer ANN, shaded ‘UP’ element indicates this profiles inclusion at a later stage in the investigation.
Figure 3.
Effect of hidden neurons on dataset discrimination.
The decision to implement a five-neuron hidden layer was based on the experimental evidence as shown in Figure 3, whereby additional neurons provided limited discrimination advantage whilst five neurons maintained computational efficiency and discrimination ability. The plateau trends in discrimination via adding more hidden neurons, suggest five neurons represent a balance between discrimination ability and computational efficiency.
Hybrid model testing data was obtained from the NCBI GenBank database (22) and represented prokaryote rRNA other coding genomic sequences. Incrementally obtained results from core promoter identification discussed later in this paper led to the requirement of modelling an additional promoter component motif. The ‘UP’ element was chosen for its role in transcription and spatial proximity to the core promoter. Due to the limited annotation of such UP elements containing genomic sequences, all available sequences (in total 10) at the time of writing were chosen for the positive test dataset (Supplementary Data—‘UP element data’). The UP element motifs from these same sequences were used in generating the UP element pHMM. This lack of annotation regarding UP elements is a task upon which our model has the ability to contribute through sequence discovery. The retrieval of E.coli genomic sequences for the test dataset followed the previous signal scheme however now utilizing the specific feature ‘UP Element’, e.g. UP element AND−35_signal AND−10_signal
To contrast the known UP element promoter-containing genomic sequences, the NCBI GenBank database (22) was again utilized to retrieve 10 non-promoter containing sequences (Supplementary Data—Test Set).
The integration of pHMM with ANN is achieved via an aggregation scheme in the JAVA programming language.
RESULTS
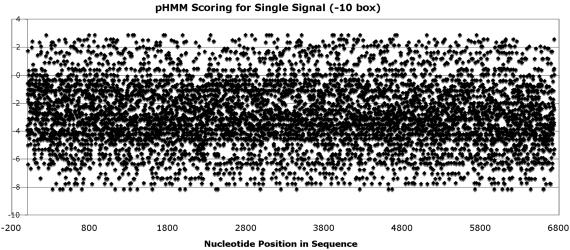
Motif identification classically suffers from a high degree of false positives. In terms of promoter elements such as the −10 or −35 elements, such a small motif is easily hidden in larger sequence backgrounds. Signal conservation is a major factor in locating signals. Prokaryote promoter signals are relatively conserved, however and on closer analysis the −35 box is significantly less conserved than its paired −10 box (refer scoring trends Figures 4 and 5). The problem lies in the fact that a 6 bp consensus −10 box does not possess sufficient information content to accurately distinguish it from the sequence background. ‘Boosting’ is a term used to aid in scoring but finding signals in the same locality is often exploited to great effect. On the promoter level, such surrounding signals are constrained to a very specific region and the conservation level introduces further complications. Using the classic prokaryote E.coli promoter as an example, a relatively weak −35 signal is followed by a stronger −10 signal. These signals have a 6 bp conserved length and therefore pose a significant challenge when locating a genomic sequence, contrast 250 bp considered as the default window (2) especially when coupled with lower conservation. To reiterate, there are three factors under consideration, (i) signal length, (ii) signal conservation, (iii) spacer length between signals. Signal length and composition have typically been modelled by position weight matrices (24) and HMMs (25,26). ANNs, whose major feature is association, have been used to model spacer length between the promoter signals (13). Acting alone, these techniques produce acceptable results on small background sequences—98% positive and 90.2% negative identification of the ANN approach (13) whilst the HMM approach of (25) yielded 74.1% accuracy.
Figure 4.
−35 Box HMM Scoring for Sequence AB102735.
Figure 5.
−10 Box HMM Scoring for Sequence AB102735.
Our approach firstly investigated the algorithms in isolation and then as a hybrid. When applying such singular techniques on large sequences, false positives severely limit the usefulness of the model, as indicated by the images shown in Figures 4 and 5.
Neither scoring outcome is useful in promoter recognition and thus concur with the prior findings of (1,2) regarding the number of false signals in the promoter region. Positive bars indicate a closer match to consensus whilst negative bars indicate poor matching. Figure 4 would additionally suggest much lower conservation of the −35 signal, a fact determined by others (11).
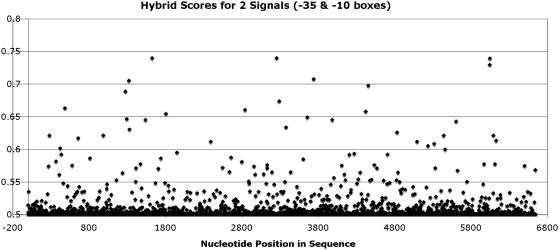
For the GenBank (22) sequence ‘AB102735’, Figures 4 and 5 show a high level of false positives. When the HMM results are placed in spatial context via the ANN, the number of false positives are reduced significantly, as seen in Figure 6 when compared with Figures 4 and 5. Whilst the hybrid model showed an improvement in lowering false predictions, it was not deemed a useful model in its current form, certainly not for large sequences as shown in Figure 6. The key concern centred on what it means to be a promoter and why there were so many false signals (scoring better than the real promoter elements). RNAP is a biological complex with specific binding ability, i.e. transcription initiation is not a random process. The biological neighbourhood therefore needed to be examined to place the true promoter in context of the genomic region. Biological reference was sought in the form of a conserved sequence that could aid in correct RNAP targeting to the true promoter. Our focus centred on the rRNA coding genes due the realization that these genes contained regulatory elements termed ‘UP elements’ located up to 82 bp upstream of the TSS. This element is recognized by the α
| 3 |
| 4 |
| 5 |
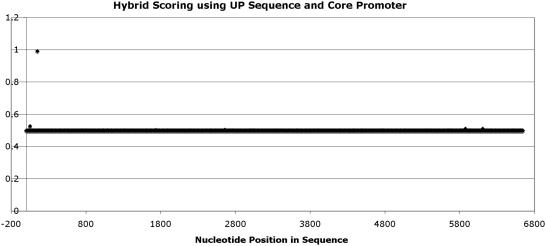
subunit of the RNAP (27). By training a pHMM and incorporating it into the ANN, the results as shown in Figure 7, were accurate and displayed excellent discrimination ability. As seen in Figure 7, there is only one prediction in the >6500 bp sequence, the prediction being the true promoter. This is a highly significant achievement when compared with HMMs used in isolation (Figures 4 and 5) and in part the ANN result shown Figure 6 (Supplementary Data—Results).
Figure 6.
pHMM-ANN Hybrid scoring for AB102735.
Figure 7.
ANN-HMM Hybrid scoring ‘using Up elements’ AB102735.
To place this result in context for future research in this area of genomic context promoter identification, the following is a summary of the results achieved in this study as compared with existing promoter identification tools: NNPP version 2.2 (20) based on ANN and SAK (21) based on support vector machines. The test data comprised of 20 sequences: 10 containing prokaryote promoters and 10 containing no prokaryote promoter. All the sequences were sourced from the NCBI GenBank (22) using query sequences inline with prior examples as stated previously (Supplementary Data—Test Set).
The 20 sequence test set represented an average sequence length of 3667 bp including genomic sequences of Sinorhizobium meliloti, Agrobacterium tumefaciens, Azospirillum brasilense, Shewanella violacea and E.coli. Performance measures as per Tables 1 and 2.
Table 1.
Data summary
| Method | TP | TN | FP | FN |
|---|---|---|---|---|
| NNPP | 4 | 1 | 15 | 6 |
| SAK | 4 | 3 | 13 | 6 |
| Hybrid | 7 | 10 | 2 | 3 |
FP, false positive: non-promoter predicted as promoter.
FN, false negative: promoter predicted as non-promoter.
Sn, sensitivity: proportion of true promoters correctly identified as promoters as given in Equation 3.
Sp, specificity: proportion of non-promoters predicted as non-promoters as given in Equation 4.
P, precision: proportion of promoter predictions being true promoters as given in Equation 5.
Table 2.
Performance measure comparison
| Method | Sn | Sp | P |
|---|---|---|---|
| NNPP | 0.4 | 0.0625 | 0.210526316 |
| SAK | 0.4 | 0.1875 | 0.235294118 |
| pHMM-ANN hybrid | 0.700 | 0.833 | 0.777 |
FP, false positive: non-promoter predicted as promoter.
FN, false negative: promoter predicted as non-promoter.
Sn, sensitivity: proportion of true promoters correctly identified as promoters as given in Equation 3.
Sp, specificity: proportion of non-promoters predicted as non-promoters as given in Equation 4.
P, precision: proportion of promoter predictions being true promoters as given in Equation 5.
The results highlight the discrimination ability of the hybrid approach, hence justify the decision to combine pHMM and ANNs via a Viterbi integration which produces a clear improvement over the current tools. Performance measures followed the commonly accepted approaches as defined below.
DISCUSSION
False positives are a significant disadvantage to many algorithms in motif extraction. By combining the modelling ability of pHMMs with the associative learning capability of the ANN, this architecture serves to address this important issue. When placed in the context of previous research, our approach extends beyond current techniques via the implemented hybrid architecture and the application target, genomic context promoter identification. We therefore do not require explicit search windows to carry out analysis. Alone, each technique of HMM or ANN has long been used in promoter identification, the majority of which centre around identification of the conserved −35 and −10 hexamers. Our approach differs from other studies on molecule type and topology. At the time of writing, this hybrid approach to genomic promoter identification is considered novel to the best of our research. The trend observed in our research indicates that scoring such small motifs in isolation results in a negative effect on prediction. Even when combined into an ANN, the −35 and −10 signals were not significant enough to provide a useful model. The key focus in overcoming this problem was to concentrate on the biological purpose of the promoter and understand why so many false signals exist. By studying the neighbourhood and the properties of the RNAP, we were able to achieve a result that sets our scoring model apart from previous works in terms of discrimination ability at such large genomic contexts. Our model has the power to predict the correct promoter element in a >6500 bp segment of genomic data with virtually no competing false signals, an achievement that other approaches cited in this paper have failed to accomplish. For the GenBank (22) sequence ‘AB102735’, the NNPP (20) algorithm produced 21 predictions and the SAK (21) method 24 predictions above default (0.8-NNPP) and reasonable thresholds (0.5-SAK). By contrast, the hybrid model produced one prediction which located the promoter correctly.
This achievement is facilitated by the discovery whereby the Viterbi algorithm provides beneficial discrimination ability to the pHMM component of the hybrid. We are therefore confident that our model extends the state-of-the-art in model design for promoter recognition and delivers greater discrimination for promoter prediction in genomic contexts.
SUPPLEMENTARY DATA
Supplementary Data are available at NAR online.
Acknowledgments
The work in this paper was partially supported by Australian Research Council Grants LP0349235 and LX0560616. Funding to pay the Open Access publication charges for this article was provided by Australian Research Council Grants and Faculty of Science and Technology Deakin University.
Conflict of interest statement. None declared.
REFERENCES
- 1.Hertz G.Z., Stormo G.D. Escherichia coli promoter sequences: analysis and prediction. Meth. Enzymol. 1996;273:30–42. doi: 10.1016/s0076-6879(96)73004-5. [DOI] [PubMed] [Google Scholar]
- 2.Huerta A.M., Collado-Vides J. Sigma70 promoters in Escherichia coli: specific transcription in dense regions of overlapping promoter-like signals. J. Mol. Biol. 2003;333:261–278. doi: 10.1016/j.jmb.2003.07.017. [DOI] [PubMed] [Google Scholar]
- 3.Reznikoff W.S., Bertrand K., Donnelly C., Krebs M., Maquat L.E.,, Peterson M., Wray L., Yin J., Yu X.M. Complex Promoters. New York: Elsevier; 1987. [Google Scholar]
- 4.Richet E., Sogaard-Anderson L. CRP induces the repositioning of MalT at the Escherichia coli malKp promoter primarily through DNA bending. EMBO J. 1994;13:4558–4567. doi: 10.1002/j.1460-2075.1994.tb06777.x. [DOI] [PMC free article] [PubMed] [Google Scholar]
- 5.Durbin R., Eddy S., Krogh A., Mitchison G. Biological Sequence Analysis. UK: Cambridge University Press; 2000. [Google Scholar]
- 6.Ussery D., Larsen T.S., Wilkes K.T., Friis C., Worning C., Krogh A., Brunak S. Genome organisation and chromatin structure in Escherichia coli. Biochimie. 2001;83:201–212. doi: 10.1016/s0300-9084(00)01225-6. [DOI] [PubMed] [Google Scholar]
- 7.Baldi P., Chauvin Y., Hunkapiller T., McClure M. Hidden Markov models of biological primary sequence information. Proc. Natl Acad. Sci. USA. 1994;91:1059–1063. doi: 10.1073/pnas.91.3.1059. [DOI] [PMC free article] [PubMed] [Google Scholar]
- 8.Grundy W.N., Bailey T.L., Elkan C.P., Baker M.E. Meta-MEME: Motif-based Hidden Markov Models of Protein Families. Comput. Appl. Biosci. 1997;13:397–406. doi: 10.1093/bioinformatics/13.4.397. [DOI] [PubMed] [Google Scholar]
- 9.Krogh A., Mian I.S., Haussler D.A. A hidden Markov model that finds genes in E.coli DNA. Nucleic Acids Res. 1994;22:4768–4778. doi: 10.1093/nar/22.22.4768. [DOI] [PMC free article] [PubMed] [Google Scholar]
- 10.Pachter L., Alexandersson M., Cawley S. Applications of generalized pair hidden markov models to alignment and gene finding problems. J. Comput. Biol. 2002;9:389–399. doi: 10.1089/10665270252935520. [DOI] [PubMed] [Google Scholar]
- 11.Pedersen A.G., Engelbrecht J. Proceedings, Third International Conference on Intelligent Systems for Molecular Biology (ISMB95) AAAI Press; 1995. Investigations of Escherichia coli promoter sequences with artificial neural networks: new signals discovered upstream of the transcriptional startpoint; pp. 292–299. [PubMed] [Google Scholar]
- 12.Demeler B., Zhou G. Neural network optimization for E.coli promoter prediction. Nucleic Acids Res. 1991;19:1593–1599. doi: 10.1093/nar/19.7.1593. [DOI] [PMC free article] [PubMed] [Google Scholar]
- 13.Mahadevan I., Ghosh I. Analysis of E.coli promoter structures using neural networks. Nucleic Acids Res. 1994;22:2158–2165. doi: 10.1093/nar/22.11.2158. [DOI] [PMC free article] [PubMed] [Google Scholar]
- 14.O'Neil M. Escherichia coli promoters: neural networks develop distinct descriptions in learning to search for promoters of different spacing classes. Nucleic Acids Res. 1992;20:3471–3477. doi: 10.1093/nar/20.13.3471. [DOI] [PMC free article] [PubMed] [Google Scholar]
- 15.Kalate R.N., Tambe S.S., Kulkarni B.D. Artificial neural networks for prediction of mycobacterial promoter sequences. Comput. Biol. Chem. 2003;27:555–564. doi: 10.1016/j.compbiolchem.2003.09.004. [DOI] [PubMed] [Google Scholar]
- 16.Bourlard H.A., Morgan N. Connectionist Speech Recognition: A Hybrid Approach. MA, USA: Norwell; 1993. [DOI] [PubMed] [Google Scholar]
- 17.Lin K., Simossis V.A., Taylor W.R., Heringa J. A simple and fast secondary structure prediction method using hidden neural networks. Bioinformatics. 2005;21:152–159. doi: 10.1093/bioinformatics/bth487. [DOI] [PubMed] [Google Scholar]
- 18.Sgourakis N.G., Bagos P.G., Hamodrakas S.J. Prediction of the coupling specificity of GPCRs to four families of G-proteins using hidden Markov models and artificial neural networks. Bioinformatics. 2005;21:4101–4106. doi: 10.1093/bioinformatics/bti679. [DOI] [PubMed] [Google Scholar]
- 19.Martelli P.L., Fariselli P., Casadio R. An ENSEMBLE machine learning approach for the prediction of all-alpha membrane proteins. Bioinformatics. 2005;19:205–211. doi: 10.1093/bioinformatics/btg1027. [DOI] [PubMed] [Google Scholar]
- 20.Reese M. Application of a time-delay neural network to promoter annotation in the Drosophila melanogaster genome. Comput. Chem. 2001;26:51–56. doi: 10.1016/s0097-8485(01)00099-7. [DOI] [PubMed] [Google Scholar]
- 21.Gordon L., Chervonenkis A.Y., Gammerman A.J., Shahmuradov I.A., Solovyev V.V. Sequence alignment kernel for recognition of promoter regions. Bioinformatics. 2003;19:1964–1971. doi: 10.1093/bioinformatics/btg265. [DOI] [PubMed] [Google Scholar]
- 22.Benson D., Karsch-Mizrachi I., Lipman D., Ostell J., Wheeler D. GenBank. Nucleic Acids Res. 2005;33:34–38. doi: 10.1093/nar/gki063. [DOI] [PMC free article] [PubMed] [Google Scholar]
- 23.Chenna R., Sugawara H., Koike T., Lopez R., Gibson T.J., Higgins D.G., Thompson J.D. Multiple sequence alignment with the Clustal series of programs. Nucleic Acids Res. 2003;31:3497–3500. doi: 10.1093/nar/gkg500. [DOI] [PMC free article] [PubMed] [Google Scholar]
- 24.Staden R. Computer methods to locate signals in nucleic acid sequences. Nucleic Acids Res. 1984;12:505–519. doi: 10.1093/nar/12.1part2.505. [DOI] [PMC free article] [PubMed] [Google Scholar]
- 25.Jian-Cheng L., Jin-Lin X., Jian-Hua L., Yi-Xue L. Prediction of prokaryotic promoters based on prediction of transcription units. Acta Biochimica et Biophysica Sinica. 2003;35:317–324. [PubMed] [Google Scholar]
- 26.Pedersen A.G., Baldi P., Brunak S., Chauvin Y. Characterization of prokaryotic and eukaryotic promoters using hidden Markov models. Proc. Int. Conf. Intell. Syst. Mol. Biol. 1996;4:182–191. [PubMed] [Google Scholar]
- 27.Ross W., Gosink K.K., Salomon J., Igarashi K., Zou C., Ishi-hama A., Severinov K., Gourse R.L. A third recognition element in bacterial promoters: DNA-binding by the alpha subunit of RNA polymerase. Science. 1993;262:1407–1413. doi: 10.1126/science.8248780. [DOI] [PubMed] [Google Scholar]


