Abstract
RNA-cleaving deoxyribozyme 8-17 has been increasingly used in nanotechnology and biosensing applications. Conventional methods to equip 8-17 with fluorescent signaling property usually involve covalent attachment of two dyes at nucleotide positions that are far away from the catalytic core, such that the bulky dye structures would not affect the deoxyribozyme activity. However, the maximum fluorescent enhancement associated with these 8-17 constructs is typically ≤10-fold, due to a high fluorescent background. To find an optimal balance between signal enhancement and signaling speed, we have conducted a comprehensive study on the effects of the nature of dyes (Alexa Fluor 488, 546 and 647; QSY 9 and 21) as well as their attaching positions along the substrate strand on the catalytic and signaling performance of 8-17. Our results have indicated that 8-17 is able to cleave almost every modified substrate, including those that have chromophores only 1 nt away from the cleavage site. Most importantly, almost all of these substrates are able to generate 15- to 85-fold signal enhancement within 10 min. We have also provided guidelines for selecting substrates that could offer the best signal enhancement, the fastest signaling speed, or the best balance between signal enhancement and signaling speed.
INTRODUCTION
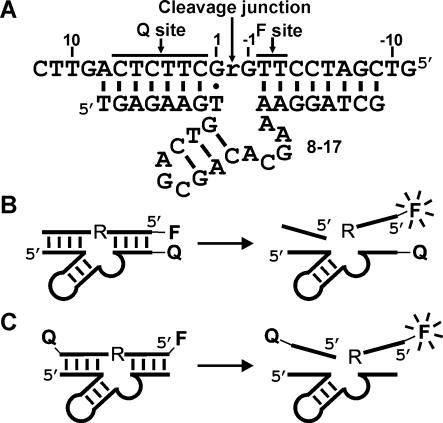
Deoxyribozymes are catalytic DNA oligonucleotides (1,2) derived by in vitro selection (3,4). They are not only convenient models for studying nucleic acid catalysis, but are also suited for biotechnological applications. The advantages offered by catalytic DNAs include high chemical stability (5), low cost of synthesis and ease of modification. One catalytic DNA that has frequently been investigated in developing biosensors (6–11), chemotherapeutics (12,13), computational devices (14–16) and RNA-manipulation tools (17) is a small RNA-cleaving deoxyribozyme named 8-17 (18). The versatility of 8-17 is attributed to (i) its small size of ∼30 nt (Figure 1A), (ii) its adaptability in using various divalent metal ions as co-factors (18–21), (iii) its ability to cleave multiple dinucleotide junctions (22), and (iv) its flexibility in accepting sequence or chemical modifications (8,13,16,18). Our goal here is to expand the versatility of 8-17 in the fields of fluorescence-based biosensing and nanotechnology by establishing 8-17 based signaling platforms with large signaling magnitudes and a broad emission wavelength coverage.
Figure 1.
Various designs of fluorogenic 8-17 deoxyribozyme. (A) Substrates internally labeled with F and Q. The top strand is the chimeric DNA/RNA substrate in which the lone RNA phosphodiester linkage is denoted as ‘r’. Substrate nucleotides are numbered with respect to ‘r’ as indicated. 8-17 is made up of a 15 nt catalytic core flanked by two substrate-binding arms that form Watson–Crick interactions (small vertical lines) with the substrate. Dot denotes an essential G–T wobble interaction. (B) F and Q are at the opposing termini of substrate and 8-17. (C) F and Q are at either end of the substrate.
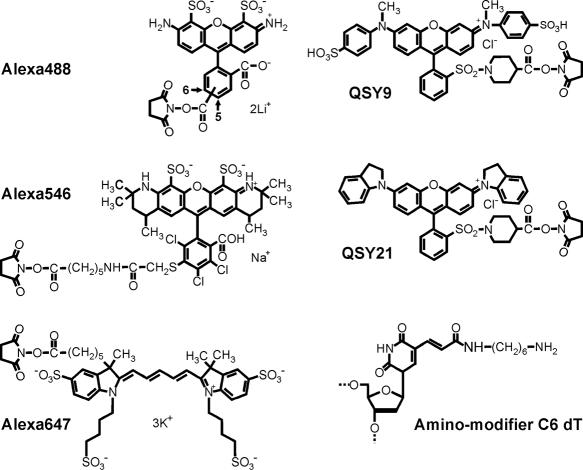
There are two general methods to report the cleavage activity of 8-17 by fluorescence signaling. One entails the tagging of substrate and deoxyribozyme at opposing termini with a fluorophore (F) and a quencher (Q), which places F adjacent to Q when the deoxyribozyme binds the substrate [Figure 1B; (8)]. The other involves the attachment of F and Q at either end of the substrate [Figure 1C; (16)]. In the first system, the close proximity of F and Q, when the deoxyribozyme binds the substrate, can lead to fluorescence increase upon RNA cleavage. However, a high background signal can result because a fraction of fluorophore-labeled substrates is not associated with the deoxyribozyme strands. On the contrary, the second system does not have the deoxyribozyme/substrate association problem as both F and Q are situated on the same oligonucleotide strand. Nevertheless, a separating distance of 15–20 nt between F and Q usually renders inefficient fluorescence-quenching (23), resulting in small signal enhancement upon catalysis. Similar strategies have also been applied to equip other RNA-cleaving nucleic acid enzymes with fluorescence-signaling properties (24–27). Yet, the maximum signal enhancement that could be attained (including that of 8-17) was typically ≤10-fold (8,24–27), which is not ideal for sensitive and highly quantitative detection. One way to improve the signaling magnitude of doubly labeled substrates (Figure 1C) for deoxyribozymes such as 8-17 is to move F and Q closer to the cleavage site. However, this operation may significantly compromise the catalytic performance of deoxyribozymes due to steric hindrance to the folding of their catalytic cores caused by the bulky F and Q. In an effort to find the best balance between shortening the F-Q distance and maintaining the catalytic efficiency of 8-17, we examined 36 chimeric DNA/RNA substrates that have a common sequence context but are internally labeled at various sites (Figure 1A) with one of the three Alexa Fluor (AF)–QSY pairs: AF488–QSY9, AF546–QSY9 and AF647–QSY21 (see Figure 2 for chemical structures of these dye moieties). We chose to use AFs because (i) the wide variety of AFs spanning the visible and infrared spectrum allows us to develop a series of different probes for future multiplexing possibility, and (ii) they exhibit excellent emission intensity and photostability when conjugated to a biomolecule such as DNA (28,29).
Figure 2.
Chemical structures of Alexa fluorophores, QSY quenchers and modified nucleotides. The chemical structure of Alexa647 was adopted from Terpetschnig, E. A.; Patsenker, L. D.; Tatarets, A. US Patent Application No. 20040166515, August 26, 2004. The structure of amino-modifier C6 dC is not shown for brevity, as it is essentially the same as amino-modified dT, except for the nucleobase component.
MATERIALS AND METHODS
Oligonucleotide preparation
Standard oligonucleotides and those containing amino modifier C6 dC or dT were prepared by solid-phase synthesis (Integrated DNA Technologies; Keck Biotechnology Resource Laboratory, Yale University; MOBIX, McMaster University). All the oligonucleotides were purified by 10% denaturing PAGE before use. Conjugation of amino-modified oligonucleotides with the dyes followed the manufacturer's protocol (Molecular probes). Dye-labeled oligonucleotides were isolated by 20% denaturing PAGE and quantified UV spectroscopically, using the following formula (Molecular probes): actual A260 = observed A260 − (CF260 × Amax). CF260 (correction factor for A260) and the wavelength for maximum absorption for each dye are 0.3 and 495 nm (AF488), 0.21 and 556 nm (AF546), 0.21 and 562 nm (QSY9), and 0.19 and 661 nm (QSY21). Correction for oligonucleotides labeled with AF647 was not necessary as its A260 = 0. To prepare the substrates, 1 μM fluorophore-labeled donors (5′-GTCGATCCTTrG-3′; dye-labeled region is underlined) were annealed to 1.07 μM 5′-32P-labeled acceptors (5′-GCTTCTCAGTTC-3′) that carried the quenchers, using 1 μM DNA splint and 0.1 U/μl T4 DNA ligase (MBI Fermentas). The ligated products were purified by 10% denaturing PAGE and quantified by comparing their radioactivity with that of the relevant acceptor. Three independent 32P-counts of individual oligonucleotides were performed using a scintillation counter, and the averages were used to determine their concentrations.
Fluorescence detection
Substrates (3 nM) and relevant deoxyribozymes (1 μM) were mixed in 50 mM HEPES (pH 7.5) and 150 mM KCl in a fluorescence cuvette. The mixture was incubated at 37°C for at least 5 min in a Cary Eclipse Fluorescence Spectrophotometer (Varian) before signal was recorded. For substrates labeled with AF488, the excitation (Ex) and emission (Em) wavelengths were set at 495 and 519 nm, respectively. For AF546, Ex = 556 nm and Em = 573 nm; AF647, Ex = 650 nm and Em = 668 nm. A mixture of MgCl2 and MnCl2 was added to a final concentration of 10 and 4 mM, correspondingly, to trigger the cleavage reaction. Fluorescence signals were recorded every minute at 800 V for 2 h. Background signals were determined from the fluorescence outputs of 50 mM HEPES (pH 7.5) and 150 mM KCl solution and subtracted from the sample readings before F/Fo was computed.
RESULTS AND DISCUSSION
Substrate preparation
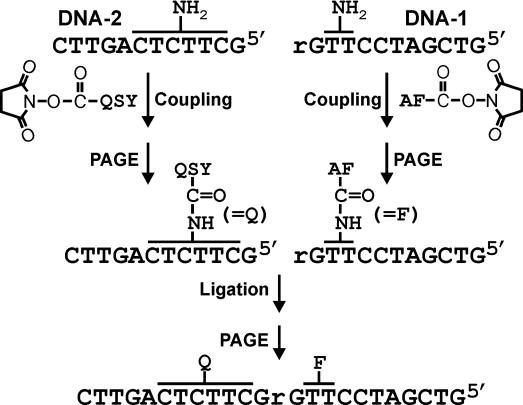
To prepare the substrates (Figure 3), an AF fluorophore was first coupled to DNA-1 (ribo-terminated oligonucleotides) at one of the two amine-modified sites via succinimidyl-ester chemistry, whereas the relevant QSY quencher was coupled to a primary amine group at one of the six specified positions in DNA-2. The labeled oligonucleotides were purified by denaturing PAGE. Each DNA-2 was then 32P-labeled at its 5′-end and annealed to a relevant DNA-1 in the presence of T4 DNA ligase and a DNA template. The ligated products were isolated by denaturing PAGE and quantified by comparing their radioactivity with that of a related DNA-2 whose concentration was determined spectroscopically (see Materials and Methods for details). It is noteworthy that this quantifying method was implemented because it is unclear whether the extinction coefficients at 260 nm of F and Q would vary when they are placed close to each other. It should also be noted that the 8-17 deoxyribozyme employed in this study (Figure 1A) has a catalytic core equivalent to that of E1111 (22), given that there are many versions of 8-17 reported in the literature (18,19,21,22).
Figure 3.
Substrate preparation. See text for details.
Fluorescence assays of RNA-cleavage reactions
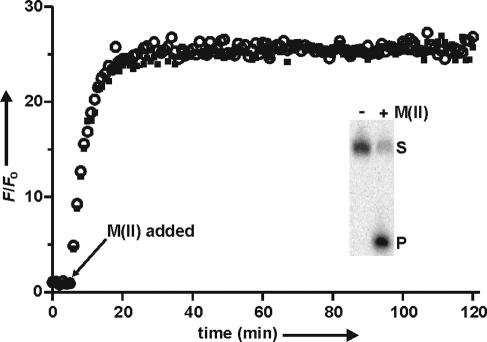
Fluorescence assays were conducted under single-turnover conditions with 3 nM substrates (S) and 1 μM 8-17 deoxyribozymes. Fluorescent signals were monitored every minute for 2 h with the wavelength parameters set accordingly to the substrates used (see Materials and Methods). The DNA mixture was first incubated in 50 mM HEPES (pH 7.5) and 150 mM KCl at 37°C for 5 min before adding Mg2+ and Mn2+ [abbreviated as ‘M(II)'] to the final concentrations of 10 and 4 mM, respectively, to initiate the cleavage reaction. The data obtained using the substrate containing AF488 at position −2 and QSY9 at +2 are shown in Figure 4 as a representative signaling profile. A signal enhancement (F/Fo; F, fluorescent readings; Fo, an average signal during the first 5 min of the fluorescence monitoring) was observed upon the addition of M(II). This signal increase was only observed in the presence of 8-17 (data not shown). We also performed the denaturing PAGE analysis of each reaction mixture and found that each substrate was indeed cleaved as expected (Figure 4, inset), which strongly indicates that the increase in fluorescence was derived from the RNA cleavage reaction.
Figure 4.
Fluorescence assays of the cleavage reactions that contained substrates with AF488 labeled at −2 and QSY9 at +2. A mixture of Mg2+ and Mn2+ [abbreviated as ‘M(II)'] was added after the fifth minute to trigger the reactions. Open circles and closed squares indicate the signal variation (F/Fo) derived from two independent cleavage reactions that contained 8-17 deoxyribozyme. Inset shows the phosphorimage of the reaction products separated by denaturing PAGE after ∼2 h incubation with and without the divalent metal ions. S, substrate; P, cleavage product.
Catalytic and signaling performance of 8-17 associated with each different substrate
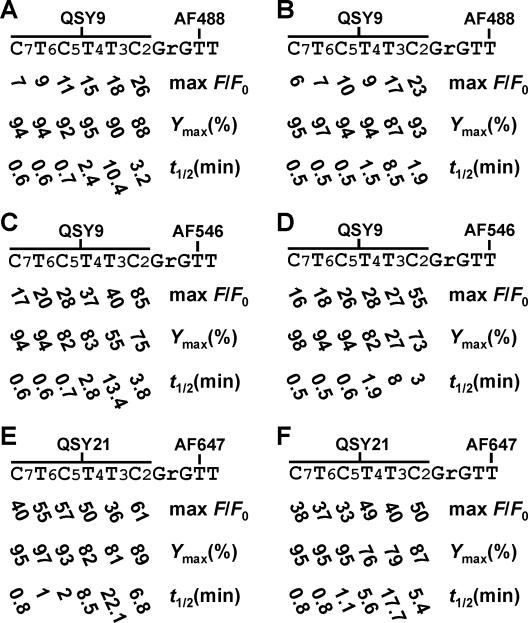
The data in Figure 4 were then used to compute max F/Fo (maximum fluorescence enhancement), Ymax (maximum cleavage yield) and t1/2 (the time required to reach half of the signaling plateau) in order to assess the catalytic and signaling performance of 8-17 coupled with the dye-labeled substrates. In total, 36 substrates were synthesized and examined. These substrates were categorized into six groups (Figure 5), each of which shares a common fluorophore attached to a particular nucleotide upstream of the cleavage site and a matching quencher placed on a nucleotide downstream of the cleavage junction that is 2-7 nucleotides away from the fluorophore-labeling region.
Figure 5.
(A–F) The cleavability of fluorogenic substrates by 8-17 and the associated fluorescence enhancement. Each value represents the average of at least two independent experiments with an error of <10%.
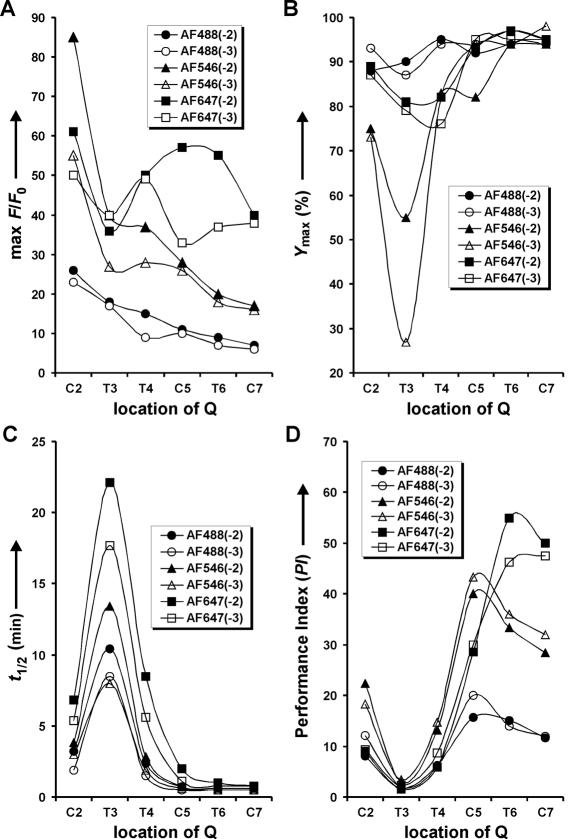
To provide a more explicit analysis of each parameter in a particular substrate series, the data in Figure 5 are re-organized into Figure 6A–C, which reveals several trends and exceptions described below.
As expected, the highest max F/Fo in each of the six substrate groups is the one with F and Q separated by the least number of nucleotides [Figure 6A, F(−2 or −3) and Q(+2)].
Although max F/Fo generally increases when Q is moved toward the cleavage junction in the two AF488–QSY9 series, this trend is less obvious in the other substrate series, owing to a drop in max F/Fo at T3 (Figure 6A).
Small variations on the y-axis between filled (AF488 at −2) and open circles (AF488 at −3) in Figure 6A indicate that max F/Fo is not drastically affected by the position of F in the AF488–QSY9 series. However, for the other series, this trend no longer holds as revealed by the large differences in max F/Fo (Δ max F/Fo) between the substrates with F at −2 and those with F at −3. In AF546–QSY9 series, F(−2) generated better max F/Fo than F(−3) when Q was located at +2, +3 or +4 (Δ max F/Fo = 30, 13, 9, respectively). Similarly in the AF647–QSY21 series, Δ max F/Fo of 11, 24, 18 was resulted when Q was attached at +2, +5 or +6, respectively. Note that Δ max F/Fo is a subtraction between two max F/Fo values.
Most of the examined substrates are well suited for the 8-17 deoxyribozyme in terms of their cleavability within 2 h (Ymax; Figure 6B). All the substrates labeled with the AF488–QSY9 pair could achieve a Ymax close to or above 90%. The majority of substrates labeled with the other two F–Q pairs could also achieve a high Ymax ranging from 73 to 98%. The only two exceptions are the substrates with QSY9 at +3 and AF546 at −2 and −3, as they could be cleaved only to 55 and 27%, respectively. This suggests that the combination of QSY9 at +3 and AF546 at −2 or −3 exerts a profound negative impact on the folding of 8-17.
The t1/2 value generally increases if F or Q is located closer to the cleavage junction, albeit to a smaller extent when Q is attached at +5, +6 or +7 (Figure 6C). One of the exceptions in this trend is when Q is attached at +3. As clearly shown in Figure 6C, t1/2 at T3 is much higher than any other position in each substrate series. This indicates that Q at +3 severely hinders the catalytic performance of 8-17 regardless of the quencher types examined here. Another exception occurs in the AF647–QSY21 series, wherein Q has a more detrimental influence on t1/2 not only at position +3 but also at +4, as the t1/2 values associated with Q at +4 are higher than those with Q at +2.
The negative effects of both F and Q on t1/2 are more obvious when Q is incorporated at +3. The magnitude of such effects increases, based on the type and position of F, in the order of AF488(−3) or AF546(−3), AF488(−2), AF546(−2), AF647(−3) and AF647(−2).
Figure 6.
Signaling performance of 8-17 coupled with different fluorogenic substrates. PI is an arbitrary value derived from max F/Fo • 1/t1/2.
The trends and exceptions revealed by the data shown in Figure 6A–C might be explained by the following notions: (i) given the fact that F and Q are composed of several aromatic rings and thus are bulky, placing them progressively closer to the cleavage site would generate more steric interference to the catalytic core of 8-17. Consequently, an increasing fraction of the deoxyribozyme/substrate complexes is prevented from folding into the catalytically active state (resulting in Ymax reduction). With the same rationale, some of these complexes might be trapped in a conformation less optimal than the native structure, and necessitate an additional time for structural rearrangement in order to carry out catalysis (thus an increase in t1/2). (ii) 8-17 may organize itself into a tertiary structure that has little room to accommodate a bulky attachment at +3 and, to a lesser degree, at +2 and +4. Therefore, the incorporation of a quencher at these locations brings about the most detrimental effect on the folding of the deoxyribozyme. However, it is also possible that the dyes may affect the catalytic mechanism of 8-17 by interacting with the nucleotide residues that participate in catalysis.
In view of the respectable max F/Fo and t1/2 accompanied with nearly all the examined substrates [except the ones with Q(+3)], one could easily design a doubly labeled fluorogenic substrate for 8-17 with the F and Q positions specified according to the desired signaling performance. For the highest max F/Fo, the substrate with F(−2) and Q(+2) in each F–Q pair should be used. However, if fast signaling kinetics is most desirable for the application of interest, the substrate of choice should be guided by the t1/2 values instead. In this regard, the substrate with the smallest t1/2 for each F–Q pair is AF488(−3)–QSY9(+5), AF546(−3)–QSY9(+6) and AF647(−2)–QSY21(+7). Please note that several substrates with the same F–Q pair might share very similar minimal t1/2 value (Figure 5). Hence, only the ones with higher max F/Fo are highlighted here.
To provide a better guidance for selecting a substrate that offers a balance between the signal enhancement and signaling speed, we have defined an arbitrary parameter termed ‘performance index' by dividing max F/Fo over t1/2 (Figure 6D). By this data treatment, the substrate having the highest PI for each F–Q pair is determined to be AF488(−3)–QSY9(+5), AF546(−3)–QSY9(+5) and AF647(−2)–QSY21(+6), respectively.
In conclusion, we have successfully obtained efficient fluorescence-signaling platforms composed of the small RNA-cleaving deoxyribozyme 8-17 and a series of cleavable substrates internally labeled with an F–Q pair. Our results have also revealed that 8-17 can accommodate bulky dyes on most of the nucleotide positions along the substrate strand. Most importantly, the discovery that many of these substrates were able to generate 15- to 85-fold signal enhancement within 10 min will certainly attract many interests in further exploitation of 8-17 to develop better biosensors and nanodevices.
Acknowledgments
This work was supported by a research grant from the Canadian Institutes for Health Research. Y.L. is a Canada research chair. Funding to pay the Open Access publication charges for this article was provided by Canadian Institutes for Health Research.
Conflict of interest statement. None declared.
REFERENCES
- 1.Joyce G.F. Directed evolution of nucleic acid enzymes. Annu. Rev. Biochem. 2004;73:791–836. doi: 10.1146/annurev.biochem.73.011303.073717. [DOI] [PubMed] [Google Scholar]
- 2.Achenbach J.C., Chiuman W., Cruz R.P., Li Y. DNAzymes: from creation in vitro to application in vivo. Curr. Pharm. Biotechnol. 2004;5:321–336. doi: 10.2174/1389201043376751. [DOI] [PubMed] [Google Scholar]
- 3.Ellington A.D., Szostak J.W. In vitro selection of RNA molecules that bind specific ligands. Nature. 1990;346:818–822. doi: 10.1038/346818a0. [DOI] [PubMed] [Google Scholar]
- 4.Tuerk C., Gold L. Systematic evolution of ligands by exponential enrichment: RNA ligands to bacteriophage T4 DNA polymerase. Science. 1990;249:505–510. doi: 10.1126/science.2200121. [DOI] [PubMed] [Google Scholar]
- 5.Li Y., Breaker R.R. Kinetics of RNA degradation by specific base catalysis of transesterification involving the 2′-hydroxyl group. J. Am. Chem. Soc. 1999;121:5364–5372. [Google Scholar]
- 6.Wang D.Y., Lai B.H., Sen D. A general strategy for effector-mediated control of RNA-cleaving ribozymes and DNA enzymes. J. Mol. Biol. 2002;318:33–43. doi: 10.1016/S0022-2836(02)00046-3. [DOI] [PubMed] [Google Scholar]
- 7.Wang D.Y., Lai B.H., Feldman A.R., Sen D. A general approach for the use of oligonucleotide effectors to regulate the catalysis of RNA-cleaving ribozymes and DNAzymes. Nucleic Acids Res. 2002;30:1735–1742. doi: 10.1093/nar/30.8.1735. [DOI] [PMC free article] [PubMed] [Google Scholar]
- 8.Li J., Lu Y. A highly sensitive and selective catalytic DNA biosensor for lead ions. J. Am. Chem. Soc. 2000;122:10466–10467. [Google Scholar]
- 9.Liu J., Lu Y. Adenosine-dependent assembly of aptazyme-functionalized gold nanoparticles and its application as a colorimetric biosensor. Anal. Chem. 2004;76:1627–1632. doi: 10.1021/ac0351769. [DOI] [PubMed] [Google Scholar]
- 10.Liu J., Lu Y. Accelerated color change of gold nanoparticles assembled by DNAzymes for simple and fast colorimetric Pb2+ detection. J. Am. Chem. Soc. 2004;126:12298–12305. doi: 10.1021/ja046628h. [DOI] [PubMed] [Google Scholar]
- 11.Achenbach J.C., Nutiu R., Li Y. Structure-switching allosteric deoxyribozymes. Anal. Chim. Acta. 2005;534:41–52. [Google Scholar]
- 12.Chakraborti S., Banerjea A.C. Identification of cleavage sites in the HIV-1 TAR RNA by 10-23 and 8-17 catalytic motif containing DNA enzymes. Biomacromolecules. 2003;4:568–571. doi: 10.1021/bm025698i. [DOI] [PubMed] [Google Scholar]
- 13.Liu Y., Sen D. Light-regulated catalysis by an RNA-cleaving deoxyribozyme. J. Mol. Biol. 2004;341:887–892. doi: 10.1016/j.jmb.2004.06.060. [DOI] [PubMed] [Google Scholar]
- 14.Stojanovic M.N., Mitchell T.E., Stefanovic D. Deoxyribozyme-based logic gates. J. Am. Chem. Soc. 2002;124:3555–3561. doi: 10.1021/ja016756v. [DOI] [PubMed] [Google Scholar]
- 15.Stojanovic M.N., Stefanovic D. Deoxyribozyme-based half-adder. J. Am. Chem. Soc. 2003;125:6673–6676. doi: 10.1021/ja0296632. [DOI] [PubMed] [Google Scholar]
- 16.Lederman H., Macdonald J., Stefanovic D., Stojanovic M.N. Deoxyribozyme-based three-input logic gates and construction of a molecular full adder. Biochemistry. 2006;45:1194–1199. doi: 10.1021/bi051871u. [DOI] [PubMed] [Google Scholar]
- 17.Silverman S.K. In vitro selection, characterization, and application of deoxyribozymes that cleave RNA. Nucleic Acids Res. 2005;33:6151–6163. doi: 10.1093/nar/gki930. [DOI] [PMC free article] [PubMed] [Google Scholar]
- 18.Santoro S.W., Joyce G.F. A general purpose RNA-cleaving DNA enzyme. Proc. Natl Acad. Sci. USA. 1997;94:4262–4266. doi: 10.1073/pnas.94.9.4262. [DOI] [PMC free article] [PubMed] [Google Scholar]
- 19.Li J., Zheng W., Kwon A.H., Lu Y. In vitro selection and characterization of a highly efficient Zn(II)-dependent RNA-cleaving deoxyribozyme. Nucleic Acids Res. 2000;28:481–488. doi: 10.1093/nar/28.2.481. [DOI] [PMC free article] [PubMed] [Google Scholar]
- 20.Peracchi A. Preferential activation of the 8-17 deoxyribozyme by Ca2+ ions. Evidence for the identity of 8-17 with the catalytic domain of the Mg5 deoxyribozyme. J. Biol. Chem. 2000;275:11693–11697. doi: 10.1074/jbc.275.16.11693. [DOI] [PubMed] [Google Scholar]
- 21.Faulhammer D., Famulok M. The Ca2+ ion as a cofactor for a novel RNA-cleaving deoxyribozyme. Angew. Chem. Int. Ed. Engl. 1996;35:2837–2841. [Google Scholar]
- 22.Cruz R.P., Withers J.B., Li Y. Dinucleotide junction cleavage versatility of 8-17 deoxyribozyme. Chem. Biol. 2004;11:57–67. doi: 10.1016/j.chembiol.2003.12.012. [DOI] [PubMed] [Google Scholar]
- 23.Förster T. Intermolecular energy migration and fluorescence. Ann. Phys. 1948;2:55–75. [Google Scholar]
- 24.Perkins T.A., Wolf D.E., Goodchild J. Fluorescence resonance energy transfer analysis of ribozyme kinetics reveals the mode of action of a facilitator oligonucleotide. Biochemistry. 1996;35:16370–16377. doi: 10.1021/bi961234r. [DOI] [PubMed] [Google Scholar]
- 25.Walter N.G., Burke J.M. Real-time monitoring of hairpin ribozyme kinetics through base-specific quenching of fluorescein-labeled substrates. RNA. 1997;3:392–404. [PMC free article] [PubMed] [Google Scholar]
- 26.Stojanovic M.N., De Prada P., Landry D.W. Homogeneous assays based on deoxyribozyme catalysis. Nucleic Acids Res. 2000;28:2915–2918. doi: 10.1093/nar/28.15.2915. [DOI] [PMC free article] [PubMed] [Google Scholar]
- 27.Liu J., Lu Y. Improving fluorescent DNAzyme biosensors by combining inter- and intramolecular quenchers. Anal. Chem. 2003;75:6666–6672. doi: 10.1021/ac034924r. [DOI] [PubMed] [Google Scholar]
- 28.Panchuk-Voloshina N., Haugland R.P., Bishop-Stewart J., Bhalgat M.K., Millard P.J., Mao F., Leung W.Y. Alexa dyes, a series of new fluorescent dyes that yield exceptionally bright, photostable conjugates. J. Histochem. Cytochem. 1999;47:1179–1188. doi: 10.1177/002215549904700910. [DOI] [PubMed] [Google Scholar]
- 29.Berlier J.E., Rothe A., Buller G., Bradford J., Gray D.R., Filanoski B.J., Telford W.G., Yue S., Liu J., Cheung C.Y., Chang W., et al. Quantitative comparison of long-wavelength Alexa Fluor dyes to Cy dyes: fluorescence of the dyes and their bioconjugates. J. Histochem. Cytochem. 2003;51:1699–1712. doi: 10.1177/002215540305101214. [DOI] [PubMed] [Google Scholar]


