Abstract
To investigate potential physiological interactions between the transcellular and paracellular pathways of water transport, we asked whether targeted deletion of Aquaporin 5 (AQP5), the major transcellular water transporter in salivary acinar cells, affected paracellular transport of 4-kDa FITC-labeled dextran (FITC-D), which is transported through the paracellular but not the transcellular route. After i.v. injection of FITC-D into either AQP5 wild-type or AQP5−/− mice and saliva collection for fixed time intervals, we show that the relative amount of FITC-D transported in the saliva of AQP5−/− mice is half that in matched AQP5+/+ mice, indicating a 2-fold decrease in permeability of the paracellular barrier in mice lacking AQP5. We also found a significant difference in the proportion of transcellular vs. paracellular transport between male and female mice. Freeze-fracture electron microscopy revealed an increase in the number of tight junction strands of both AQP5+/+ and AQP5−/− male mice after pilocarpine stimulation but no change in strand number in female mice. Average acinar cell volume was increased by ≈1.4-fold in glands from AQP5−/− mice, suggesting an alteration in the volume-sensing machinery of the cell. Western blots revealed that expression of Claudin-7, Claudin-3, and Occludin, critical proteins that regulate the permeability of the tight junction barrier, were significantly decreased in AQP5−/− compared with AQP5+/+ salivary glands. These findings reveal the existence of a gender-influenced molecular mechanism involving AQP5 that allows transcellular and paracellular routes of water transport to act in conjunction.
Keywords: epithelium, fluid absorption and secretion
The proper transport of electrolytes and water across epithelial barriers is of vital importance to the maintenance of normal physiological homeostasis in all animals (1, 2). Fluid is moved either across the plasma membranes of the cells that comprise the epithelial layer (transcellular transport) or between these cells, through the tight junction complex (TJC) that forms a barrier (paracellular transport). Together, the transcellular and paracellular pathways are capable of transporting large volumes of fluid, estimated at 200 liters per day in a 70-kg human (1).
There is considerable complexity in the mechanisms that determine the usage of paracellular vs. transcellular routes of water transport. For example, in the kidney, transport of water is accomplished mainly through paracellular transport in the proximal nephron (3), whereas highly regulated transcellular transport is carried out in the distal nephron and collecting duct (4). Similar complexities are likely to exist in the secretion and absorption of water in the gut and the secretion of fluids by exocrine glands such as the salivary gland and pancreas.
In an attempt to determine the ratio of paracellular to transcellular transport, Murakami et al. (5, 6) used ex vivo perfused rat submandibular salivary glands and showed that the majority of water is transported through the paracellular pathway, and only a relatively small fraction is transported through the transcellular pathway. Although some studies in rabbit submandibular salivary glands corroborate these findings (7), other studies of the choroid plexus and gall bladder epithelia show significantly greater transport through the transcellular rather than the paracellular pathway (1, 8, 9). Thus, although these studies have provided valuable insights and a theoretical framework for understanding fluid transport in epithelial cells, the questions of whether and how transcellular and paracellular pathways interact with each other, and whether these pathways are compensatory or cooperative in their action, remain unanswered. In both rodents and humans (10, 11), the parotid salivary gland is made up of serous acinar cells and shows greater cellular homogeneity than the submandibular gland. For molecular analyses, we therefore focused on the parotid gland, because it allowed more direct interpretation of observed molecular changes.
We have previously shown that disaggregated parotid acinar cells from Aquaporin 5 (AQP5)-deficient mice show a significant decrease in transmembrane water transport (12). In contrast to the results of Murakami et al. (5, 6), these results suggest that much of the fluid secreted by mouse salivary glands requires transcellular water transport. Therefore, to directly address the question of whether a decrease in transcellular water transport affects paracellular permeability, we injected a probe, 4-kDa FITC-labeled dextran (FITC-D), a commonly used marker for paracellular transport (13–15). FITC-D was injected intravenously into wild-type or AQP5−/− mice, and pilocarpine-induced saliva was collected and analyzed to determine whether lack of AQP5 resulted in altered transport of the FITC-D probe into the saliva.
Our results show a decrease in the amount of FITC-D transported in the saliva and a decrease in expression of TJC proteins in parotid glands of AQP5−/− mice. Thus the decrease in transcellular water transport by deletion of AQP5 affects paracellular permeability, providing direct evidence that the functions of the paracellular and transcellular pathways are linked.
Results
Fifty Percent Decrease in the FITC-D Clearance by Salivary Glands of AQP5−/− Mice Compared with AQP5+/+ Littermates.
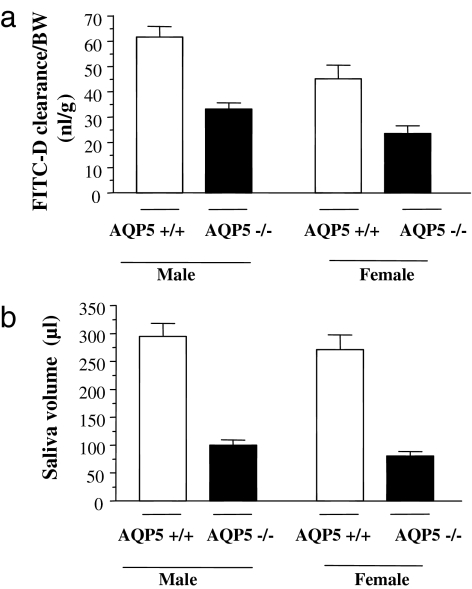
FITC-D was injected into the jugular veins of anesthetized mice. Twenty minutes later, the cholinergic agonist pilocarpine was injected i.p. to stimulate saliva secretion. The amount of FITC-D secreted in saliva was expressed relative to its concentration in the plasma and normalized to body weight (BW) (FITC-D clearance, calculated as described in Materials and Methods) and is shown in Fig. 1a for male and female mice of each genotype. Interestingly, even when corrected for BW, salivary clearance of FITC-D was significantly lower, by ≈40%, in female mice compared with male mice, and this difference was independent of genotype (P = 0.008 for AQP5+/+, P = 0.002 for AQP5−/− mice). Furthermore, in both male and female mice, FITC-D clearance was 50% lower in the saliva from AQP5−/− compared with AQP5+/+ littermates (33.24 ± 2.5 vs. 61.66 ± 4.2; P = 0.002 for males and 23.94 ± 3.08 vs. 44.87 ± 5.56; P = 0.02 for females).
Fig. 1.
Comparison between AQP5+/+ and AQP5−/− mice of each gender (n = 7 AQP5+/+ males; n = 6 AQP5−/− males; n = 6 AQP5+/+ females; n = 5 AQP5−/− females). (a) FITC-D clearance by salivary glands (amount of FITC-D transported in the saliva relative to its concentration in plasma in 15 min) corrected for BW of the mice. (b) Total saliva volume secreted in 15 min.
Total saliva volume was not different between male and female mice (Fig. 1b), but was 65–70% lower in AQP5−/− mice compared with AQP5+/+ littermates, consistent with previously published results (12, 16). Similar results were obtained when the saliva volume was corrected for BW [supporting information (SI) Table 2].
Concentration of FITC-D Is Increased in the Saliva of AQP5−/− Mice Compared with AQP5 Wild-Type Littermates and Shows Gender-Specific Differences.
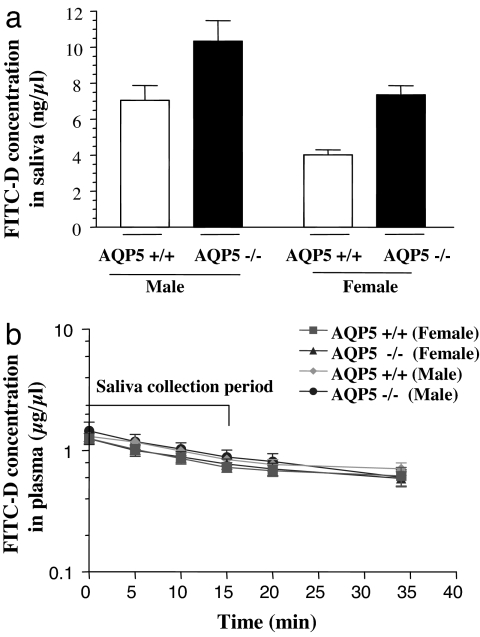
FITC-D concentrations in saliva collected in 15 min are shown in Fig. 2a. In male mice, FITC-D concentration was 46% higher in the saliva of AQP5−/− mice compared with AQP5+/+ littermates (10.3 ± 1.16 vs. 7.05 ± 0.8; P = 0.039). By contrast, in female mice, FITC-D concentration was 83% greater in the saliva of AQP5−/− compared with AQP5+/+ littermates (7.36 ± 0.51 vs. 4.02 ± 0.29; P = 0.001). FITC-D concentration in the saliva of male AQP5+/+ mice was 75% higher compared with AQP5+/+ females (P = 0.0023), whereas it was higher by 40% in AQP5−/− males compared with AQP5−/− females (P = 0.036). No statistically significant difference was seen in the plasma concentrations of FITC-D in AQP5+/+ and −/− male and female mice, as shown in Fig. 2b.
Fig. 2.
Measurement of transport. (a) Comparison of concentration of FITC-D in saliva collected in 15 min between AQP5+/+ and AQP5−/− mice of each gender (n = 7 +/+ males; n = 6 −/− males; n = 6 +/+ females; n = 5 −/− females). (b) Plasma concentration of FITC-D in plasma. Blood samples were collected from the tail vein at 0-, 5-, 10-, 15-, 20-, and 35-min time points after the start of saliva collection.
Volume of Acinar Cells in AQP5−/− Salivary Glands Is Significantly Increased Compared with That in AQP5 Wild-Type Littermates.
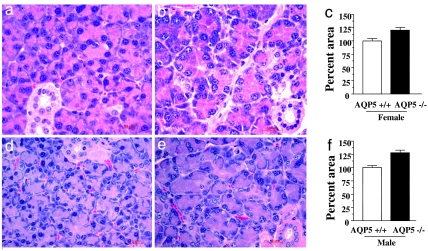
Histological and morphometric analysis of parotid salivary gland shows that the average area of salivary acini was increased by ≈25% (Fig. 3 c and f) in AQP5−/− mice (Fig. 3 b and e) in both genders when compared with matched AQP5+/+ controls (Fig. 3 a and d). If the acini are approximately spherical in shape, we estimate that the acinar volume increased by 30–40% in AQP5−/− mice compared with AQP5+/+ mice. Other than the changes noted in acinar volume, the cellular composition of AQP5+/+ and AQP5−/− salivary glands was not grossly different (12). Parotid gland weight to BW ratios were determined for AQP5−/− and matched AQP5+/+ mice. In males, the ratio was 25% higher in AQP5−/− mice compared with AQP5+/+ littermates (3.07 ± 0.12; vs. 2.42 ± 0.13, n = 6; P = 0.01). In females, the ratio was 15% higher in AQP5−/− mice compared with AQP5+/+ littermates (3.01 ± 0.11 vs. 2.67 ± 0.11, n = 11; P = 0.04).
Fig. 3.
Histology of parotid glands. Absence of AQP5 is associated with increased acinar volume of parotid salivary glands in AQP5−/− mice. Sections from AQP5+/+ and AQP5−/− parotid glands of each gender were stained with H&E. (a) AQP5+/+ females (b) AQP5−/− females (d) AQP5+/+ males and (e) AQP5−/− males. Quantitation of acinar area in AQP5+/+ and AQP5−/− mice was done by using Zeiss Axiovision software (c) females and (f) males. A minimum of four animals were studied in each group.
Increased Number of Tight Junction Strands After Pilocarpine Stimulation; Gender-Specific Differences.
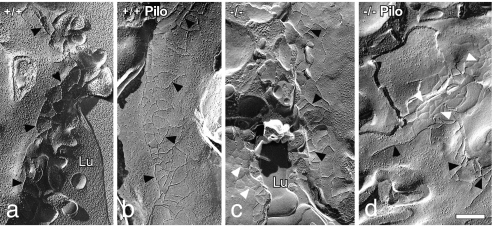
Examination of freeze-fracture replicas by transmission electron microscopy showed that the TJC separating the luminal and lateral cell membrane domains of acinar cells generally consisted of two to three anastomosing strands of contiguous particles on the protoplasmic face (P) or grooves on the exoplasmic face (E) (Fig. 4). Occasional free ends of strands extended basally. There were no differences in the number of strands between AQP5+/+ and AQP5−/− mice or between males and females (Table 1). However, in males, there was a small but significant increase in the mean number of TJC strands after pilocarpine stimulation of both AQP5+/+ and AQP5−/− animals. After pilocarpine stimulation, the complexity of the TJC occasionally appeared increased, but this was not borne out by fractal geometric analyses (data not shown). There were no differences in the number of TJC strands after pilocarpine stimulation of female mice.
Fig. 4.
Freeze-fracture electron microscopy of parotid acinar cell tight junctions of male mice indicates an increase in strand number after pilocarpine stimulation. (a) AQP5+/+. (b) AQP5+/+, pilocarpine stimulated. (c) AQP5−/−. (d) AQP5−/−, pilocarpine stimulated. Black arrowheads indicate P-face junctional strands; white arrowheads indicate E-face grooves. Lu, lumen. (Scale bar = 0.25 μm.)
Table 1.
Number of tight junction strands in freeze-fracture replicas of parotid acinar cells of Aqp5+/+ and Aqp5−/− mice
| Mean ± SEM (n) |
||
|---|---|---|
| Unstimulated | Pilocarpine stimulated | |
| Male+/+ | 2.67 ± 0.21 (12)* | 3.45 ± 0.21 (14)*† |
| Male−/− | 3.05 ± 0.18 (33)‡ | 3.66 ± 0.24 (20)‡ |
| Female+/+ | 2.72 ± 0.01 (30) | 2.93 ± 0.13 (55)† |
| Female−/− | 2.77 ± 0.11 (16) | 3.08 ± 0.20 (23) |
n, number of junctions evaluated. Values with the same symbol are significantly different (P < 0.05).
Decreased Expression of the Tight Junction Proteins in AQP5−/− vs. AQP5+/+ Parotid Salivary Glands; Evidence for Gender-Specific Differences.
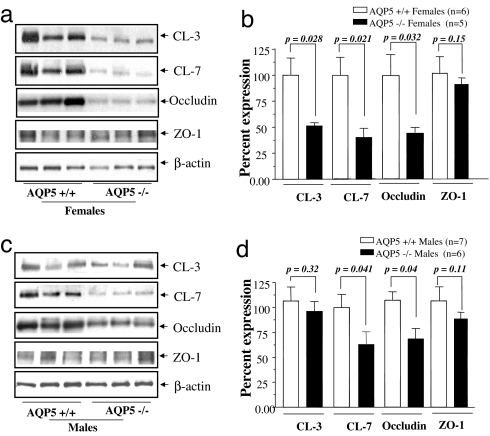
Total protein extracts were prepared from parotid glands isolated from mice after the FITC-D experiment and analyzed by Western blot for changes in the major proteins of the TJC. A significant (≈50%) decrease in Claudin 7 (CL-7) and Occludin expression was observed in AQP5−/− vs. AQP5+/+ mice in both genders (Fig. 5). In contrast, we found a gender-specific change in protein expression of CL-3, which was decreased by 50% in female AQP5−/− mice compared with AQP5+/+ females (Fig. 5 a and b) and was unchanged in males (Fig. 5 c and d). Expression of other TJC proteins such as ZO-1 did not change significantly in AQP5−/− vs. matched AQP5+/+ controls (Fig. 5).
Fig. 5.
Western blots. AQP5 deletion alters the expression of molecular components of the tight junction barrier. (a) Western blot analysis of tight junction proteins from total protein extracts of female parotid salivary gland. (b) Quantitation of the Western blots by using β-actin as the loading control. (c) Western blot analysis of tight junction proteins from total protein extracts of male parotid salivary gland. (d) Quantitation of Western blots by using β-actin as the loading control.
Discussion
The paracellular and transcellular routes of water transport have been described in the epithelial tissues of a wide range of biological species, including the salamander (9, 17), frog (18), toad (19), mouse (12, 20), rat (21), rabbit (7, 22), and human (23), and appear to have been conserved through evolution. Combined, the action of these two pathways is responsible for the transport of significant volumes of fluid, estimated to be 200 liters of water per day in a 70-kg human (1). It is not currently known whether these two physiologically important pathways interact, how the proportion of water transported through each is determined, and whether they compensate for each other or operate coordinately. We reasoned that by injecting fluorescently labeled tracer intravenously into mice lacking AQP5, the major transcellular water channel in the salivary acinus, and measuring the transport of tracer into saliva, we could directly test the hypothesis that decreasing transcellular water transport could affect paracellular water transport.
The ideal tracer to study water transport through the paracellular pathway would be a labeled particle that approximates the size and shape of a water molecule without being transported by the transcellular pathway. To date, such tracers are not available, prompting investigators to use labeled dextran particles (which are not transported by the transcellular pathway) to estimate the amount of water transported through the paracellular pathway (5, 13–15). Although complex biophysical differences between FITC-D and water molecules limit the use of this tracer in determining the absolute amount of water transported, labeled dextran particles have been used effectively to determine ratios of paracellular permeability (24, 25). We therefore chose FITC-D to compare paracellular permeability in salivary glands of AQP5+/+ and AQP5−/− mice based on the successful use of such tracers in rat salivary glands (5, 26, 27).
Both Transcellular Water Transport and Paracellular Water Transport Are Decreased in AQP5−/− Mice, Indicating That Transcellular and Paracellular Water Transport Pathway Work in Parallel.
We and others have previously shown that the volume of saliva secreted by AQP5−/− mice is substantially decreased (60–70%) compared with wild-type littermates (12, 16). However, these studies did not investigate the potential contribution of the paracellular pathway to the phenotype of reduced saliva, because it was assumed that the entire effect was due to the loss of transcellular water transport through the AQP5 membrane channel. In Fig. 1a, we show that the total amount of FITC-D transported in the saliva collected in 15 min was reduced by 50% in AQP5−/− mice when compared with AQP5+/+ littermates, showing that the paracellular permeability to the tracer is decreased in these mice.
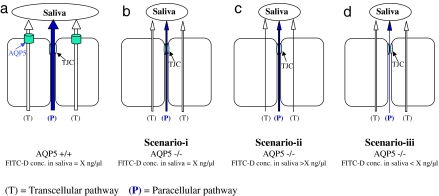
The concentration of the FITC-D probe in the saliva of AQP5+/+ and AQP5−/− littermates was also compared to distinguish among three possible scenarios of AQP5 action on transcellular and paracellular water transport (Fig. 6): (i) If the concentration of FITC-D in saliva is equal in AQP5−/− and AQP5+/+ mice (even if the absolute volumes of saliva are different in the two genotypes), it would indicate that both transcellular and paracellular water transport is equally affected by the loss of AQP5. (ii) If the concentration of FITC-D in saliva is higher in AQP5−/− compared with AQP5+/+ littermates, it would indicate that the loss of AQP5 affected transcellular more than paracellular water transport; and (iii) if the concentration of FITC-D in saliva is lower in AQP5−/− than in AQP5+/+ littermates, it would indicate that loss of AQP5 affected paracellular more than transcellular water transport.
Fig. 6.
Proposed scenarios for evaluating relative changes to paracellular FITC-D transport. (a) Transport of transcellular and paracellular fluid in AQP5+/+ mice. Water transport from transcellular pathway dilutes FITC-D concentration in saliva to yield a hypothetical baseline concentration = X ng/μl. (b) Both transcellular and paracellular water transport is decreased equally resulting in FITC-D concentration = X ng/μl. (c) Larger decrease in transcellular compared with paracellular transport resulting in FITC-D concentration > X ng/μl. (d) Larger decrease in paracellular transport compared with decrease in transcellular transport resulting in FITC-D concentration < X ng/μl.
As shown in Fig. 2a, the concentration of FITC-D in the saliva of AQP5−/− animals increased by 46% in males and 83% in females, when compared with gender-matched AQP5+/+ littermates. This indicates that the loss of AQP5 has a larger effect on transcellular water transport than on paracellular transport (Scenario-ii, Fig. 6c). This is concordant with our previous studies that show a 60–70% reduction in water transport, determined by fluorescence quenching of calcein-loaded disaggregated acinar cells (12). No significant differences in the plasma concentration of FITC-D were observed between AQP5+/+ and −/− mice (Fig. 2b), indicating that the changes observed in the FITC-D concentration are not because of differences in plasma levels of FITC-D in AQP5+/+ and AQP5−/− mice.
The experimental constraints of using the transport of FITC-D as a surrogate of water transport in the intact salivary glands in vivo limit our ability to determine whether unstirred layer effects in the microenvironment at the luminal side of the tight junction cause decreased flow through the junctional pore. The key finding reported here is that reducing water transport through the plasma membrane results in a concomitant reduction in FITC-D transported through the paracellular pathway, which, in conjunction with altered expression of Claudins and Occludin, suggests a remodeling of the tight junction. Our findings therefore provide some support for the hypothesis originally proposed by Hill (28–30) that aquaporins can regulate paracellular water transport.
Loss of AQP5 Is Associated with Decreased Expression of Tight Junction Proteins.
To determine whether the functional changes in paracellular permeability were paralleled by molecular changes in the TJC, we examined the expression levels of known proteins in the TJC in parotid glands of AQP5+/+ and −/− mice. The TJC contains transmembrane proteins such as Claudins and Occludin that form the tight junction strands, as well as scaffolding proteins such as ZO-1 (31). Claudins are thought to play a key role in determining the ion selectivity of the TJC (32, 33). Because Claudin isoforms are expressed in different tissue-specific combinations, it is thought that they confer tissue specific paracellular permeability properties to epithelia (34).
Using quantitative Western blotting techniques, we found that expression of Claudins was significantly changed in AQP5−/− mice, in a gender-specific manner. CL-3 and CL-7 decreased by 50% in AQP5−/− females (Fig. 5 a and b); in males, CL-3 levels remained unchanged whereas CL-7 levels decreased by 40% (Fig. 5 c and d). Our observation, in vivo, that decreased levels of CL-3 and -7 in the parotid glands of AQP5−/− mice is correlated with decreased paracellular permeability parallels the observations, in vitro, of Lipschutz et al. (35), who show that decreased CL-2 in MDCK Type II cells results in decreased paracellular permeability. In addition to Claudins, expression of Occludin was decreased in AQP5−/− females and males by 50% and 30%, respectively. It has also been shown that Occludin can regulate transport of molecular tracers such as FITC-D and mannitol in Madin–Darby canine kidney (MDCK) cells (36–38). Unlike the Claudins and Occludin, the expression of the scaffolding protein ZO-1 did not show any difference in expression in parotid glands of AQP5−/− mice compared with +/+ littermates. Taken together, these observations indicate there are significant molecular changes in the TJC of the salivary acini that are associated with absence of AQP5. Specifically, these involve decreased expression of Claudins and Occludin, critical components of the tight junction strands, which are known to regulate paracellular permeability. Although freeze-fracture analyses of TJC structure did not reveal significant differences between AQP5+/+ and AQP5−/− mice (Fig. 4), previous studies have shown that paracellular permeability is not strictly correlated with junctional structure (26, 39). However, the differential expression of CL-3 or other TJC proteins may explain the differences observed in junctional structure between males and females after pilocarpine stimulation.
Increased Acinar Volume of AQP5−/− Salivary Glands.
To determine whether AQP5 deletion resulted in altered numbers of acini in the salivary glands, we analyzed histological sections of the parotid gland, which is a major fluid-secreting salivary gland in the mouse (10). Although no gross differences in cellular architecture or morphology were observed (Fig. 3 a, b, d, and e), a significant increase in the acinar volume of AQP5−/− mice was noted in both male (Fig. 3 d and e) and female (Fig. 3 a and b) mice. Image processing software revealed an increased acinar cell area in both genders (Fig. 3 c and f). Assuming a spherical shape, the calculated increase in volume was estimated at 30–40% in both males and females. Concordant with increased acinar volume, we found that the weight of parotid salivary glands was 15–25% higher in AQP5−/− mice compared with matched AQP5+/+ controls. It is worth noting that paracellular FITC-D transport is lower in AQP5−/− mice, despite the fact that the parotid glands from −/− mice are larger than wild-type controls. Whether increased acinar volume results from an osmosensing role played by AQP5 in cellular volume regulation or is the result of other physiological processes is currently not known, but other investigators have suggested a role for AQP5 in regulatory volume decrease, possibly through activation of the cation-selective channel transient receptor potential vanilloid 4 (TRPV4) (12, 40).
Gender-Specific Differences in the Properties of Paracellular Barrier in Wild-Type and AQP5−/− Mice.
The observation of gender-specific differences in paracellular permeability and TJC composition in mice is of particular interest in the context of the human salivary disorder xerostomia (drymouth), because AQP5 has been implicated as a component of this syndrome (41–43). Drymouth, a component of Sjögren's syndrome, affects women at a significantly higher frequency and with greater severity than it affects men (44, 45). Our finding that the amount of FITC-D transported in the saliva (Fig. 1a) and its concentration (Fig. 2a) in the saliva of male mice is 50–60% higher than matched female littermates indicates higher permeability of the paracellular barrier in males than in females. Because the total saliva volume and flow rate were not significantly different between males and females (Fig. 1b and SI Table 2), we infer that the osmolar gradient in the acinar lumen, which drives the fluid transport, is probably also not significantly different. In male AQP5−/− mice, CL-7 expression was half that of +/+ littermates, whereas CL-3 expression was unchanged (Fig. 5 c and d). In contrast, female AQP5−/− mice showed a 50% decrease in both CL-3 and -7 when compared with AQP5+/+ littermates (Fig. 5 a and b). Although sexual dimorphism in salivary glands at the level of cellular architecture, composition of saliva, and regulation of salivary glands is well documented in mice (46–49), our findings provide insights into gender-related physiological and molecular differences in the mechanisms of saliva formation.
In summary, we have shown that lack of AQP5 in the salivary gland results in decreased water transport not only through the plasma membrane but also through the TJC, that the transcellular and paracellular pathways act in conjunction rather than in a compensatory manner, and that they are influenced by gender. By identifying AQP5, CL-3 and -7, and Occludin as members of this crosstalk, we outline a path for identifying the molecular components of the signaling system that connect these two major routes of water transport. Although the results we describe here are limited to the parotid salivary gland, it is possible that our findings may have broader applicability in understanding fluid transport in other exocrine tissues.
Materials and Methods
Experimental Reagents.
FITC-D was obtained from Sigma (St. Louis, MO). Pilocarpine was a gift from Yasumasa Sasaki (Santen Pharmaceuticals, Osaka, Japan). Drummond 20- and 50-μl calibrated microcapillary pipettes were purchased from Sigma. The antibody to β-actin was an anti-mouse monoclonal antibody purchased from Sigma. Rabbit polyclonal CL-3 and -7 and mouse monoclonal antibodies against ZO-1 and Occludin were obtained from Zymed (San Francisco, CA). Horseradish peroxidase-conjugated secondary antibodies were from Vector Laboratories (Burlingame, CA). Protein concentration in each sample was measured by using the Pierce BCA protein assay reagent kit (Pierce, Rockford, IL) according to the manufacturer's protocol. Nitrocellulose membrane, 4–15% linear gradient and 7.5% resolving Tris·HCl ready gels were purchased from Bio-Rad (Hercules, CA). Immunoreactivity was detected by SuperSignal West Pico chemiluminescent reagents (Pierce).
Aqp5−/− Mice.
Mice null for Aqp5 were generated as described (12). Mice were bred and housed in a pathogen-free environment. Age- and sex-matched 18- to 19-week-old Aqp5+/+ and Aqp5−/− littermates from Aqp5 recombinant inbred 129SvJ/Black Swiss (line 187) were used in all experiments. All experiments involving the use of live mice were approved by the Institutional Animal Care and Use Committee review board of the University Of Cincinnati College of Medicine.
FITC-D Injection and Saliva Collection.
Age- and sex-matched littermates 18–19 weeks of age were anesthetized with an i.p. injection of pentobarbital sodium (22.5 mg/kg, i.p.) and placed on a temperature-controlled table. After tracheotomy, the right jugular vein was cannulated to inject FITC-D (1.5 mg/g). Twenty minutes after FITC-D injection, pilocarpine (2 mg/kg) was injected i.p. to stimulate saliva secretion. Whole saliva was collected, representing a combination of parotid, submandibular, and sublingual secretions, with a very minor component from minor salivary glands. Saliva was collected by using calibrated 20- and 50-μl microcapillary pipettes over a 15- min period in three time periods: 0–5, 5–10, and 10–15 min. A blood sample was collected from the tail vein after each time period. On completion of the experiment, mice were euthanized, and salivary glands were harvested for Western blot analysis of the tight junction proteins. All fluorescence measurements of saliva and plasma were performed by using a Labsystems (Research Triangle Park, NC) Flouroskan II fluorometer at excitation and emission wavelengths of 485 and 538 nm, respectively.
Calculations.
The amount of FITC-D secreted in the saliva depends on the concentration of FITC-D in plasma. Therefore, the amount of FITC-D transported in the saliva was expressed in terms of plasma clearance of FITC-D by the salivary gland and was calculated by using the following equation.
where SFITC-D (ng/μl) is the concentration of FITC-D in saliva collected in 15 min, PFITC-D (μg/μl) is the concentration of FITC-D in plasma in 15 min, V (μl) is the volume of saliva secreted in 15 min, and CFITC-D (nl) is the plasma clearance of FITC-D by the salivary gland.
Furthermore, the size of the mouse would also affect the volume of saliva secreted by the salivary gland. Therefore, the total amount of FITC-D transported in the saliva in 15 min from Eq. 1 was normalized for BW (in grams):
Western Blot Analysis.
Parotid salivary glands were dissected, frozen in liquid N2, and ground to a powder, then extracted by using Laemmli buffer. Ten micrograms of total protein was resolved by using SDS/PAGE, transferred on nitrocellulose membrane, blocked with 10% milk/Tris-buffer saline (TBST) with Tween 20 (0.1%), and probed with primary antibodies in 5% milk/TBST overnight at 4°C, followed by three quick and then 3 × 10-min TBST washes, followed by secondary antibody conjugated to horseradish peroxidase enzyme (Vector Laboratories) in 5% milk/TBST. Immunoreactivity was detected by SuperSignal West Pico chemiluminescent reagents (Pierce).
Histology.
Salivary glands from age- and sex-matched Aqp5+/+ and Aqp5−/− littermates were fixed in phosphate-buffered 4% paraformaldehyde, paraffin-embedded, sectioned at 5 μm, and stained with H&E for morphologic analysis. The area of the acini was determined by using Zeiss (Thornwood, NY) Axiovision LE 4.5 image processing software. A total of 64 histological fields were analyzed, n = 4 for each gender and genotype, four fields per section. Increase in acinar volume was calculated on the basis of increase in the area, assuming the acini to be spherical in shape.
Freeze-Fracture Electron Microscopy.
Parotid glands were fixed by vascular perfusion of 2.5% glutaraldehyde in 0.1 M sodium cacodylate buffer, pH 7.4. Salivary secretion was stimulated in some animals by pilocarpine (10 mg/kg, i.p.), 30 min before perfusion. Small pieces of fixed tissue were cryoprotected with 30% glycerol and rapidly frozen in liquid nitrogen-cooled propane. The frozen samples were fractured and replicated with platinum and carbon in a Balzers (Reading, U.K.) 400D freeze-fracture machine. The replicas were cleaned in bleach and acid, collected on Formvar-coated grids, and examined in a transmission electron microscope. Tight junction structure was analyzed by counting the mean number of strands per tight junction (39), and tight junction complexity was determined by fractal geometry (50).
Statistics.
Data are presented as mean ± SEM, and differences within group were tested with Student's t test. P < 0.05 was considered statistically significant.
Supplementary Material
Acknowledgments
We thank Drs. Giovanni M. Pauletti, Karl S. Matlin, John J. Monaco, Eric I. Gruenstein, Leslie Myatt, Gary E. Shull, John Cuppoletti, and Paranthaman Senthamaraikannan for insightful comments and suggestions throughout this study; Meng Meng Jiang and Karena Sisco for technical help; Glenn Doerman for assistance with the preparation of figures; and the Central Microscopy Facility, Department of Biology, University of Massachusetts, Amherst, for use of their laboratory and freeze-fracture equipment. This work was supported in part by National Institutes of Health grants DE13823 (to A.G.M.) and DK57552 (to J.N.L.).
Abbreviations
- AQP5
Aquaporin 5
- TJC
tight junction complex
- FITC-D
4-kDa FITC-labeled dextran
- BW
body weight
- CL-7/3
Claudin 7/3.
Footnotes
The authors declare no conflict of interest.
This article is a PNAS direct submission.
This article contains supporting information online at www.pnas.org/cgi/content/full/0608384104/DC1.
References
- 1.Zeuthen T. Int Rev Cytol. 2002;215:285–317. doi: 10.1016/s0074-7696(02)15013-3. [DOI] [PubMed] [Google Scholar]
- 2.Tripathi S, Boulpaep EL. Q J Exp Physiol. 1989;74:385–417. doi: 10.1113/expphysiol.1989.sp003288. [DOI] [PubMed] [Google Scholar]
- 3.Guyton AC, Hall JE. In: Textbook of Medical Physiology. Hall JE, editor. Philadelphia: Saunders; 2000. pp. 295–312. [Google Scholar]
- 4.Robben JH, Knoers NV, Deen PM. Am J Physiol. 2006;291:F257–F270. doi: 10.1152/ajprenal.00491.2005. [DOI] [PubMed] [Google Scholar]
- 5.Murakami M, Shachar-Hill B, Steward MC, Hill AE. J Physiol. 2001;537:899–906. doi: 10.1111/j.1469-7793.2001.00899.x. [DOI] [PMC free article] [PubMed] [Google Scholar]
- 6.Murakami M, Murdiastuti K, Hosoi K, Hill AE. J Membr Biol. 2006;210:91–103. doi: 10.1007/s00232-005-0848-2. [DOI] [PubMed] [Google Scholar]
- 7.Steward MC, Seo Y, Rawlings JM, Case RM. J Physiol. 1990;431:571–583. doi: 10.1113/jphysiol.1990.sp018348. [DOI] [PMC free article] [PubMed] [Google Scholar]
- 8.Ericson AC, Spring KR. Am J Physiol. 1982;243:C140–C145. doi: 10.1152/ajpcell.1982.243.3.C140. [DOI] [PubMed] [Google Scholar]
- 9.Ericson AC, Spring KR. Am J Physiol. 1982;243:C146–C150. doi: 10.1152/ajpcell.1982.243.3.C146. [DOI] [PubMed] [Google Scholar]
- 10.Botts S, Jokinen M, Gaillard ET, Elwell MR, Mann PC. In: Pathology of the Mouse. Maronpot RR, editor. St. Louis, MO: Cache River Press; 1999. pp. 49–79. [Google Scholar]
- 11.Martini FH, Timmons MJ, Tallitsch RB. In: Human Anatomy. Martini FH, Timmons MJ, Tallitsch B, editors. New York: Cummings; 2003. pp. 663–702. [Google Scholar]
- 12.Krane CM, Melvin JE, Nguyen HV, Richardson L, Towne JE, Doetschman T, Menon AG. J Biol Chem. 2001;276:23413–23420. doi: 10.1074/jbc.M008760200. [DOI] [PubMed] [Google Scholar]
- 13.Matsukawa Y, Lee VH, Crandall ED, Kim KJ. J Pharm Sci. 1997;86:305–309. doi: 10.1021/js960352x. [DOI] [PubMed] [Google Scholar]
- 14.Keely S, Rullay A, Wilson C, Carmichael A, Carrington S, Corfield A, Haddleton DM, Brayden DJ. Pharmacol Res. 2005;22:38–49. doi: 10.1007/s11095-004-9007-1. [DOI] [PubMed] [Google Scholar]
- 15.Li L, Mathias NR, Heran CL, Moench P, Wall DA, Smith RL. J Pharm Sci. 2006;95:326–335. doi: 10.1002/jps.20541. [DOI] [PubMed] [Google Scholar]
- 16.Ma T, Song Y, Gillespie A, Carlson EJ, Epstein CJ, Verkman AS. J Biol Chem. 1999;274:20071–20074. doi: 10.1074/jbc.274.29.20071. [DOI] [PubMed] [Google Scholar]
- 17.Hill AE, Shachar-Hill B. J Membr Biol. 1997;158:119–126. doi: 10.1007/s002329900249. [DOI] [PubMed] [Google Scholar]
- 18.Civan MM, DiBona DR. J Membr Biol. 1978;38:359–386. doi: 10.1007/BF01870152. [DOI] [PubMed] [Google Scholar]
- 19.Nedergaard S, Larsen EH, Ussing HH. J Membr Biol. 1999;168:241–251. doi: 10.1007/s002329900513. [DOI] [PubMed] [Google Scholar]
- 20.Furuse M, Hata M, Furuse K, Yoshida Y, Haratake A, Sugitani Y, Noda T, Kubo A, Tsukita S. J Cell Biol. 2002;156:1099–1111. doi: 10.1083/jcb.200110122. [DOI] [PMC free article] [PubMed] [Google Scholar]
- 21.Segawa A, Yamashina S, Murakami M. Eur J Morphol. 2002;40:241–246. doi: 10.1076/ejom.40.4.241.16701. [DOI] [PubMed] [Google Scholar]
- 22.Carpi-Medina P, Whittembury G. Pflügers Arch. 1988;412:66–74. doi: 10.1007/BF00583732. [DOI] [PubMed] [Google Scholar]
- 23.Porta M, Capurro C, Parisi M. Biochim Biophys Acta. 1989;980:220–224. doi: 10.1016/0005-2736(89)90402-1. [DOI] [PubMed] [Google Scholar]
- 24.Case RM, Cook DI, Hunter M, Steward MC, Young JA. J Membr Biol. 1985;84:239–248. doi: 10.1007/BF01871387. [DOI] [PubMed] [Google Scholar]
- 25.Steward MC. J Physiol. 1982;322:419–439. doi: 10.1113/jphysiol.1982.sp014046. [DOI] [PMC free article] [PubMed] [Google Scholar]
- 26.Mazariegos MR, Tice LW, Hand AR. J Cell Biol. 1984;98:1865–1877. doi: 10.1083/jcb.98.5.1865. [DOI] [PMC free article] [PubMed] [Google Scholar]
- 27.Segawa A. J Electron Microsc (Tokyo) 1994;43:290–298. [PubMed] [Google Scholar]
- 28.Hill AE, Shachar-Hill B. J Membr Biol. 2006;210:77–90. doi: 10.1007/s00232-005-0847-3. [DOI] [PubMed] [Google Scholar]
- 29.Hill AE, Shachar-Hill B, Shachar-Hill Y. J Membr Biol. 2004;197:1–32. doi: 10.1007/s00232-003-0639-6. [DOI] [PubMed] [Google Scholar]
- 30.Shachar-Hill B, Hill AE. Int Rev Cytol. 2002;215:319–350. doi: 10.1016/s0074-7696(02)15014-5. [DOI] [PubMed] [Google Scholar]
- 31.Schneeberger EE, Lynch RD. Am J Physiol. 2004;286:C1213–C1228. doi: 10.1152/ajpcell.00558.2003. [DOI] [PubMed] [Google Scholar]
- 32.Van Itallie CM, Anderson JM. Proc Am Thorac Soc. 2004;1:38–41. doi: 10.1513/pats.2306013. [DOI] [PubMed] [Google Scholar]
- 33.Alexandre MD, Lu Q, Chen YH. J Cell Sci. 2005;118:2683–2693. doi: 10.1242/jcs.02406. [DOI] [PubMed] [Google Scholar]
- 34.Van Itallie CM, Anderson JM. Annu Rev Physiol. 2006;68:403–429. doi: 10.1146/annurev.physiol.68.040104.131404. [DOI] [PubMed] [Google Scholar]
- 35.Lipschutz JH, Li S, Arisco A, Balkovetz DF. J Biol Chem. 2005;280:3780–3788. doi: 10.1074/jbc.M408122200. [DOI] [PubMed] [Google Scholar]
- 36.Balda MS, Whitney JA, Flores C, Gonzalez S, Cereijido M, Matter K. J Cell Biol. 1996;134:1031–1049. doi: 10.1083/jcb.134.4.1031. [DOI] [PMC free article] [PubMed] [Google Scholar]
- 37.Balda MS, Flores-Maldonado C, Cereijido M, Matter K. J Cell Biochem. 2000;78:85–96. [PubMed] [Google Scholar]
- 38.Chen Y, Merzdorf C, Paul DL, Goodenough DA. J Cell Biol. 1997;138:891–899. doi: 10.1083/jcb.138.4.891. [DOI] [PMC free article] [PubMed] [Google Scholar]
- 39.Stevenson BR, Anderson JM, Goodenough DA, Mooseker MS. J Cell Biol. 1988;107:2401–2408. doi: 10.1083/jcb.107.6.2401. [DOI] [PMC free article] [PubMed] [Google Scholar]
- 40.Liu X, Bandyopadhyay BB, Nakamoto T, Singh BB, Liedtke W, Melvin JE, Ambudkar IS. J Biol Chem. 2006;281:15485–15495. doi: 10.1074/jbc.M600549200. [DOI] [PubMed] [Google Scholar]
- 41.Steinfeld S, Cogan E, King LS, Agre P, Kiss R, Delporte C. Lab Invest. 2001;81:143–148. doi: 10.1038/labinvest.3780221. [DOI] [PubMed] [Google Scholar]
- 42.Steinfeld SD, Delporte C. Lancet. 2002;359:1777–1778. doi: 10.1016/S0140-6736(02)08624-5. [DOI] [PubMed] [Google Scholar]
- 43.Ohashi Y, Ishida R, Kojima T, Goto E, Matsumoto Y, Watanabe K, Ishida N, Nakata K, Takeuchi T, Tsubota K. Am J Ophthalmol. 2003;136:291–299. doi: 10.1016/s0002-9394(03)00203-4. [DOI] [PubMed] [Google Scholar]
- 44.Parke AL. J Rheumatol. 2000;61(Suppl):4–5. [PubMed] [Google Scholar]
- 45.Zakrzewska JM. Int Dent J. 1996;46:548–557. [PubMed] [Google Scholar]
- 46.Murai S, Saito H, Masuda Y, Itoh T, Kawaguchi T. Arch Oral Biol. 1998;43:9–14. doi: 10.1016/s0003-9969(97)00088-5. [DOI] [PubMed] [Google Scholar]
- 47.Pinkstaff CA. Eur J Morphol. 1998;36(Suppl):31–34. [PubMed] [Google Scholar]
- 48.Ribeiro TT, Cestari TM, Taga R. Ital J Anat Embryol. 2001;106:27–34. [PubMed] [Google Scholar]
- 49.Treister NS, Richards SM, Lombardi MJ, Rowley P, Jensen RV, Sullivan DA. J Dent Res. 2005;84:160–165. doi: 10.1177/154405910508400210. [DOI] [PubMed] [Google Scholar]
- 50.Kniesel U, Reichenbach A, Risau W, Wolburg H. Tissue Cell. 1994;26:901–912. doi: 10.1016/0040-8166(94)90039-6. [DOI] [PubMed] [Google Scholar]
Associated Data
This section collects any data citations, data availability statements, or supplementary materials included in this article.


