Abstract
Ethylene induces enhanced differential growth in petioles of Arabidopsis (Arabidopsis thaliana), resulting in an upward movement of the leaf blades (hyponastic growth). The amplitude of this effect differs between accessions, with Columbia-0 (Col-0) showing a large response, while in Landsberg erecta (Ler), hyponastic growth is minimal. Abscisic acid (ABA) was found to act as an inhibitory factor of this response in both accessions, but the relationship between ethylene and ABA differed between the two; the ability of ABA to inhibit ethylene-induced hyponasty was significantly more pronounced in Col-0. Mutations in ABI1 or ABI3 induced a strong ethylene-regulated hyponastic growth in the less responsive accession Ler, while the response was abolished in the ABA-hypersensitive era1 in Col-0. Modifications in ABA levels altered petiole angles in the absence of applied ethylene, indicating that ABA influences petiole angles also independently from ethylene. A model is proposed whereby the negative effect of ABA on hyponastic growth is overcome by ethylene in Col-0 but not in Ler. However, when ABA signaling is artificially released in Ler, this regulatory mechanism is bypassed, resulting in a strong hyponastic response in this accession.
Abscisic acid (ABA) influences many aspects of plant growth and development, ranging from seed desiccation to acclimation to environmental stresses (Zeevaart and Creelman, 1988). Although progress has been made in the characterization of ABA signal transduction pathways, the signal transduction pathways, including the receptor, are not yet fully understood. Recent work by Razem et al. (2006) identified the late flowering RNA-binding protein FCA as a receptor for ABA, but the function of this protein seems to be related to some specific processes only, such as lateral root formation and flowering. Using mutational analysis, over 50 loci that affect ABA responsiveness were identified (for review, see Finkelstein et al., 2002; Himmelbach et al., 2003). In general, ABA response mutants were identified in screens for altered sensitivity to ABA during germination. However, many mutations affecting ABA response were also identified in screens for alterations in other signaling pathways (e.g. sugar sensing; Huijser et al., 2000).
ABA is known to interact with ethylene in many aspects of growth. Enhanced levels of ethylene are known to reduce the endogenous ABA concentration in rehydrated Xanthium leaves (Zeevaart, 1983) and in submergence-tolerant deepwater rice and Rumex palustris (Hoffmann-Benning and Kende, 1992; Benschop et al., 2005). In R. palustris, ABA levels decrease over 80% within 60 min due to both a strong decrease in transcription of several NCEDs (the rate-limiting biosynthesis gene) as well as enhanced degradation to phaseic acid. Interestingly, ethylene seems to stimulate ABA biosynthesis in plants treated with auxin herbicides (Hansen and Grossmann, 2000). ABA, in turn, has been shown to inhibit ethylene production in vegetative tissue, although this effect was only apparent when ABA levels were reduced to below those normally found in plants (LeNoble et al., 2004). Ethylene production was not altered in plants treated with high levels of ABA (Beaudoin et al., 2000).
Apart from reciprocal effects on synthesis, interactions between ethylene and ABA signaling pathways have also been shown. Two independent studies showed era3, originally identified as ABA hypersensitive, to be allelic to ein2 (Beaudoin et al., 2000; Ghassemian et al., 2000). Furthermore, these studies identified ctr1 and ein2, respectively, as enhancers and suppressors of abi1. The observed relations between ABA and ethylene signaling may very well be specific for certain organs or a particular developmental stage. For example, ethylene-insensitive mutants feature a reduced sensitivity of roots to ABA, while the ABA sensitivity in the aleurone layer of germinating seeds is increased (Beaudoin et al., 2000; Ghassemian et al., 2000). Thus, the two hormones seem to antagonize each other at the level of germination but act additively with respect to root growth. This discrepancy raises the question as to how ethylene and ABA signaling interact in the shoot during vegetative growth.
Hyponastic (upward) and epinastic (downward) leaf growth are a common phenomenon observed in many plant species and consist of relatively faster cellular expansion on, respectively, the abaxial or adaxial side of the plant organ (Kang, 1979). Both are induced by an array of environmental cues, including canopy light signals (Ballaré, 1999; Pierik et al., 2003; Vandenbussche et al., 2003), waterlogging and submergence (Jackson, 2002; Cox et al., 2003), and low temperatures (Nilsen, 1991). Furthermore, the plant hormones ABA, gibberellic acid (GA), and auxin are suggested to play a regulatory role (Benschop et al., 2005; Cox et al., 2006). Also, petioles of Arabidopsis (Arabidopsis thaliana) show a rapid hyponastic growth when treated with ethylene (Millenaar et al., 2005). The extent of this differential growth phenomenon was found to vary strongly between accessions. For instance, the accession Columbia-0 (Col-0) shows strong hyponastic growth upon exposure to ethylene, whereas in Landsberg erecta (Ler), almost no response was observed (Millenaar et al., 2005). However, Ler did show strong hyponastic growth in response to a low-light treatment. Thus, Ler does contain the signal transduction mechanism that leads to hyponastic growth, but ethylene is unable to connect to these downstream components (Millenaar et al., 2005).
The use of ethylene-induced hyponastic growth as a model system differs from traditionally used screens such as germination and hypocotyl length, in that it studies adult vegetative tissue instead of seeds or seedlings. Apart from this, the model system quantifies alterations in growth that occur in the span of hours rather than days. Using time-lapse photography, control and ethylene-treated plants are repetitively monitored for changes in petiole angles, resulting in detailed kinetics of the growth response. This enables the recognition of mutations that only result in a transient phenotype that would no longer be noticeable after prolonged treatment.
In this study, we focus on the role of ABA in the regulation of initial petiole angles and ethylene-induced hyponastic growth in Arabidopsis and whether the observed difference in hyponastic response between accessions could be explained by a different relationship between ethylene and ABA. A collection of mutants with impaired ability to synthesize or perceive ABA was screened for alterations in the kinetics of ethylene-induced hyponastic growth, and the results were compared to pharmacological studies in which ethylene-exposed wild-type plants were treated with ABA or fluridone, an inhibitor of ABA biosynthesis. Furthermore, the effect of applied ethylene on the concentration of endogenous ABA, as well as on the transcript levels of ABA biosynthesis and ABA response genes, was determined.
RESULTS
Initial Petiole Angles and Ethylene-Induced Hyponastic Growth
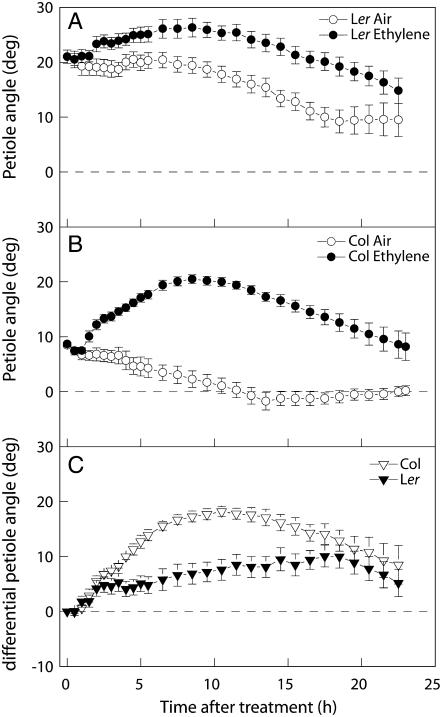
Figure 1 shows petiole angles of Arabidopsis accessions Col-0 and Ler treated with air or 5 μL L−1 ethylene. When grown in air, Ler plants showed a significantly higher initial petiole angle above the horizontal (21° ± 1°) compared to Col-0 (8° ± 0.3°). Both accessions reacted with an increase in petiole angle within 2 h after the start of ethylene treatment. In absolute numbers, this increase was significantly stronger in Col-0 (13° ± 1° after 8 h) compared to Ler (5° ± 2° after 8 h). As air-grown plants also show alterations in the petiole angle during the treatment period, part of the growth response observed in ethylene-treated plants is not related to ethylene. To be able to visualize the effect of ethylene on hyponasty more clearly, air-grown and ethylene-treated plants were paired, and the difference in petiole angle was calculated by subtracting the values of an air-grown plant from those of an ethylene-treated plant for each time point, giving a differential change in petiole angle during the course of the experiment (Cox et al., 2004). The result of these calculations (shown in Fig. 1C) shows, as expected, a stronger ethylene-induced hyponasty in Col-0 compared to Ler.
Figure 1.
A and B, Effect of 5 μL L−1 ethylene or air on petiole angles of Arabidopsis accessions Ler (A) and Col-0 (B). C, Calculated effect of ethylene on petiole angles (using results in A and B) through pairwise subtraction of the values of untreated plants from those of treated plants for each time point. Plants were in continuous light during the experiment. Data are means of eight replicate plants from two separately grown batches per accession, with ses.
ABA Depresses Petiole Angles and Ethylene-Induced Hyponastic Growth in Mutant Analyses
To determine whether ABA concentration or ABA signaling is involved in ethylene-induced hyponastic growth, a selection of mutants impaired in ABA biosynthesis or ABA signal transduction was analyzed. Although some of these mutations influence stomatal conductances (e.g. ABI1 and ABI2; Allen et al., 1999), no wilting was observed during the growth of the plants and during experimentation.
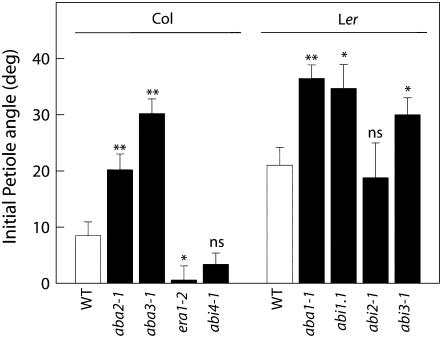
In the absence of ethylene, an altered initial petiole angle could already be observed in a number of mutant lines compared to the respective wild types (Fig. 2). The ABA biosynthesis mutants aba1-1 (Ler background) as well as aba2-1 and aba3-1 (Col-0 background) all displayed a significantly higher petiole angle than those of the respective wild types (P < 0.01), suggesting that ABA negatively influences initial petiolar angles. In correspondence with this, a decreased petiole angle was observed in the ABA-hypersensitive era1-2 (P < 0.05), and two ABA-insensitive mutants (abi1-1 and abi3-1) showed increased angles. However, not all ABA-insensitive mutants shared this phenotype, as no angle increase was present for abi2-1 (Ler) or for abi4-1 (Col-0).
Figure 2.
Initial petiole angles in a number of Arabidopsis ABA mutants (black bars) compared to the appropriate wild-type background accessions (white bars). Angles were measured immediately prior to ethylene treatment experiments (Figs. 3 and 4). Means of four to eight replicates with ses. Stars indicate P values: n.s, Not significant; *, 0.05 > P > 0.01; **, P < 0.01.
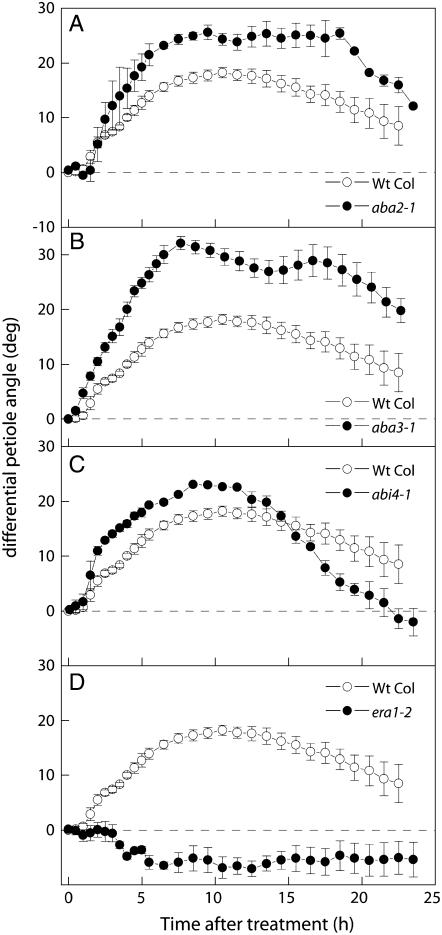
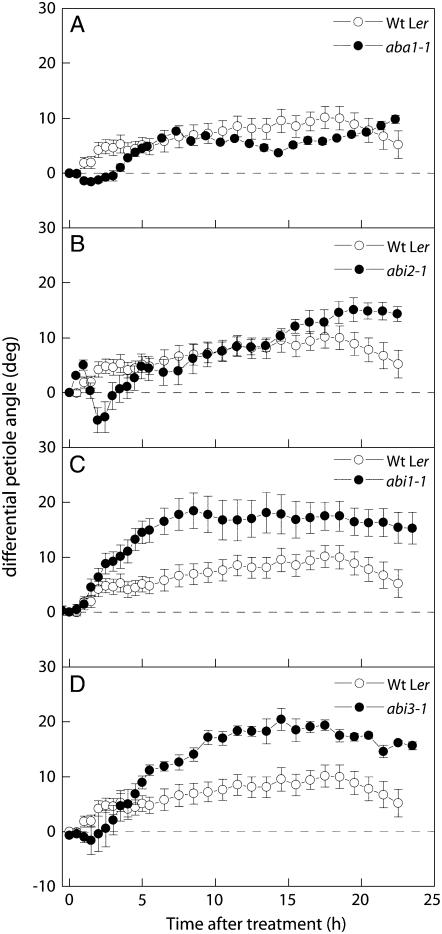
To establish a relationship between ethylene and ABA signaling, the mutants described above were treated with 5 μL L−1 ethylene. In general, this revealed an antagonistic relationship between ABA and ethylene. But again, this trend was not without exceptions. For example, the biosynthesis mutants aba2-1 and aba3-1 from Col-0 showed a significantly enhanced ethylene-induced hyponasty compared to wild-type plants (Fig. 3 , A and B). In contrast, no increase was observed in a comparable biosynthesis mutant from Ler (aba1-1; Fig 4A). ABA hypersensitivity (as observed in era1-2) resulted in the complete inhibition of ethylene-induced hyponastic growth (Fig. 3D). This was not a result of reduced ethylene sensitivity, as this mutant responded normally to ethylene in a triple-response assay (data not shown). In correlation with this, a strong enhancement of hyponastic growth was observed in the ABA-insensitive abi1-1 (17° ± 3°) and abi3-1 mutants (20° ± 2°; Fig. 4, C and D). Interestingly, the two ABA-insensitive mutants that did not show increased petiole angles, abi4-1 and abi2-1, also showed smaller enhancements of ethylene-induced growth (Figs. 3C and 4B). Taken together, these experiments suggest an inhibitory effect of ABA on initial petiole angles and ethylene-induced hyponastic growth and draw attention to the existence of an interaction between ABA and ethylene signaling that determines the extent of hyponastic growth.
Figure 3.
Effect of applied ethylene (5 μL L−1) on petiole angles in Arabidopsis ABA mutants (black symbols) compared to the response of the appropriate wild-type background accession Col-0 (white symbols). Data calculated as in Figure 1C. Means of three or four replicates with ses.
Figure 4.
Effect of applied ethylene (5 μL L−1) on petiole angles of Arabidopsis ABA mutants (black symbols) compared to the response of the wild-type background accession Ler (white symbols). Data calculated as in Figure 1C. Means of three or four replicates with ses.
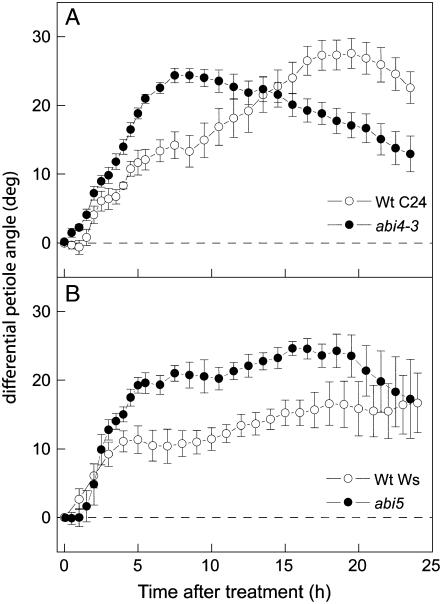
To support the observations made in Col-0 and Ler, ABA response mutants from two other accessions, C24 and Wassilewskija (Ws), were also analyzed (Fig. 5). The abi5 mutant responded to ethylene in a manner similar to ABA-insensitive mutants in Col-0 (maximal increase of 16° ± 3° in Ws versus 24° ± 2° in abi5). However, this mutation did not affect the initial petiole angles (20° ± 3° in wild type versus 24° ± 3° in abi5). In contrast, a reduction of initial angles was observed in C24-abi4-3 (33° ± 4° for wild type versus 21° ± 3° for abi4-3; P < 0.05). The growth response for abi4-3 was strikingly similar to that observed for abi4-1; both mutations resulted in a strong enhancement of the initial growth but not in a very high increase in maximal angle. Also, both mutant lines showed a relatively strong collapse of the petiole angles after prolonged (12 h) treatment with ethylene.
Figure 5.
Effect of applied ethylene (5 μL L−1) on petiole angles of Arabidopsis ABA mutants abi4-3 (A) and abi5 (B; black symbols) compared to the response of the wild-type background accession C24 (A) and Ws (B; white symbols). Data calculated as in Figure 1C. Means of four replicates with ses.
ABA Inhibits Initial Petiole Angle and Ethylene-Induced Hyponastic Growth in Pharmacological Experiments
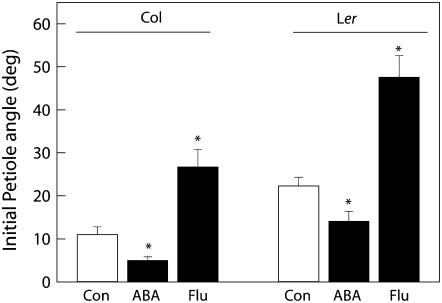
To confirm the observations from ABA mutants, wild-type plants from both accessions were treated with either ABA or fluridone, an inhibitor of its biosynthesis. Again, a negative relationship between ABA and initial petiole angles was observed. The application of 20 μm ABA for a period of 8 h resulted in decreased petiole angles in both accessions (P < 0.05; Fig. 6), while plants treated with fluridone acquired a significantly more upright initial petiole (P < 0.05).
Figure 6.
Initial petiole angles in wild-type Col-0 and Ler treated with ABA (20 μm, 8 h) or fluridone (1 μm, 72 h) compared to the mock-treated plants (Con) of the appropriate accession. Means of four replicates with ses. Stars indicate P values: n.s, Not significant; *, 0.05 > P > 0.01; **, P < 0.01.
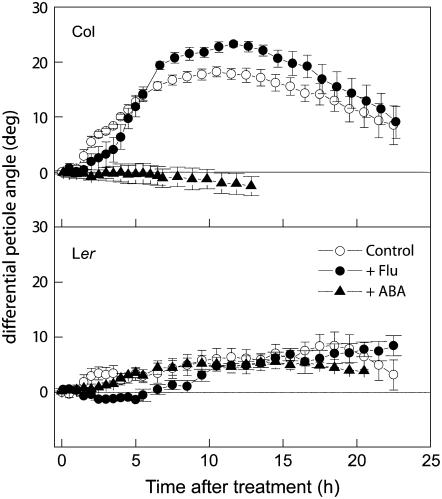
Again, plants treated with ABA or fluridone were subsequently exposed to ethylene (5 μL L −1), and the effect of ethylene on hyponastic growth was calculated as in Figure 1C. In Col-0, treatment with ABA resulted in the complete inhibition of ethylene-induced hyponastic growth for at least 14 h of treatment (Fig. 7), while treatment with fluridone resulted in enhanced hyponastic growth. Although the fluridone-treated plants reacted slower to ethylene than untreated plants, the maximal increase in petiole angle was found to be significantly larger (23° ± 0.6° versus 18° ± 1°; P < 0.05). Ler did not respond similarly to Col-0; the same application of ABA to Ler plants did not inhibit the small ethylene-induced hyponastic response (8° ± 2° versus 5° ± 1°). Treatment of Ler plants with fluridone also did not induce an enhancement of ethylene-induced hyponastic growth. In fact, fluridone treatment in Ler seemed to hinder rather than enhance hyponasty, as the fluridone-treated plants showed an increased lag time for hyponastic growth to start and also an increase in the time point at which the maximum angle was reached. So, although ABA and ethylene seem to interact in both accessions, ethylene-induced hyponasty in Col-0 seems more affected by ABA levels than in Ler.
Figure 7.
Effect of 5 μL L−1 ethylene on petiole angles of ABA and fluridone-treated Col-0 and Ler plants (black symbols) compared to the response of the wild-type background accession (white symbols). ABA treatment plants, Plants treated with ABA (20 μm) to shoots and roots 1 h prior to start of measurement. Fluoridone treatment, Plants treated with 1 μmol fluridone to the roots 72 h prior to start of measurement. Data calculated as in Figure 1C. Means of three or four replicates with ses.
Analysis of ABA Concentrations and Expression of ABA Biosynthesis and Response Genes
The observed ability of ABA to influence initial petiole angles and the antagonistic relationship between ABA and ethylene in this tissue indicates that ethylene might act via an alteration of ABA signaling or ABA biosynthesis. To investigate these possibilities, the effect of ethylene on endogenous levels of ABA was determined in ethylene-treated plants. Additionally, expression levels of ABA biosynthesis and ABA response genes were analyzed with microarray experiments using petioles of Col-0 plants treated with air or ethylene.
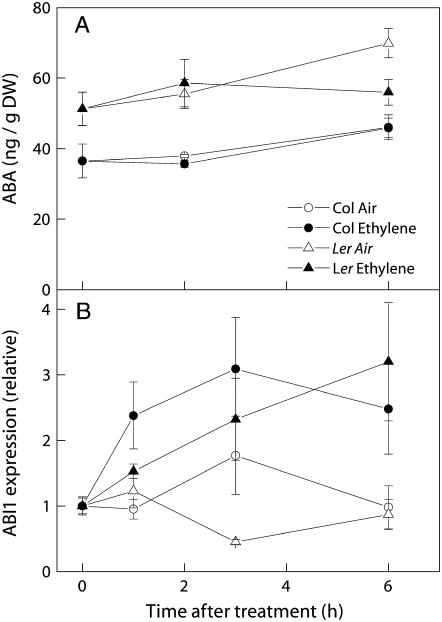
Ethylene treatment did not inhibit ABA levels in petioles of either Col-0 or Ler. ABA levels remained unchanged in Col-0 (Fig. 8A), while a slight (9%) increase in ABA level was observed in air-grown Ler after 6 h of treatment.
Figure 8.
Concentration of ABA (A) and relative expression of ABI1 (B) in petioles of Col-0 (circles) and Ler (triangles) treated with air (white symbols) or air containing 5 μL L−1 ethylene (black symbols). ABI1 expression was quantified relative to the value obtained at t = 0 h. Means of three or four (A) or six to 16 (B) replicates with ses.
Affymetrix microarray experiments were carried out for RNA derived from petioles of Col-0 plants treated with air or with 3 h of ethylene. This single time point was chosen because it marks the onset of ethylene-induced growth in Col-0. This experiment, using three biological replicates, revealed the up-regulation of 1,059 genes and down-regulation of 1,201 genes (out of 22,746 probe sets; described fully by Millenaar et al., 2006). Ethylene treatment did not alter expression of any of the ABA biosynthesis genes (Table I) nor any of the (catabolic) ABA 8′ hydroxylase genes. When only known ABA-related signal transduction genes were considered (Table I), the treatment induced very few changes; the strongest change was a 2.6-fold enhancement of the expression of ABI1, a negative regulator of ABA signal transduction. The only other statistically significant change was that of phospholipase C1 (PLC1, a positive regulator of ABA signaling), the expression of which was reduced by 37%. Expression of ABI1 and PLC1 was altered in a manner that may explain a negative relation between ethylene and ABA, especially if the observed changes were to differ between Col-0 and Ler. Thus, transcript levels of ABI1 and PLC1 were examined in more detail in both Col-0 and Ler using quantitative real-time reverse transcription (RT)-PCR. Unexpectedly, these experiments showed that the observed microarray results for PLC1 were inaccurate; no change in expression levels was observed for this gene in either Col-0 or Ler after 1, 3, or 6 h of ethylene treatment (data not shown). In contrast, the quantitative real-time RT-PCR data for ABI1 did confirm the microarray results, showing a 3.1-fold increase in Col-0 after 3-h treatment (Fig. 8B). An enhancement of ABI1 expression was also observed in Ler, although the lag phase for induction was longer in this accession. After 1 h of ethylene treatment, transcript levels in Col-0 rose over 2-fold (P < 0.05), whereas no significant increase was observed in Ler at that time point. After 6 h of ethylene treatment, however, expression of ABI1 was enhanced in both accessions.
Table I.
Changes in expression of genes involved in ABA biosynthesis or ABA signal transduction in Arabidopsis accession Col-0 treated with air or ethylene (5 μ L L−1) for 3 h using Affymetrix GeneChips
Values (in arbitrary units) represent means with standard errors of three independent biological replicates. Phospolipases are named according to Qin and Wang (2002). Small GTPases are named according to Yang (2002). Symbols for P values: b.t., Below threshold; n.s, not significant; *, 0.05 > P > 0.01; **, P < 0.01.
| Locus | Gene Code | Expression Air | Expression Ethylene | P | Percent Change |
|---|---|---|---|---|---|
| ABA biosynthesis | |||||
| ABA1 (ZEP) | At5g67030 | 1,512 ± 56 | 1,380 ± 94 | n.s. | |
| NCED1 | At3g63520 | 1,321 ± 77 | 1,283 ± 69 | n.s. | |
| NCED2 | At4g18350 | b.t. | b.t. | ||
| NCED3 | At3g14440 | b.t. | b.t. | ||
| NCED4 | At4g19170 | 1,055 ± 114 | 703 ± 65 | n.s. | |
| NCED5 | At1g30100 | b.t. | b.t. | ||
| NCED6 | At3g24220 | b.t. | b.t. | ||
| NCED9 | At1g78390 | b.t. | b.t. | ||
| ABA2 | At1g52340 | 328 ± 11 | 297 ± 9 | n.s. | |
| ABA3 | At1g16540 | b.t. | b.t. | ||
| AAO3 | At2g27150 | 100 ± 3 | 107 ± 2 | n.s. | |
| ABA catabolism | |||||
| CYP707A1 | At4g19230 | 80 ± 8 | 69 ± 2 | n.s. | |
| CYP707A2 | At2g29090 | 112 ± 5 | 111 ± 3 | n.s. | |
| CYP707A3 | At5g45340 | 115 ± 7 | 121 ± 3 | n.s. | |
| CYP707A4 | At3g19270 | b.t. | b.t. | ||
| Signal transduction | |||||
| ABI1 | At4g26080 | 355 ± 31 | 919 ± 18 | ** | 159 |
| ABI2 | At5g57050 | 98 ± 4 | 105 ± 4 | n.s. | |
| ABI3 | At3g24650 | 52 ± 2 | 50 ± 1 | n.s. | |
| ABI4 | At2g40220 | 78 ± 3 | 77 ± 7 | n.s. | |
| ABI5 | At2g36270 | 64 ± 3 | 67 ± 1 | n.s. | |
| ERA1 | At5g40280 | 174 ± 1 | 181 ± 11 | n.s. | |
| EIN2 (ERA3) | At5g03280 | 608 ± 18 | 563 ± 28 | n.s. | |
| FUS3 | At3g26790 | b.t. | b.t. | ||
| LEC1 | At1g21970 | 53 ± 1 | 50 ± 2 | n.s. | |
| FRY1 | At5g63980 | 1,408 ± 66 | 1,214 ± 30 | n.s. | |
| HYL1 | At1g09700 | b.t. | b.t. | ||
| ABH1 | At2g13540 | 308 ± 5 | 319 ± 10 | n.s. | |
| IP5PI | At1g34120 | 83 ± 1 | 92 ± 1 | n.s. | |
| IP5PII | At4g18010 | 97 ± 2 | 98 ± 5 | n.s. | |
| P2C-HA | At1g07430 | b.t. | b.t. | ||
| PP2C | At3g11410 | 385 ± 25 | 311 ± 7 | n.s. | |
| CDPK1 | At1g18890 | 147 ± 15 | 152 ± 7 | n.s. | |
| CDPK1a | At1g74740 | 55 ± 4 | 52 ± 4 | n.s. | |
| RAB18 | At5g66400 | 80 ± 6 | 69 ± 3 | n.s. | |
| Phospholipases | |||||
| PLC1 | At5g58670 | 1,014 ± 23 | 635 ± 19 | ** | −37 |
| PLC2 | At3g08510 | 2,764 ± 94 | 2,548 ± 155 | n.s. | |
| PLD a1 | At3g15730 | 1,721 ± 135 | 1,523 ± 44 | n.s. | |
| PLD a2 | At1g52570 | 160 ± 5 | 158 ± 6 | n.s. | |
| PLD a3 | At5g25370 | 144 ± 13 | 135 ± 11 | n.s. | |
| PLD a4 | At1g55180 | 110 ± 11 | 102 ± 8 | n.s. | |
| PLD b1 | At2g42010 | 124 ± 11 | 131 ± 7 | n.s. | |
| PLD b2 | At4g00240 | b.t. | b.t. | ||
| Small GTPases | |||||
| ROP2 | At1g20090 | 523 ± 37 | 382 ± 46 | n.s. | |
| ROP5 | At4g35950 | 455 ± 20 | 409 ± 29 | n.s. | |
| ROP6 | At4g35020 | 287 ± 19 | 264 ± 14 | n.s. | |
| ROP9 | At4g28950 | 90 ± 4 | 79 ± 2 | n.s. | |
| ROP10 | At3g48040 | 191 ± 12 | 191 ± 4 | n.s. |
DISCUSSION
We investigated whether ABA influenced ethylene-induced hyponastic growth in Arabidopsis petioles and whether the different responses of Col-0 and Ler could be contributed to a different interaction between the two hormones. The general picture shows an antagonistic relationship between ethylene and ABA signaling in the process of ethylene-induced petiole hyponasty. This relationship contrasts with findings from root elongation essays, where ethylene seems to enhance sensitivity to ABA (Beaudoin et al., 2000; Ghassemian et al., 2000). Such a contrast illustrates the complexity of hormone signaling networks and underlines that an observed relationship between hormones is likely to be specific for the tissue under examination and/or the developmental stage of the plant.
Ethylene-Induced Hyponasty in Ler Is Largely Insensitive to ABA
The potential for ABA to affect ethylene-induced hyponastic growth differed between accessions. In Col-0, a reduction of the endogenous ABA concentration, either genetically or pharmacologically, enhanced the hyponastic response. Also, hyponasty was strongly reduced in plants treated with, or hypersensitive for, ABA. In contrast, ethylene-induced hyponasty in Ler showed a different picture. Although treatment of fluridone or ABA to Ler did alter initial petiole angles, no effect was observed on ethylene-induced growth. Nearly identical results were observed for the aba1-1 mutant. The lack of enhanced hyponastic growth in this mutant was in stark contrast to the strong responses of aba2-1 and aba3-1 (Col-0). Yet, the aba1-1, aba2-1, and aba3-1 mutations were shown to result in similar reductions in endogenous ABA levels in shoots (Rock and Zeevaart, 1991; Leon-Kloosterziel et al., 1996), and all mutants showed comparable increases in initial petiole angles. Thus, it seems the capacity for ABA to influence petiolar angles is similar in the two accessions, but its capacity to inhibit the ethylene-induced growth response is significantly more pronounced in Col-0 than it is in Ler.
The ABA Concentration Does Not Change upon Ethylene Exposure
As a reduction in endogenous ABA is able to increase petiole angles in both accessions and enhances ethylene-induced growth (although only for Col-0), it could be hypothesized that ethylene induces these increased angles by lowering ABA biosynthesis or inhibiting its signaling pathway. Such a regulatory mechanism has been found in the semiaquatic R. palustris. In this species, ABA is a strong inhibitor of ethylene-induced hyponastic growth (Cox et al., 2004) and ethylene enhanced growth by reducing ABA biosynthesis while enhancing its degradation (Benschop et al., 2005). In Arabidopsis, increased levels of ABA were found in the ethylene-insensitive ein2 mutants (Ghassemian et al., 2000), suggesting that a similar regulatory mechanism could also be present in Arabidopsis. However, no decrease in ABA concentration was observed in Col-0 after 2 h of ethylene treatment (Fig. 8A), a time point at which hyponastic growth was already clearly noticeable (Fig. 1). Oddly, a small difference between control- and ethylene-treated plants did occur in Ler after 6 h of ethylene treatment. It is, however, unlikely that this small decrease is relevant for the observed physiological responses, as the actual concentration of ABA in ethylene-treated Ler plants never decreases to a level below that observed at the start of the treatment (t = 0; Fig. 8A).
ABA Insensitivity Restores Ethylene-Induced Hyponasty in Ler
Of the 10 mutants present in this screen, the most striking results were obtained from abi1-1 and abi3-1. The strongly enhanced hyponastic growth in these lines contrasted to findings from other Ler mutants that displayed an ABA-insensitive phenotype. Furthermore, abi1-1 and abi3-1 show that ethylene is not incapable of inducing a strong growth response in Ler. However, it seems only able to do so when an inhibitory mechanism is artificially removed. Thus, the difference in hyponastic growth response between Col-0 and Ler seems to lie in the ability of ethylene to lift an inhibitory signal that seems related to ABA and mediated by ABI1 and ABI3.
The impact of abi3-1 on the response was highly surprising, as, originally, ABI3 was thought to be exclusively expressed in seeds and not in vegetative tissue (Giraudat et al., 1992; Parcy et al., 1994). Later work did show postgermination expression of ABI3, although it was found to be restricted to the meristem (Rohde et al., 1999). Ectopic expression of ABI3 using a constitutive promoter influenced ABI1-dependent responses such as root growth and stomatal responses (Parcy and Giraudat, 1997; Suzuki et al., 2001). In contrast, the severe abi3-6 mutant did not show altered lateral root formation, suggesting that loss of ABI3 does not result in a strong phenotype in vegetative tissue. Our results indicate that ABI3 functioning is relevant to the process of ethylene-induced hyponastic growth, as a strong enhancement of this response is observed in the abi3-1 mutant. This finding also correlates with the observation of a strong repression of hyponastic growth in era1-2 (Fig. 3D), which was shown to have increased expression of ABI3 (Brady et al., 2003). The involvement of ABI3 in the ethylene-induced growth response is intriguing, as this gene is considered a point of cross talk between auxin and ABA signaling in seeds and roots (Suzuki et al., 2001). Auxin is a well-known regulator of various differential growth responses (Went and Thimann, 1937) and has been implicated as a regulator of ethylene-induced hyponastic growth in Arabidopsis (Cox, 2004). In seeds and roots, the presence of auxin enhanced the activity of ABI3, so that less exogenous ABA was required to inhibit germination (Nambara et al., 2002; Brady et al., 2003). If a similar relation exists in shoots, ABA might act, via ABI3, as some sort of negative feedback signal for auxin-induced differential growth.
Although the abi1-1 mutation causes ABA insensitivity, loss-of-function mutations in this gene were found to induce hypersensitivity to ABA (Gosti et al., 1999), indicating that ABI1 is a negative regulator of the ABA signaling pathway. This was supported by the observation that transient overexpression of ABI1 blocked both ABA-inducible and ABA-repressible gene expression in maize (Zea mays) mesophyll protoplasts (Sheen, 1998). Thus, the abi1-1 mutant acts as a gain-of-function mutation. The enhanced growth response observed in abi1-1 and the enhanced expression of ABI1 upon ethylene treatment point to a regulatory role for ABI1 in this process. However, ABI1 expression increases upon ethylene treatment to a similar extent in both accessions, indicating that transcription of this gene in itself is not the key regulator of ethylene-induced hyponastic growth. The observed increase in ABI1 transcript in our experiments is in partial agreement with data from De Paepe et al. (2004), who reported a transient up-regulation of both ABI1 and ABI2 in ethylene-treated Col-0 plants, with a maximal response after 1 to 2 h. Our data show that this enhancement is persistent for ABI1 for at least 6 h when only petiole tissue is studied.
ABI1 and ABI2 Contrast in Regulation of Hyponastic Growth
In contrast to abi1-1, no increase in either initial angles or ethylene-induced growth was observed for abi2-1. These contrasting responses were unexpected, as ABI1 and ABI2 are closely homologous proteins (protein phosphatase 2Cs) with overlapping functionality in ABA signaling (Koornneef et al., 1984; Leung et al., 1997). However, in leaves, ABI1 is much higher expressed compared to ABI2 (Leung et al., 1997), and the microarray data show that expression of ABI1 was also significantly higher than that of ABI2, indicating that ABI2 may be of reduced importance in petiole tissue.
Furthermore, other functional differences between the two proteins have been reported. For example, ABA-induced ADH expression was found to depend much more on a functional ABI2 gene compared to a functional ABI1 gene (de Bruxelles et al., 1996), while the ABA-induced expression of ATHB-7 depends on a functional ABI1 gene and not on ABI2 (Söderman et al., 1996). Drought rhizogenesis was found to be inhibited strongly by abi1-1 but not by abi2-1 (Vartanian et al., 1994). Recent work by Mishra et al. (2006) showed that stomatal closure was specifically mediated by ABI1. The absence of enhanced ethylene-induced growth in abi2-1 suggests that this process too is mediated specifically by ABI1.
Ethylene-Dependent and -Independent Regulation
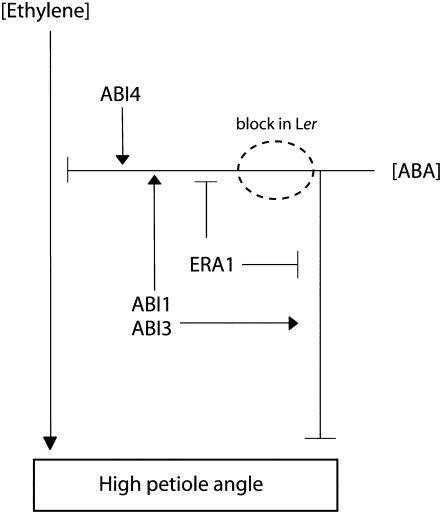
A proposed signaling pathway is presented in Figure 9, which includes the regulatory components described here, but undoubtedly omitting a number of other involved components. In general, it shows a positive regulatory effect of ethylene on petiole angles, while ABA acts as a negative regulator. ABA influences petiole angles in the absence of applied ethylene, implying that the two hormones act (at least partially) independent of each other. However, as a mutation in ABA signaling (at least in Col-0) affects ethylene-induced growth, some interaction between the two hormones also seems to be present. Thus, the action of ABA is divided in an ethylene-independent and -dependent response.
Figure 9.
Proposed signal transduction scheme for petiole hyponastic growth.
Ethylene-Independent Responses
The ethylene-independent effect of ABA on petiole angles is observed to a similar extent in both Col-0 as Ler. Pharmacological experiments (Fig. 6), as well as the initial angles observed in ABA biosynthesis mutants (Fig. 2) of both accessions, show that ABA is a negative regulator of petiole angles in Arabidopsis. This pathway seems mediated by ABI1, ABI3, ABI5, and ERA1. In contrast, ABI2 does not seem to be involved here, while ABI4 may actually be a negative regulator, considering the reduced initial angles observed in abi4-3 (Ws background; Fig. 5).
Ethylene-Dependent Responses
In Col-0, the positive effect of ethylene on petiole angles is enhanced when ABA or ABA signaling is reduced and is inhibited when ABA (or its signaling) is increased. This interaction effect seems mediated by ERA1, ABI1, ABI3, ABI4, and ABI5. Again, ABI2 does not seem to be involved in the process (and is thus not included in Fig. 9). The contrasting phenotype of ABI4, which seems to enhance the effect of ABA on ethylene but inhibit its independent pathway, is another indication that the independent and dependent pathways are distinct processes. Mishra et al. (2006) showed that the opening and closing of stomata is also controlled by different ABA signaling pathways.
So how are these signaling pathways different in Ler and Col-0? ABA influences initial angles the same in Col-0 and Ler. Thus, differences in regulation must be found in the ethylene-dependent pathway (indicated by a circle in Fig. 9). The data from abi1-1 and abi3-1 show that ethylene is capable of inducing a strong hyponastic response. However, a reduction in ABA biosynthesis (genetically or pharmaceutically) is unable to induce this same phenotype. In other words, ethylene-induced growth in Ler seems insensitive to ABA but not to its downstream signaling pathway, pointing to some sort of disconnection in Ler between ABA and downstream components. Interestingly, a similar conclusion was drawn when hyponastic growth induced by low light was compared to this ethylene-induced response. Millenaar et al. (2005) showed that, in contrast to ethylene, low-light treatment does induce a strong hyponastic growth in Ler.
So, in summary, it seems the response pathways in Col-0 and Ler are in fact more similar than they are contrasting. Both accessions are, in principle, capable of equally strong differential growth upon two seemingly unrelated external stimuli. However, it seems there is a distinct mutation in Ler that specifically prevents hyponastic growth upon exposure to ethylene but not low light. This mutation induces an insensitivity to ethylene to the capacity of ABA to modify the ethylene-induced response but not to ABA itself. This, and the ability of some (but not all) ABA signaling components to rescue this phenotype, suggests that the mutation could be a point of cross talk between the two hormone signaling pathways. The exact identity of this component is currently under investigation in our laboratory.
MATERIALS AND METHODS
Plant Material and Growth Conditions
Four Arabidopsis (Arabidopsis thaliana) accessions were used (with Nottingham Arabidopsis Stock Centre accession nos.): Col-0 (N1092); Ler (N20); C24 (N906); and Ws-2 (N1602). Plants were grown according to Millenaar et al. (2005). After germination, plants were transferred to 70-mL pots and kept at 20°C, 70% relative humidity, 9-h photoperiod, and 200 μmol m−2 s−1 photon flux density. In all experiments, petioles of 36-d-old (from sowing) plants were used.
Measurements of Petiole Angles
To measure changes in petiole angle, time-lapse photography was used according to Millenaar et al. (2005). In this flow-through system, relative humidity was kept at 70%. To enable continuous photography, no dark period was included in the 24-h experimental period. On the day before the experiment, plants were placed singly in glass cuvettes with the petiole of study perpendicular to the axis of the camera. To facilitate measurement, leaves that were obscuring the petiole base were removed. Additionally, the petiole was marked at the petiole/lamina junction with drawing ink. We examined the hyponastic response of a single petiole on each plant. The leaf that was studied generally ranged from the eighth to the 10th counting from the base, and care was taken that leaves in a similar developmental stage were analyzed. A marked calibration scale was placed in the soil in the same plane as the petiole. These preparations did not influence the response of the petiole to ethylene (data not shown). All experiments started at 9:30 am to avoid artefacts resulting from circadian rhythms.
Image Analysis and Calculations
Digital photographs (1,280 × 1,000 pixels) of the same plant were taken every 10 min. The angle of the petiole was then determined with a KS400 (version 3.0) software package (Carl Zeiss Vision). Petiole angles were measured as the angle between the applied ink mark and a fixed basal point of the petiole (that was determined using 10 random photographs), compared to the horizontal. For all replicate plants, the change in petiole angle compared to t = 0 h was calculated for every time point. Because a number of the hormone mutants as well as wild types showed a change in petiole angle in air, we corrected for this according to Cox et al. (2004) by subtracting the values of an untreated plant from those of a treated plant for each time point, giving a differential change in petiole angle over the 24 h of the experiment. Statistical differences were determined using Student's t tests on Excel 2000 (Microsoft).
Treatment with Ethylene, ABA, and Fluridone
Treatment with 5 μL L−1 ethylene in a flow-through system took place as described by Millenaar et al. (2005). ABA (Sigma-Aldrich) was dissolved in 96% ethanol to a final concentration of 20 mm and diluted with tap water to 20 μm. ABA was applied, 1 h prior to the start of ethylene treatment, by spraying the shoot with this solution. Additionally, the pots were placed in a petri dish containing 10 mL of the 20 μm ABA solution. Fluridone (Duchefa) was dissolved in acetone to a concentration of 100 mm and diluted in tap water to give a pretreatment solution containing 100 μm. Plants were pretreated once, 72 h before the start of the experiment, by administering 10 mL (1 μmol/plant) of this pretreatment solution to the soil. Control plants were pretreated in a similar fashion with a solution of tap water containing 0.1% acetone.
ABA Analysis
Per sample, 20 mg of freeze-dried petiole tissue was homogenized in liquid nitrogen and extracted in 5 mL 80% (v/v) methanol containing 20 mg L−1 butylated hydroxytoluene in the presence of 6 ng deuterated ABA and 50 kBq 3H-ABA (Sigma-Aldrich). Extractions were then performed according to Benschop et al. (2005), except that the final eluate containing ABA was further purified by HPLC (Hypersil ODS 250- × 4.6-mm column [30105–254630, Alltech] on a 40-min gradient from 10% methanol to 100% methanol, 1 mL min−1 flow rate, one fraction collected per minute). The fraction containing ABA was identified by scintillation counting. This fraction was then subjected to gas chromatography-mass spectrometry analysis (Agilent 5890 MSD). Ions at mass-to-charge ratio 190 and 162 (ABA) and 193 and 165 (2H3-ABA) were monitored under conditions described by Whitford and Croker (1991).
Microarray Hybridization and Analysis
Microarray hybridization and GeneChip data analysis were performed as described in Millenaar et al. (2006). Col-0 plants in stage 3.9 (Boyes et al., 2001) were treated for 3 h with air or 5 μL L−1 ethylene, as described above. Petioles were harvested and immediately frozen in liquid nitrogen. RNA was isolated from these petioles with the RNAeasy extraction protocol from Qiagen. Calculations were performed according to Irizarry et al. (2003a, 2003b).
Real-Time RT-PCR
Plants were treated for up to 6 h with air or 5 μL L−1 ethylene, as described above. After treatment, petioles were harvested and immediately frozen in liquid nitrogen. For one RNA sample, eight petioles of two plants were pooled and ground in liquid nitrogen. Total RNA was isolated from Arabidopsis petioles using RNeasy Plant Mini kit (Qiagen). Genomic DNA was removed using the DNA-Free kit (Ambion). cDNA was synthesized using 1 μg total RNA with Superscript III RNase H- Reverse Transcriptase (Invitrogen) using random hexamer primers. Real-time RT-PCR reactions were performed on MyiQ Single-Color Real-Time PCR Detection system and software using iQ SYBR Green Supermix fluorescein (Bio-Rad Laboratories).
Real-time PCR was conducted (12.5 μL SYBR Green Supermix fluorescein, 100 pmol of each primer, and 1 μL cDNA in 25 μL total volume) for 40 cycles with the following temperatures: 30 s at 95°C denaturation, 30 s at 60°C annealing, and 60 s at 72°C extension. For ABI1 (Col-0, At4g26080.1; Ler, ATL8c21825, which are 100% homologous in the analyzed domain), the following primers have been used: 5′-TGAAGAAGCGTGTGAGATGG-3′ and 5′-CTGTATCGCCAGCTTTGACA-3′, which gave a single product of 160 bp in both accessions on cDNA. PCR efficiencies were comparable as determined by the LinRegPCR software package (Ramakers et al., 2003). For α-tubulin-6 (At5g12250; Czechowski et al., 2004), the following primers have been used for both accessions: 5′-ATAGCTCCCCGAGGTCTCTC-3′ and 5′-TCCATCTCGTCCATTCCTTC-3′ (136-bp product). Melt curves showed single products for all samples. Relative mRNA values were calculated using the comparative threshold cycle method described by Livak and Schmittgen (2001), expressing mRNA values of ABI1 relative to α-tubulin-6. Primer efficiency was confirmed by running a dilution series of amplified cDNA fragments with the same PCR protocol as described above. All obtained threshold cycle values were obtained from PCR reactions with efficiencies close to 2 (data not shown).
Acknowledgments
We thank Professor M.B. Jackson, Professor C.M.J. Pieterse, and Dr. M. Proveniers for critical reading of this manuscript. The abi4-3 mutant and the corresponding C24 wild type were a kind gift of Professor S. Smeekens (Utrecht University, The Netherlands). Other mutants were obtained from the Nottingham Arabidopsis Stock Centre (Nottingham, UK) or from the laboratory of Professor M. Koornneef (Wageningen University and Research Center, The Netherlands). We thank M. Terlou (Utrecht University) for developing the image analysis macro in KS400 for analysis of the photographs.
This work was supported by the Dutch Science Foundation (PIONIER grant no. 800–84–470).
The author responsible for distribution of materials integral to the findings presented in this article in accordance with the policy described in the Instructions for Authors (www.plantphysiol.org) is: Anton J.M. Peeters (a.j.m.peeters@bio.uu.nl).
Open Access articles can be viewed online without a subscription.
References
- Allen GJ, Kuchitsu K, Chu SP, Murata Y, Schroeder JI (1999) Arabidopsis abi1-1 and abi2-1 phosphatase mutations reduce abscisic acid-induced cytoplasmic calcium rises in guard cells. Plant Cell 11 1785–1798 [DOI] [PMC free article] [PubMed] [Google Scholar]
- Ballaré CL (1999) Keeping up with the neighbours: phytochrome sensing and other signalling mechanisms. Trends Plant Sci 4 97–102 [DOI] [PubMed] [Google Scholar]
- Beaudoin N, Serizet C, Gosti F, Giraudat J (2000) Interactions between abscisic acid and ethylene signaling cascades. Plant Cell 12 1103–1115 [DOI] [PMC free article] [PubMed] [Google Scholar]
- Benschop JJ, Jackson MB, Guhl K, Vreeburg RAM, Croker SJ, Peeters AJM, Voesenek LACJ (2005) Contrasting interactions between ethylene and abscisic acid in Rumex species differing in submergence tolerance. Plant J 44 756–768 [DOI] [PubMed] [Google Scholar]
- Boyes DC, Zayed AM, Ascenzi R, McCaskill AJ, Hoffman NE, Davis KR, Gorlach J (2001) Growth stage-based phenotypic analysis of Arabidopsis: a model for high throughput functional genomics in plants. Plant Cell 13 1499–1510 [DOI] [PMC free article] [PubMed] [Google Scholar]
- Brady SM, Sarkar SF, Bonetta D, McCourt P (2003) The abscisic acid insensitive 3 (Abi3) gene is modulated by farnesylation and is involved in auxin signaling and lateral root development in Arabidopsis. Plant J 34 67–75 [DOI] [PubMed] [Google Scholar]
- Cox MCH (2004) Plant movement, kinetics and hormonal regulation of hyponastic growth and petiole elongation. PhD thesis. Utrecht University, Utrecht, The Netherlands
- Cox MCH, Benschop JJ, Vreeburg RAM, Wagemakers CAM, Moritz T, Peeters AJM, Voesenek LACJ (2004) The roles of ethylene, auxin, abscisic acid, and gibberellin in the hyponastic growth of submerged Rumex palustris petioles. Plant Physiol 136 2948–2960 [DOI] [PMC free article] [PubMed] [Google Scholar]
- Cox MCH, Millenaar FF, van Berkel YEMD, Peeters AJM, Voesenek LACJ (2003) Plant movement: submergence-induced petiole elongation in Rumex palustris depends on hyponastic growth. Plant Physiol 132 282–291 [DOI] [PMC free article] [PubMed] [Google Scholar]
- Cox MCH, Peeters AJM, Voesenek LACJ (2006) The stimulating effects of ethylene and auxin on petiole elongation and on hyponastic curvature are independent processes in submerged Rumex palustris. Plant Cell Environ 29 282–290 [DOI] [PubMed] [Google Scholar]
- Czechowski T, Bari RP, Stitt M, Scheible WR, Udvardi MK (2004) Real-time RT-PCR profiling of over 1400 Arabidopsis transcription factors: unprecedented sensitivity reveals novel root- and shoot-specific genes. Plant J 38 366–379 [DOI] [PubMed] [Google Scholar]
- de Bruxelles GL, Peacock WJ, Dennis ES, Dolferus R (1996) Abscisic acid induces the alcohol dehydrogenase gene in Arabidopsis. Plant Physiol 111 381–391 [DOI] [PMC free article] [PubMed] [Google Scholar]
- De Paepe A, Vuylsteke M, van Hummelen P, Zabeau M, van der Straeten D (2004) Transcriptional profiling by cDNA-AFLP and microarray analysis reveals novel insights into the early response to ethylene in Arabidopsis. Plant J 39 537–559 [DOI] [PubMed] [Google Scholar]
- Finkelstein RR, Gampala SSL, Rock CD (2002) Abscisic acid signaling in seeds and seedlings. Plant Cell 14 S15–S45 [DOI] [PMC free article] [PubMed] [Google Scholar]
- Ghassemian M, Nambara E, Cutler S, Kawaide H, Kamiya Y, McCourt P (2000) Regulation of abscisic acid signaling by the ethylene response pathway in Arabidopsis. Plant Cell 12 1117–1126 [DOI] [PMC free article] [PubMed] [Google Scholar]
- Giraudat J, Hauge BM, Valon C, Smalle J, Parcy F, Goodman HM (1992) Isolation of the Arabidopsis-ABI3 gene by positional cloning. Plant Cell 4 1251–1261 [DOI] [PMC free article] [PubMed] [Google Scholar]
- Gosti F, Beaudoin N, Serizet C, Webb AAR, Vartanian N, Giraudat J (1999) ABI1 protein phosphatase 2C is a negative regulator of abscisic acid signaling. Plant Cell 11 1897–1909 [DOI] [PMC free article] [PubMed] [Google Scholar]
- Hansen H, Grossmann K (2000) Auxin-induced ethylene triggers abscisic acid biosynthesis and growth inhibition. Plant Physiol 124 1437–1448 [DOI] [PMC free article] [PubMed] [Google Scholar]
- Himmelbach A, Yang Y, Grill E (2003) Relay and control of abscisic acid signaling. Curr Opin Plant Biol 6 470–479 [DOI] [PubMed] [Google Scholar]
- Hoffmann-Benning S, Kende H (1992) On the role of abscisic-acid and gibberellin in the regulation of growth in rice. Plant Physiol 99 1156–1161 [DOI] [PMC free article] [PubMed] [Google Scholar]
- Huijser C, Kortstee A, Pego J, Weisbeek P, Wisman E, Smeekens S (2000) The Arabidopsis SUCROSE UNCOUPLED-6 gene is identical to ABSCISIC ACID INSENSITIVE-4: involvement of abscisic acid in sugar responses. Plant J 23 577–585 [DOI] [PubMed] [Google Scholar]
- Irizarry RA, Bolstad BM, Collin F, Cope LM, Hobbs B, Speed TP (2003. a) Summaries of Affymetrix GeneChip probe level data. Nucleic Acids Res 31 e15. [DOI] [PMC free article] [PubMed] [Google Scholar]
- Irizarry RA, Hobbs B, Collin F, Beazer-Barclay YD, Antonellis KJ, Scherf U, Speed TP (2003. b) Exploration, normalization, and summaries of high density oligonucleotide array probe level data. Biostatistics 4 249–264 [DOI] [PubMed] [Google Scholar]
- Jackson MB (2002) Long-distance signalling from roots to shoots assessed: the flooding story. J Exp Bot 53 175–181 [DOI] [PubMed] [Google Scholar]
- Kang BG (1979) Epinasty. In W Haupt, ME Feinleib, eds, Physiology of Movements. Springer-Verlag, Berlin, pp 647–667
- Koornneef M, Reutling G, Karssen CM (1984) The isolation and characterization of abscisic acid-insensitive mutants of Arabidopsis thaliana. Physiol Plant 61 377–383 [Google Scholar]
- LeNoble ME, Spollen WG, Sharp RE (2004) Maintenance of shoot growth by endogenous ABA: genetic assessment of the involvement of ethylene suppression. J Exp Bot 55 237–245 [DOI] [PubMed] [Google Scholar]
- Leon-Kloosterziel KM, Gil MA, Ruijs GJ, Jacobsen SE, Olszewski NE, Schwartz SH, Zeevaart JAD, Koornneef M (1996) Isolation and characterization of abscisic acid-deficient Arabidopsis mutants at two new loci. Plant J 10 655–661 [DOI] [PubMed] [Google Scholar]
- Leung J, Merlot S, Giraudat J (1997) The Arabidopsis ABSCISIC ACIDINSENSITIVE 2 (ABI2) and ABI1 genes encode redundant protein phosphatases 2C involved in abscisic acid signal transduction. Plant Cell 9 759–771 [DOI] [PMC free article] [PubMed] [Google Scholar]
- Livak KJ, Schmittgen TD (2001) Analysis of relative gene expression data using real-time quantitative PCR and the 2(T)(-delta delta C) method. Methods 25 402–408 [DOI] [PubMed] [Google Scholar]
- Millenaar FF, Cox MCH, van Berkel YEMD, Welschen RAM, Pierik R, Voesenek LACJ, Peeters AJM (2005) Ethylene-induced differential growth of petioles in Arabidopsis: analyzing natural variation, response kinetics, and regulation. Plant Physiol 137 998–1008 [DOI] [PMC free article] [PubMed] [Google Scholar]
- Millenaar FF, Okyere J, May ST, van Zanten M, Voesenek LACJ, Peeters AJM (2006) How to decide? Different methods of calculating gene expression from short oligonucleotide array data will give different results. BMC Bioinformatics 7 137. [DOI] [PMC free article] [PubMed] [Google Scholar]
- Mishra G, Zhang W, Deng F, Zhao J, Wang X (2006) A bifurcating pathway directs abscisic acid effects on stomatal closure and opening in Arabidopsis. Science 312 264–266 [DOI] [PubMed] [Google Scholar]
- Nambara E, Suzuki M, Abrams S, McCarty DR, Kamiya Y, McCourt P (2002) A screen for genes that function in abscisic acid signaling in Arabidopsis thaliana. Genetics 161 1247–1255 [DOI] [PMC free article] [PubMed] [Google Scholar]
- Nilsen ET (1991) The relationship between freezing tolerance and thermotropic leaf movement in 5 rhododendron species. Oecologia 87 63–71 [DOI] [PubMed] [Google Scholar]
- Parcy F, Giraudat J (1997) Interactions between the ABI1 and the ectopically expressed ABI3 genes in controlling abscisic acid responses in Arabidopsis vegetative tissues. Plant J 11 693–702 [DOI] [PubMed] [Google Scholar]
- Parcy F, Valon C, Raynal M, Gaubiercomella P, Delseny M, Giraudat J (1994) Regulation of gene-expression programs during Arabidopsis seed development: roles of the ABI3 locus and of endogenous abscisic-acid. Plant Cell 6 1567–1582 [DOI] [PMC free article] [PubMed] [Google Scholar]
- Pierik R, Visser EJW, De Kroon H, Voesenek LACJ (2003) Ethylene is required in tobacco to successfully compete with proximate neighbours. Plant Cell Environ 26 1229–1234 [Google Scholar]
- Qin C, Wang X (2002) The Arabidopsis phospholipase D family: characterization of a calcium-independent and phosphatidylcholine-selective PLD zeta 1 with distinct regulatory domains. Plant Physiol 128 1057–1068 [DOI] [PMC free article] [PubMed] [Google Scholar]
- Ramakers C, Ruijter JM, Deprez RHL, Moorman AFM (2003) Assumption-free analysis of quantitative real-time polymerase chain reaction (PCR) data. Neurosci Lett 339 62–66 [DOI] [PubMed] [Google Scholar]
- Razem FA, El-Kereamy A, Abrams SR, Hill RD (2006) The RNA-binding protein FCA is an abscisic acid receptor. Nature 439 290–294 [DOI] [PubMed] [Google Scholar]
- Rock CD, Zeevaart JAD (1991) The aba1 mutant of Arabidopsis thaliana is impaired in epoxy-carotenoid biosynthesis. Proc Natl Acad Sci USA 88 7496–7499 [DOI] [PMC free article] [PubMed] [Google Scholar]
- Rohde A, Van Montagu M, Boerjan W (1999) The abscisic acid-insensitive 3 (ABI3) gene is expressed during vegetative quiescence processes in Arabidopsis. Plant Cell Environ 22 261–270 [Google Scholar]
- Sheen J (1998) Mutational analysis of protein phosphatase 2C involved in abscisic acid signal transduction in higher plants. Proc Natl Acad Sci USA 95 975–980 [DOI] [PMC free article] [PubMed] [Google Scholar]
- Söderman E, Mattsson J, Engstrom P (1996) The Arabidopsis homeobox gene ATHB-7 is induced by water deficit and by abscisic acid. Plant J 10 375–381 [DOI] [PubMed] [Google Scholar]
- Suzuki M, Kao CY, Cocciolone S, McCarty DR (2001) Maize VP1 complements Arabidopsis abi3 and confers a novel ABA/auxin interaction in roots. Plant J 28 409–418 [DOI] [PubMed] [Google Scholar]
- Vandenbussche F, Vriezen WH, Smalle J, Laarhoven LJJ, Harren FJM, Van Der Straeten D (2003) Ethylene and auxin control decreased light intensity. Plant Physiol 133 517–527 [DOI] [PMC free article] [PubMed] [Google Scholar]
- Vartanian N, Marcotte L, Giraudat J (1994) Drought rhizogenesis in Arabidopsis thaliana: differential responses of hormonal mutants. Plant Physiol 104 761–767 [DOI] [PMC free article] [PubMed] [Google Scholar]
- Went F, Thimann K (1937) Phytohormones. Macmillan, New York
- Whitford PN, Croker SJ (1991) An homogeneous radioimmunoassay for abscisic acid using a scintillation proximity assay technique. Phytochem Anal 2 134–136 [Google Scholar]
- Yang ZB (2002) Small GTPases: versatile signaling switches in plants. Plant Cell 14 S375–S388 [DOI] [PMC free article] [PubMed] [Google Scholar]
- Zeevaart JAD (1983) Metabolism of abscisic acid and its regulation in Xanthium leaves during and after water stress. Plant Physiol 71 477–481 [DOI] [PMC free article] [PubMed] [Google Scholar]
- Zeevaart JAD, Creelman RA (1988) Metabolism and physiology of abscisic acid. Annu Rev Plant Physiol Plant Mol Biol 39 439–473 [Google Scholar]


