

Abstract
Glucan plays a central role in sucrose-dependent biofilm formation by the dental pathogen Streptococcus mutans. This organism synthesizes several proteins capable of binding glucan. These are divided into the glucosyltransferases (Gtfs) that catalyze the synthesis of glucan and the non-Gtf glucan-binding proteins (Gbps). The biological significance of the Gbps has not been thoroughly defined, but studies suggest these proteins influence virulence and play a role in maintaining biofilm architecture by linking bacteria and extracellular molecules of glucan. We engineered a panel of Gbp mutants, targeting GbpA, GbpC, and GbpD, in which each gene encoding a Gbp was deleted individually and in combination. These strains were then analyzed by confocal microscopy and the biofilm properties quantified by the biofilm quantification software COMSTAT. All biofilms produced by mutant strains lost significant depth, but the basis for the reduction in height depended on which particular Gbp was missing. The loss of the cell-bound GbpC appeared dominant as might be expected based on losing the principal receptor for glucan. The loss of an extracellular Gbp, either GbpA or GbpD, also profoundly changed the biofilm architecture, each in a unique manner.
Introduction
Streptococcus mutans, the main etiological agent in the formation of dental caries, promotes tooth decay through the ability to adhere and accumulate large numbers on the tooth surface, as well as produce and tolerate large amounts of acid (Hamada & Slade, 1980;Loesche, 1986). Biofilm formation occurs through the synthesis of water-soluble (dextran) and water-insoluble (mutan) glucans via the catalyzing activity of the glucosyltransferase enzymes (Gtfs) (Tamesada et al., 1997;Wu-Yuan et al., 1978;Yu et al., 1997). Glucan is believed to be the major factor contributing to the ability of S. mutans to adhere to the tooth surface and for aggregation of the bacterial cells within a biofilm (Munro et al., 1995).
Attempts to find a glucan cell surface receptor, in order to define the poorly understood interaction of glucan with the S. mutans cell surface, utilized affinity chromatography of S. mutans proteins through a glucan column and yielded several non-enzymatic glucan-binding proteins (Gbps). Glucan-binding protein A (GbpA; 563 amino acids, 59kDa) was the first protein discovered and, along with the recently discovered GbpD (726 amino acids, 76kDa), contains similar carboxyl terminal repeats to those that make up the glucan binding domain of the Gtf Enzymes (Banas et al., 1990;Shah & Russell, 2004). The glucan-binding domain of GbpC (583 amino acids, 63.5kDa) has not been identified but this protein has been shown to promote dextran-dependent aggregation (DDAG) in vitro under stressful conditions (Sato et al., 1997). While GbpA, GbpC and GbpD are each secreted, only GbpA and GbpD are released; GbpC is cell wall bound and is believed to play a role in bacterial aggregation during biofilm formation (Sato et al., 2002b). GbpB was the second Gbp discovered through affinity column experiments. It appears to be an essential peptidoglycan hydrolase whose glucan-binding properties are still largely undefined (Chia et al., 2001;Chia, 2002;Mattos-Graner et al., 2001;Smith et al., 1994). Since viable GbpB mutants are difficult to obtain, or grow very poorly, gbpB mutants were not included in the panel of mutants analyzed in this report.
While the precise functions of GbpA, GbpC, and GbpD have yet to be clearly defined, evidence accumulated to date suggests that they play a role in biofilm formation and virulence (Banas, 2004). Deletion of the gbpA gene was shown to affect virulence (Hazlett et al., 1998; Matsumura et al., 2003), and in vitro biofilms formed by a gbpA knockout strain yielded an altered biofilm architecture consisting of shorter microcolony heights and a more even distribution across the substratum (Hazlett et al., 1999). GbpC promotes in vitro DDAG and several groups have reported a decrease in virulence from strains that do not produce GbpC (Matsumura et al., 2003;Nakano et al., 2002;Sato et al., 2002a). It is possible that GbpC interacts with dextrans produced by primary plaque colonizing species or is produced in response to stresses in the oral cavity and results in aggregation of the bacteria (Sato et al., 2002b). Investigations of GbpD are still at an early stage but Shah and Russell (2004) report that gbpD mutants show aggregate cohesiveness and smooth surface adherence similar to the Hazlett et al 1998 gbpA mutants. They also found GbpD to have lipase activity (Shah & Russell, 2004).
Clearly, the non-GTF GBPs influence virulence and in vitro phenotypes traditionally associated with sucrose-dependent adhesion and accumulation. In order to more completely understand the contribution of each of the GBPs to the pathogenic potential of S. mutans, we engineered a panel of mutants with each GBP deleted individually and in combination to examine the specific effect that these mutations have on biofilm structure. It is known that biofilm architecture is an important factor in the biology and virulence of biofilm forming bacteria (Beyenal et al., 2004).
Materials and Methods
Strains and Culture Conditions
The strains used were: E. coli JM109 (Promega, Madison, WI, USA), S. mutans UA130 was used as the wild-type (WT), and S. mutans UA130/gbpA::erm (Hazlett et al., 1998). E. coli were cultured in 2xYT broth (Becton, Dickenson and Co., Sparks, MD, USA) at 37°C. S. mutans were cultured on Todd Hewitt (Becton, Dickenson and Co.) plates and in Chemically Defined Media (CDM) (JRH Biosciences, Inc., Lenexa, KA, USA) and were grown at 37°C in an anaerobic chamber (5% CO2, 10% H2, 85% N2). Biofilms were cultured in CDM with 5% sucrose and grown at 37°C in 5% CO2.
Construction of Glucan-Binding Protein Mutants
Gene sequences for gbpC and gbpD, based on the S. mutans UA159 sequence (primer sequences in Table 1), were amplified using Eppendorf HotMaster Taq polymerase (Eppendorf AG, Hamburg, Germany) (Ajdic et al., 2002). The strategy for engineering the mutations was allelic replacement. Since this had already been completed for gbpA (Banas & Gilmore, 1991), it was undertaken for gbpC and gbpD. For each of these genes an internal portion of the gene was deleted and replaced with an antibiotic resistance cassette. The PCR product for each gene was cloned into the pGEMR-T Easy Vector (Promega, Madison, WI, USA) to obtain pGBPC and pGBPD respectively. An internal portion of gbpC was removed by digesting pGBPC with the restriction enzymes Bsu361 and BamH1. Since Bsu361 cut at a single site, the initial digestion was with this enzyme followed by blunting of the DNA ends and digestion with BamH1. The plasmid construct containing the 5′ and 3′ portions of the gene was gel purified using the GeneClean system (Q-BIOgene, Carlsbad, CA, USA). The spectinomycin (spec) gene was amplified from plasmid pDL278 (LeBlanc et al., 1992) and ligated into the TA cloning vector pCR2.1 (Invitrogen, Carlsbad, CA, USA). The spec gene was digested from the plasmid using EcoRV and BamHI and inserted into similarly digested pGBPC using T4 ligase (Promega, Madison, WI, USA) to obtain pGBPCspec. The gbpC::Spec gene was amplified using the aforementioned gbpC primers and the product was used to transform S. mutans WT and gbpA::Erm by the transformation method described by Li et al. (Li et al., 2001). Similarly, the gbpD gene was amplified and inserted into the pGEMR-T Easy Vector, an interior portion was excised using restriction enzymes EcoRV and MunI, and replaced with a kanamycin (kan) resistance gene cassette from plasmid pDL276 (Dunny et al., 1991) to obtain plasmids pGBPD and pGBPDkan respectively. The gbpD::kan sequence was amplified from pGBPDkan and used to transform S. mutans WT (UA130), gbpA::Erm, gbpC::Spec, and gbpA::Erm/gbpC::Spec. The resulting strains represented a panel of mutants where each glucan binding protein gene (gbpA, gbpC and gbpD) was knocked out individually and in combination.
Table 1.
Oligos Synthesized for This Study
| Product | Forward Sequence | Reverse Sequence |
|---|---|---|
| spc | ATAACGTAACGTGACTGGCAAG | GACGAGAAAGTTATGCAAGGGTTTA |
| gbpC | GATAAGAGAAAGCACTTTGG | CTTTTTTGTCCCAACCTC |
| gbpC probe | TGGCATAAAAATCTTGTTGT | Use gbpC reverse primer |
| km | GCATAGGCAGCGCGCTTATCA | GGTCCCGAGCGCCTACGAG |
| gbpD | AGTCACACGCATGCATAATATAGAAAGA | TGTTATTCTAGACTTCGCTGACCATTTA |
| gbpA probe | TGGCAGATTATTGATGGTA | GAGTATGAAATCTGCTCGTT |
Screening of Mutant Panel
To confirm the correct genetic engineering of the mutant panel, each strain was analyzed by PCR and Southern hybridization. Genomic DNA was isolated from S. mutans WT and each mutant using the Gram Positive Genomic DNA Extraction Kit (Epicenter, Madison, WI, USA). Genomic DNA was digested with HindIII (for gbpA mutations), BstXI (for gbpC mutations) or MunI (for gbpD mutations). Each digest of the WT and mutant panel was separated on a 0.5X TBE agarose gel and transferred to a nylon membrane (Roche, Indianapolis, IA, USA) by capillary Southern transfer. Probes, all based on the UA159 sequence, were generated using the Roche Dig DNA Labeling Kit (Roche). The 3′ probe for the gbpA gene was generated from the PCR product of a portion of a HindIII gene fragment that measured 3.5 kb in the WT gene and 3.1kb in the mutant (Figure 1A (Top Panel)). A PCR product from the 3′ portion of the gbpC gene was used to generate a probe that bound to a BstXI gene fragment that measured 3.1 kb in the WT and 1.3 kb in the mutant gbpC gene due to a BstXI site within the spec gene. A 3′ probe for the gbpD gene was isolated by restriction digestion from pGBPD using restriction enzymes MunI and EcoRI. This fragment was used to generate a probe that bound a MunI digested fragment that measured 2.1 kb in the WT gene and 5.9 kb in the mutant due to the loss of the MunI site from the excised portion of the gbpD gene. Dig labeled probes were generated using the Dig DNA Labeling Kit (Roche) and probe concentration was measured by dot blot analysis where serial dilutions of labeled probe were blotted and compared to standards from the kit. Probes were also generated to a λ DNA/StyI digest that was used as a molecular weight marker.
Figure 1. Mutant verification.
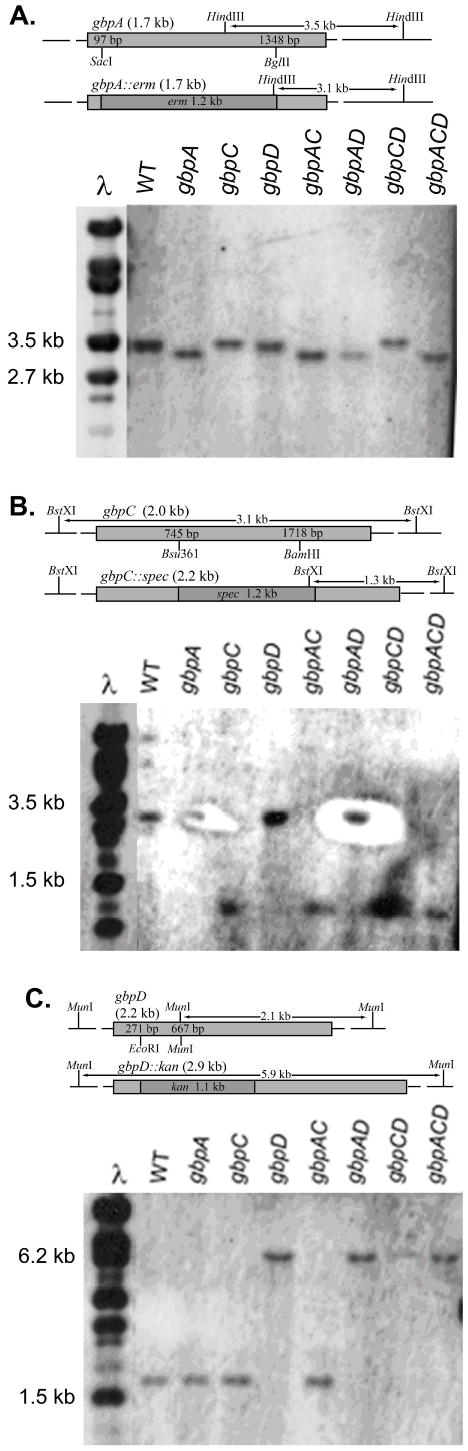
Schematic diagrams and Southern blots of genomic DNA from the mutant panel digested with A) HindIII and probed with gbpA, B) BstXI and probed with gbpC, and C) MunI and probed with gbpD. Diagrams illustrate the region of DNA replaced by antibiotic resistance and the differences in the respective restriction fragment sizes caused by the mutation.
Membranes were prehybridized in Dig Easy Hyb buffer (Roche) for 30 min and hybridized in 7 ml [10ng ml−1] of the respective probe at 48° C for 16 h. Hybridized membranes were washed in 2X SSC/0.1% SDS for 5 min twice at RT and then in 0.5X SSC/0.1% SDS for 15 min twice at 65°C. Membranes were rinsed in maleic acid buffer pH 7.5 and blocked for 30 min with the blocking reagent supplied with the Roche Dig DNA Labeling Kit (Roche). After washing in maleic acid/0.03% Tween 20 (Fisher, Pittsburgh, PA, USA), the membrane was incubated in AP labeled anti-Dig antibody (Roche) (75 mU ml−1) for 1 h. Membrane was washed twice and developed with CSPD Chemiluminescence Substrate (Roche) for 5 min and exposed to X-ray film.
Growth curves
Planktonic growth rates were measured for mutants grown in CDM without sucrose by measuring the OD540 of each mutant over time after O/N cultures were normalized to an OD of 0.04. Data points were fit by a least squares method using the nonlinear regression module of Statistica software. The growth rate was determined by using the logistic function OD540=mn + (mx-mn)(1/(1+exp(4S(ht-TIME)/(mx – mn)) where mx is the final or maximum OD, mn is the initial or minimum OD, ht is the time to half max OD and the time to the maximal change in OD with respect to time, and S is the maximal rate of change (Feustel, P. personal communication). The slope of the curve at 50% max OD is the max growth rate and is used to compare growth rates among the mutants.
Biofilms
Biofilms, for confocal analysis were grown on glass coverslips as previously described in Banas et al (Banas et al., 2001). Briefly, 1.5 cm diameter wells containing 1.5 mls of CDM/5% sucrose were inoculated with 100ol of a 1.0 OD540 culture of S. mutans. Biofilm cultures were grown in chambered coverglass at 37°C in 5% CO2 on a fixed angle rotator at a rotation speed 10 RPM and an angle of 60° for 12 h. Chambered coverglass units were assembled by removing the 1.5 cm diameter, round chambers from Sonic Seal slide wells (Nunc, Rochester, NY, USA) and gluing them to coverglass slips (Nunc, Rochester, NY, USA) with Krazy Glue (Elmer’s, Columbus, OH, USA).
Confocal microscopy and image analysis
Twelve hour biofilms were rinsed 2 X in PBS and stained for 35 min. with Syto9 (Molecular Probes, Inc., Eugene, OR, USA) and then rinsed twice with PBS. 1 ml of PBS was added to the wells to prevent drying of the biofilm during image collection. Biofilm images were collected using a Zeiss 510 Meta inverted confocal laser scanning microscope (Carl Zeiss MicroImaging, Inc., Thornwood, NY, USA) using a 40x objective that was zoomed out to 0.7. Five independent biofilm experiments were performed and at least 5 image stacks per experiment were collected.
Image stacks were converted to individual grayscale Tiff images for each slice using the 510 Meta Image Analysis software package (Carl Zeiss MicroImaging, Inc., Thornwood, NY, USA). COMSTAT was used to analyze the image stacks as described in Heydorn et al. (Heydorn et al., 2000b). Grey scale images were converted to black/white and compared with the original image to determine a threshold for the images. Each stack of an experiment was examined and the threshold value that best fit all image stacks of a trial was chosen and kept consistent for all stacks within the trial. The image stacks of the WT and each mutant were averaged and compared.
Statistical Analysis
Between 5 and 10 confocal image stacks were collected from each strain per trial. After conversion to Tiff files and thresholding, the COMSTAT measurements for each image stack were compared. The values for each measurement were averaged within a strain for each trial. A one way analysis of variance was performed to determine statistically significant differences between strains within a trial. The parameter averages of each trial were then compared among the WT and mutant panel via repeated measures ANOVA (InStat) (P. Feustel, personal communication). For growth curves, the S value of each curve was compared by one way ANOVA to determine statistical significance.
Results
Southern hybridization was used to verify the genetic constructs for the mutant panel (Figure 1). PCR fragments of WT and mutant gbpC and gbpD genes also showed size differences that corresponded to the base pair differences of the respective inserts relative to the excised fragments (data not shown). Importantly, because the strategy for engineering the mutant panel included deletion of a portion of the gene as well as the insertion of a selectable marker, the strains could be grown in the absence of selection without concern for regenerating the WT genotype. Though, it is possible for truncated proteins to still retain glucan binding properties, the entire glucan binding domain of GbpA was deleted and the 5′ two-thirds of the gbpD gene were excised in those particular mutations. Mutants for gbpA and gbpD showed an absence of the respective proteins according to western immunoblot analysis (Figure S1). Though GbpC does not have the glucan binding domain that GbpA and GbpD contain, gbpC mutant strains were deficient in dextran-dependent aggregation (Figure S2).
In order to investigate whether the deletion of one or more Gbps from S. mutans had an effect on the growth of the bacteria, we measured the growth rates of planktonic cultures of all mutants and compared the rates to the WT strain (Figure 2). There were no statistically significant differences in the maximum growth rates among the mutants, even though some of the mutants appeared to grow a little more slowly than the WT. Therefore we cannot completely rule out the possibility that subtle differences in growth affected the accumulation of biomass within biofilms produced by the mutant strains. However, if mutant biofilms were allowed to form over longer periods of time they did not take on the characteristics of the WT biofilm at earlier time points (data not shown), indicating that growth rate is unlikely to account for the differences in biofilm architecture that will be discussed below.
Figure 2. Growth rates of mutant panel.
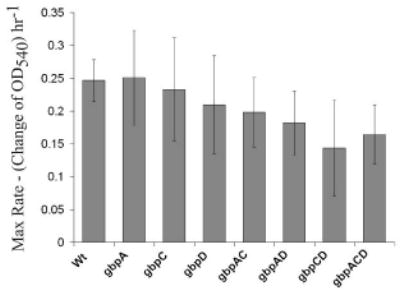
Values represent the slope of a curve fit to graphs of 3 independent growth trials at the time when the OD540 is at ½ max OD (S value of plot equation). This represents the maximum change in OD for each strain which is assumed to be the maximal growth rate. Error bars are 1 standard deviation of the S value.
Confocal analysis of WT and mutant biofilms was performed to investigate structural differences in biofilm architecture among the strains. It has been noted that analysis of biofilms is complicated by a high degree of variability from trial to trial (Heydorn et al., 2000a). Our experience was similar. For example, the biomass of the biofilm formed by the gbpAC mutant was significantly less than the wild-type in four out four trials. However, if the data from the four trials were pooled then the difference between the gbpAC mutant and wild-type was no longer statistically significant. In order to overcome this variability, yet also demonstrate reproducibility, we have defined significant differences in our combined data as representing two or more individual trials (out of four) with statistical significance, and without any trials showing statistical significance in the opposite direction. Additionally, we define a ‘strong trend’ as representing a single trial with a statistically significant difference, at least two of the other trials showing a substantial difference in the same direction, and none of the trials showing statistical significance in the opposite direction.
Quantification of biofilm properties are presented in Table 2. All the mutants showed a significant decrease in biomass with the exception of the gbpA and gbpAD strains. The biggest reductions were associated with the loss of GbpC and were accompanied by a large population of individual bacteria across the substratum (Figure 3). The gbpA mutant showed a strong trend toward covering more of the substratum consistent with earlier reports regarding this mutant (Hazlett et al., 1999). Colonies used in O/N cultures were monitored on sucrose containing agar plates to ensure that they displayed a rough colony phenotype that is consistent with non-recombinant gtf genes. Also, biofilm cultures were plated and examined for colony roughness. There were no detectable smooth colonies detected from any mutant strain (data not shown).
Table 2.
COMSTAT Analyses of Wild-Type and Mutant Biofilms*
| Wild-type | gbpA | gbpC | gbpD | gbpAC | gbpAD | gbpCD | gbpACD | |
|---|---|---|---|---|---|---|---|---|
| Biomass (μm3 (μm2)−1) | 7.55 ± 3.10 | 6.86 ± 4.01 | 4.64 ± 3.59 | 5.15 ± 2.56 | 3.13 ± 1.78 | 5.31 ± 2.29 | 4.90 ± 1.99 | 4.12 ± 2.05 |
| Substratum Coverage (%) | 30.91 ± 3.77 | 43.23T ± 21.85 | 33.09 ± 21.30 | 30.89 ± 13.50 | 22.73 ± 10.80 | 31.63 ± 11.97 | 36.55 ± 17.55 | 29.34 ± 18.47 |
| Average Biofilm Thickness (μm) | 32.48 ± 13.68 | 10.34 ± 4.58 | 12.85 ± 10.68 | 10.90 ± 6.95 | 7.54 ± 3.55 | 11.63 ± 8.84 | 10.34 ± 4.94 | 10.28 ± 2.05 |
| Surface Area (μm2) (x 105) | 10.80 ± 3.71 | 5.45 ± 1.54 | 8.73 ± 5.31 | 5.30 ± 2.42 | 6.88 ± 2.60 | 7.20T ± 4.38 | 11.40 ± 5.22 | 9.07 ± 4.75 |
| Ratio of Surface Area to Biovolume (μm2/μm3) | 1.36 ± 0.44 | 0.87 ± 0.30 | 1.96 ± 0.54 | 1.03 ± 0.27 | 2.29 ± 0.76 | 1.31 ± 0.61 | 2.11 ± 0.30 | 2.12 ± 0.41 |
Values are ± standard deviation; those in bold are significantly different from the wild-type.
Values show a strong trend away from the wild-type.
Figure 3. Confocal images of mutant panel substratum layer.
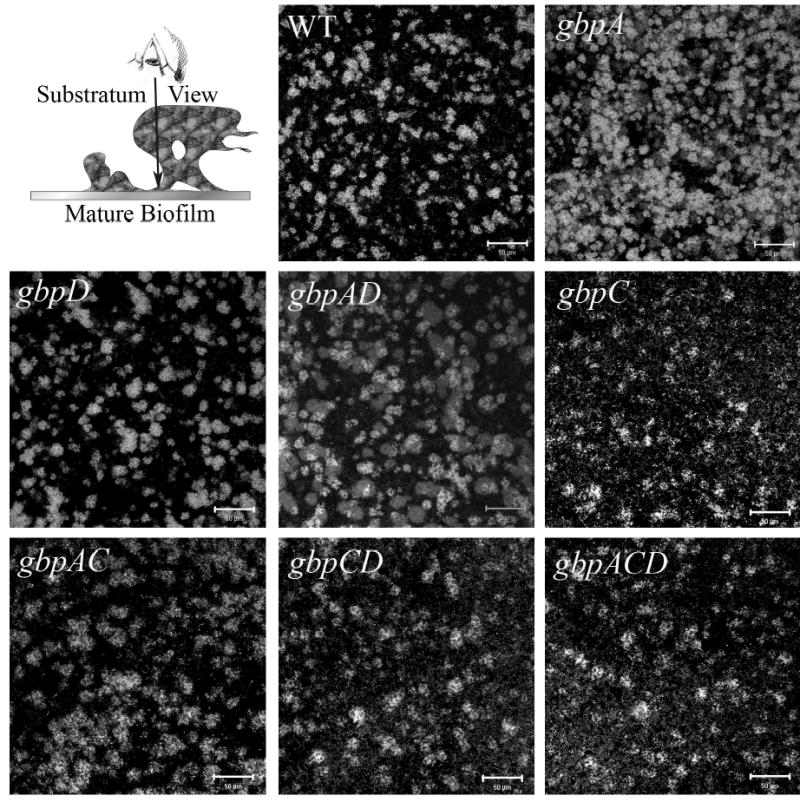
The first panel is a schematic diagram of the view. Subsequent panels are images of the first slice of a representative image stack for each strain, or the portion of the biofilm adherent to the substratum. The bacteria appear light (fluorescent) against the black background. The white bars are 50μm.
WT biofilms showed a classic biofilm architecture consisting of microcolony aggregates dispersed across the substratum that grew into tall 3-dimensional structures that often spread out as the microcolonies grew away from the substratum to resemble mushroom stalk and cap like structures (Wimpenny et al., 2000). First impressions of the mutant biofilms indicated that the loss of any Gbp resulted in an absence, or severe reduction, of tall cap and stalk like structures (Figure 4 and lab observations).
Figure 4. Side view of mutant panel.
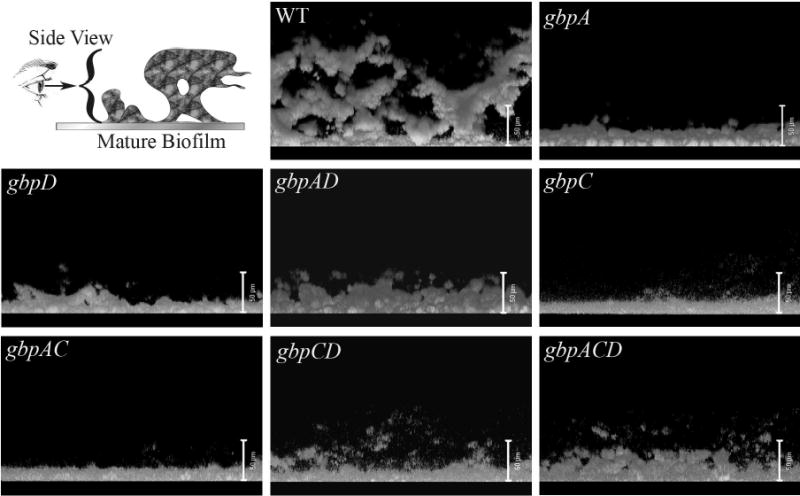
The first panel shows a schematic diagram of the view. Subsequent panels are images of the side view of the maximum density projection from a representative image stack for each mutant. The bacterial aggregates appear light (fluorescent) against the black background. White bars are 50μm.
The average thickness measurements of all of the mutant strains were significantly lower than the wild type. Side view images dramatically show these differences (Figure 4). The reason for the decrease in biofilm thickness varied based on the particular Gbp lost. Mutants that lost one of the extracellular Gbps, GbpA or GbpD, showed a significant reduction in surface area. The gbpAD double knockout showed a strong trend toward the same phenotype. All of the mutants that no longer expressed GbpC formed biofilms with significantly greater surface area to biovolume ratios. The gbpA mutant was the only mutant to show a significant decrease in the ratio of surface area to biovolume.
Since the Gbps are thought to provide structural support by binding glucan, we observed the mutants and WT strains grown in biofilms without sucrose. As expected, the wild-type and all mutant strains formed a much less prolific biofilms in which cells were scattered about the substratum as chains or individually (Figure S3). There were few aggregates that were generally very small and did not grow above 7 to 10 om. COMSTAT analyses of sucrose-independent biofilms showed no differences in biomass, substratum coverage, average biofilm thickness, or total surface area between the wild-type and mutant strains (Table S1). The values of each mutant in Table 2 were compared to the values of the same mutant grown without sucrose in Table S1 and were significantly different. This confirms that the architectural differences in biofilms formed by gbp mutant strains were sucrose-dependent.
Discussion
Bacterial biofilms are a highly dynamic and heterogeneous community of cells and many factors, such as substrate concentration and flow, contribute to the architecture of a biofilm (Szewzyk & Schink, 1987;van Loosdrecht et al., 1995). Bacterial aggregates in a biofilm are generally enveloped in large amounts of exopolymeric matrix and are interspersed by less cell dense regions of the matrix (Nivens et al., 1995). Here, we suggest that proteins that interact with the matrix should have a profound effect on the structure of a biofilm. Each cell in a biofilm has its own niche and specific relation to other bacteria within the biofilm (Costerton et al., 1994). Any alteration in biofilm structure would disrupt this environment.
We created a panel of Gbp mutants and examined the biofilm architecture to understand the roles these proteins play in biofilm architecture. The loss of Gbp proteins did not significantly affect S. mutans growth or metabolism. Therefore, growth differences could not account for the differences in biofilm development and architecture that were observed.
The most dramatic effect associated with the loss of any Gbp was a significant reduction in biofilm depth. For mutants that no longer expressed GbpC the reduction in biofilm depth was likely due to a significant loss of biomass attributable to the role of GbpC as a cell-surface glucan receptor. The loss of GbpC also reduced the ability of the bacteria to aggregate resulting in more individual bacteria scattered through the substratum view of the biofilms. The loss of GbpC also resulted in significant increases in the surface area to biovolume ratios, where biovolume represents the total amount of positive pixels throughout the image stack. Therefore, these mutants retained facets of biofilm architecture that affected surface area, but lost significant biovolume as a consequence of losing biomass. The additional loss of GbpA or GbpD did not diminish the surface area or appreciably change the biofilm phenotype indicating that GbpC contributes the dominant phenotype relative to Gbps A and D.
The loss of GbpA led to a flattening of the biofilm and a strong trend towards increased substratum coverage as expected from earlier reports (Hazlett et al., 1999). The loss of GbpD, the other secreted Gbp, resulted in a significant loss of biomass. Both extracellular Gbps likely add structural rigidity to the biofilm that allows the elevation of microcolonies. However, the loss of GbpA can be likened to the biofilm ‘falling down’ and spreading out over the substratum, whereas the loss of GbpD appears to weaken the cohesiveness of the biofilm leading to both a decrease in elevation and a loss of biomass. The loss of either extracellular Gbp led to a significant reduction in surface area consistent with these Gbps making an essential contribution to the architecture of the biofilm. For the gbpA mutant this change was also reflected in a significant decrease in the surface area to biovolume ratio. This was not true for the gbpD mutant most likely because of a concomitant loss of biovolume due to the reduction in biomass.
It can be concluded that each Gbp makes a unique contribution to the development of a mature biofilm. The extracellular Gbps A and D contribute to the scaffolding that allows S. mutans to build a biofilm outward from the substratum. The role of GbpA may be to link glucan molecules, more or less independent of individual bacteria, as its loss does not adversely affect biomass. GbpD may provide elements of both scaffolding and cohesiveness between bacteria and exopolysaccharide. However, the role of GbpC as a bond between bacteria and glucan is dominant. The loss of GbpC reduces biomass and bacterial aggregates, and overshadows any effect that further loss of Gbps might contribute.
Supplementary Material
Acknowledgments
We thank Dr. Arne Heydorn for providing us with the COMSTAT toolbox, and Dr. Paul Feustel for assistance with statistical analyses.
This research was supported by grant DE10058 from the NIDCR.
Footnotes
Current address: University of Iowa College of Dentistry, Dows Institute for Research, Dental Science N 436, Iowa City, IA 52242-1010, Tel.: 319-335-9911, Fax: 319-335-8895, E-mail: Jeffrey-Banas@uiowa.edu
References
- Ajdic D, McShan WM, McLaughlin RE, Savic G, Chang J, Carson MB, Primeaux C, Tian R, Kenton S, Jia H, Lin S, Qian Y, Li S, Zhu H, Najar F, Lai H, White J, Roe BA, Ferretti JJ. Genome sequence of Streptococcus mutans UA159, a cariogenic dental pathogen. Proc Natl Acad Sci U S A. 2002;99:14434–14439. doi: 10.1073/pnas.172501299. [DOI] [PMC free article] [PubMed] [Google Scholar]
- Banas JA. Virulence properties of Streptococcus mutans. Frontiers in Bioscience. 2004;9:1267–1277. doi: 10.2741/1305. [DOI] [PubMed] [Google Scholar]
- Banas JA, Gilmore KS. Analysis of Streptococcus mutans and Streptococcus downei mutants insertionally inactivated in the gbp and gtfS genes. In: Dunny GM, Cleary PP, McKay LL, editors. Genetics and molecular biology of streptococci, lactococci, and enterococci. Washington, D.C: American Society for Microbiology; 1991. pp. 281–283. [Google Scholar]
- Banas JA, Hazlett KRO, Mazurkiewicz JE. An in vitro model for studying the contributions of the Streptococcus mutans glucan-binding protein-A to biofilm structure. Meth Enzymol. 2001;337:425–433. doi: 10.1016/s0076-6879(01)37031-3. [DOI] [PubMed] [Google Scholar]
- Banas JA, Russell RRB, Ferretti JJ. Sequence analysis of the gene for the glucan-binding protein of Streptococcus mutans Ingbritt. Infect Immun. 1990;58:667–673. doi: 10.1128/iai.58.3.667-673.1990. [DOI] [PMC free article] [PubMed] [Google Scholar]
- Beyenal H, Lewandowski Z, Harkin G. Quantifying biofilm structure: facts and fiction. Biofouling. 2004;20:1–23. doi: 10.1080/0892701042000191628. [DOI] [PubMed] [Google Scholar]
- Chia J-S. Genetic and functional characterization of a general stress protein from Streptococcus mutans. Asheville, NC: American Society for Microbiology; 2002. pp. 45–46. [Google Scholar]
- Chia JS, Chang LY, Shun CT, Chang YY, Chen JY. A 60-kilodalton immunodominant glycoprotein is essential for cell wall integrity and the maintenance of cell shape in Streptococcus mutans. Infect Immun. 2001;69:6987–6998. doi: 10.1128/IAI.69.11.6987-6998.2001. [DOI] [PMC free article] [PubMed] [Google Scholar]
- Costerton JW, Lewandowski Z, DeBeer D, Caldwell D, Korber D, James G. Biofilms, the customized microniche. Journal of Bacteriology. 1994;176:2137–2142. doi: 10.1128/jb.176.8.2137-2142.1994. [DOI] [PMC free article] [PubMed] [Google Scholar]
- Dunny GM, Lee LN, LeBlanc DJ. Improved electroporation and cloning vector system for gram-positive bacteria. Appl Environ Microbiol. 1991;57:1194–1201. doi: 10.1128/aem.57.4.1194-1201.1991. [DOI] [PMC free article] [PubMed] [Google Scholar]
- Hamada S, Slade HD. Biology, Immunology, and Cariogenicity of Streptococcus mutans. Microbiol Rev. 1980;44:331–384. doi: 10.1128/mr.44.2.331-384.1980. [DOI] [PMC free article] [PubMed] [Google Scholar]
- Hazlett KRO, Mazurkiewicz JE, Banas JA. Inactivation of the gbpA gene of Streptococcus mutans alters structural and functional aspects of plaque biofilm which are compensated by recombination of the gtfB and gtfC genes. Infect Immun. 1999;67:3909–3914. doi: 10.1128/iai.67.8.3909-3914.1999. [DOI] [PMC free article] [PubMed] [Google Scholar]
- Hazlett KRO, Michalek SM, Banas JA. Inactivation of the gbpA gene of Streptococcus mutans increases virulence and promotes in vivo accumulation of recombinations between the glucosyltransferase B and C genes. Infect Immun. 1998;66:2180–2185. doi: 10.1128/iai.66.5.2180-2185.1998. [DOI] [PMC free article] [PubMed] [Google Scholar]
- Heydorn A, Ersboll BK, Hentzer M, Parsek MR, Givskov M, Molin S. Experimental reproducibility in flow-chamber biofilms. Microbiology. 2000a;146 ( Pt 10):2409–2415. doi: 10.1099/00221287-146-10-2409. [DOI] [PubMed] [Google Scholar]
- Heydorn A, Nielsen AT, Hentzer M, Sternberg C, Givskov M, Ersboll BK, Molin S. Quantification of biofilm structures by the novel computer program COMSTAT. Microbiology. 2000b;146 ( Pt 10):2395–2407. doi: 10.1099/00221287-146-10-2395. [DOI] [PubMed] [Google Scholar]
- LeBlanc DJ, Lee LN, bu-Al-Jaibat A. Molecular, genetic, and functional analysis of the basic replicon of pVA380-1, a plasmid of oral streptococcal origin. Plasmid. 1992;28:130–145. doi: 10.1016/0147-619x(92)90044-b. [DOI] [PubMed] [Google Scholar]
- Li YH, Lau PC, Lee JH, Ellen RP, Cvitkovitch DG. Natural genetic transformation of Streptococcus mutans growing in biofilms. J Bacteriol. 2001;183:897–908. doi: 10.1128/JB.183.3.897-908.2001. [DOI] [PMC free article] [PubMed] [Google Scholar]
- Loesche WJ. Role of Streptococcus mutans in Human Dental Decay. Microbiol Rev. 1986;50:353–380. doi: 10.1128/mr.50.4.353-380.1986. [DOI] [PMC free article] [PubMed] [Google Scholar]
- Matsumura M, Izumi T, Matsumoto M, Tsuji M, Fujiwara T, Ooshima T. The role of glucan-binding proteins in the cariogenicity of Streptococcus mutans. Microbiol Immunol. 2003;47:213–215. doi: 10.1111/j.1348-0421.2003.tb03389.x. [DOI] [PubMed] [Google Scholar]
- Mattos-Graner RO, Jin S, King WF, Chen T, Smith DJ, Duncan MJ. Cloning of the Streptococcus mutans gene encoding glucan binding protein B and analysis of genetic diversity and protein production in clinical isolates. Infect Immun. 2001;69:6931–6941. doi: 10.1128/IAI.69.11.6931-6941.2001. [DOI] [PMC free article] [PubMed] [Google Scholar]
- Munro CL, Michalek SM, Macrina FL. Sucrose-derived exopolymers have site-dependent roles in Streptococcus mutans-promoted dental decay. FEMS Microbiol Lett. 1995;128:327–332. doi: 10.1111/j.1574-6968.1995.tb07544.x. [DOI] [PubMed] [Google Scholar]
- Nakano K, Matsumura M, Kawaguchi M, Fujiwara T, Sobue S, Nakagawa I, Hamada S, Ooshima T. Attenuation of glucan-binding protein C reduces the cariogenicity of Streptococcus mutans: analysis of strains isolated from human blood. J Dent Res. 2002;81:376–379. doi: 10.1177/0810376. [DOI] [PubMed] [Google Scholar]
- Nivens DE, Palmer RJ, Jr, White DC. Continuous nondestructive monitoring of microbial biofilms: a review of analytical techniques. Journal of Industrial Microbiology. 1995;15:263–276. [Google Scholar]
- Sato Y, Okamoto K, Kizaki H. gbpC and pac gene mutations detected in Streptococcus mutans strain GS-5. Oral Microbiol Immunol. 2002a;17:263–266. doi: 10.1034/j.1399-302x.2002.170410.x. [DOI] [PubMed] [Google Scholar]
- Sato Y, Senpuku H, Okamoto K, Hanada N, Kizaki H. Streptococcus mutans binding to solid phase dextran mediated by the glucan-binding protein C. Oral Microbiol Immunol. 2002b;17:252–256. doi: 10.1034/j.1399-302x.2002.170408.x. [DOI] [PubMed] [Google Scholar]
- Sato Y, Yamamoto Y, Kizaki H. Cloning and sequence analysis of the gbpC gene encoding a novel glucan-binding protein of Streptococcus mutans. Infect Immun. 1997;65:668–675. doi: 10.1128/iai.65.2.668-675.1997. [DOI] [PMC free article] [PubMed] [Google Scholar]
- Shah DS, Russell RR. A novel glucan-binding protein with lipase activity from the oral pathogen Streptococcus mutans. Microbiology. 2004;150:1947–1956. doi: 10.1099/mic.0.26955-0. [DOI] [PubMed] [Google Scholar]
- Smith DJ, Akita H, King WF, Taubman MA. Purification and antigenicity of a novel glucan-binding protein of Streptococcus mutans. Infect Immun. 1994;62:2545–2252. doi: 10.1128/iai.62.6.2545-2552.1994. [DOI] [PMC free article] [PubMed] [Google Scholar]
- Szewzyk U, Schink B. Surface colonization by and life cycle of Pelobacter acidigallicci studied in a continuous-flow micro-chamber. J Gen Microbiol. 1987;134:183–190. [Google Scholar]
- Tamesada M, Kawabata S, Bian Z, Fujiwara T, Kimura S, Hamada S. Modification of Sucrose Dependent Cell Adherence by Deletion and Reintroduction of the gtf Genes in Streptococcus mutans. In: H, et al., editors. Streptococci and the Host. New York: Plenum Press; 1997. [DOI] [PubMed] [Google Scholar]
- van Loosdrecht MCM, Eikelboom D, Gjaltema A, Mulder A, Tijhuis L, Heijnen JJ. Biofilm structures. Water Science Technology. 1995;32:35–43. [Google Scholar]
- Wimpenny J, Manz W, Szewzyk U. Heterogeneity in biofilms. FEMS Microbiol Rev. 2000;24:661–667. doi: 10.1111/j.1574-6976.2000.tb00565.x. [DOI] [PubMed] [Google Scholar]
- Wu-Yuan CD, Tai S, Slade HD. Dextran/glucan binding by Streptococcus mutans: the role of molecular size and binding site in agglutination. Adv Exp Med Biol. 1978;107:737–748. doi: 10.1007/978-1-4684-3369-2_83. [DOI] [PubMed] [Google Scholar]
- Yu H, Nakano Y, Yamashita Y, Oho T, Koga T. Effects of antibodies against cell surface protein antigen PAc-glucosyltransferase fusion proteins on glucan synthesis and cell adhesion of Streptcoccus mutans. Infect Immun. 1997;65:2292–2298. doi: 10.1128/iai.65.6.2292-2298.1997. [DOI] [PMC free article] [PubMed] [Google Scholar]
Associated Data
This section collects any data citations, data availability statements, or supplementary materials included in this article.