

Abstract
Objective. We examined the feasibility and value of network analysis to complement routine tuberculosis (TB) contact investigation procedures during an outbreak.
Methods. We reviewed hospital, health department, and jail records and interviewed TB patients. Mycobacterium tuberculosis isolates were genotyped. We evaluated contacts of TB patients for latent TB infection (LTBI) and TB, and analyzed routine contact investigation data, including tuberculin skin test (TST) results. Outcomes included number of contacts identified, number of contacts evaluated, and their TST status. We used network analysis visualizations and metrics (reach, degree, betweenness) to characterize the outbreak.
Results.secondary TB patients and more than 1200 contacts. Genotyping detected a 21-band pattern of a strain W variant. No HIV-infected patients were diagnosed. Contacts prioritized by network analysis were more likely to have LTBI than nonprioritized contacts (odds ratio=7.8; 95% confidence interval=1.6, 36.6). Network visualizations and metrics highlighted patients central to sustaining the outbreak and helped prioritize contacts for evaluation.
Conclusions. A network-informed approach to TB contact investigations provided a novel means to examine large quantities of data and helped focus TB control.
The incidence of tuberculosis (TB) in the United States has declined annually since 1992, but the rate of decline is diminishing.1 The national goal of TB elimination requires state and local TB control programs to increase efficiency with limited resources.2 TB control in the United States relies on a costly, complex process known as contact investigation to record, locate, and medically evaluate persons recently exposed to contagious pulmonary TB patients. Such contacts are at risk of infection with Mycobacterium tuberculosis and are also more likely to progress to TB disease and continue transmission.3,4 Thus, health department staff must meticulously elicit and locate contacts, screen them for TB symptoms, and administer a tuberculin skin test (TST), which requires a second encounter 48 to 72 hours later to interpret the test result.5 If the TST results suggest M tuberculosis infection, a chest radiograph and additional clinical evaluation are necessary.
Frequently, contacts of patients unlikely to be contagious are sought unnecessarily.5 Methods to help prioritize TB contacts are needed to avoid fruitless expenditure of resources. A strategy that could also detect early evidence of ongoing M tuberculosis transmission would be especially useful.6–8
TB controllers currently follow a paradigm known as the concentric circle approach to guide their contact investigations.9,10 The duration of exposure to a contagious TB patient, type of relationship (close vs casual), and location of exposure (household, work and school, leisure) are considered when prioritizing contacts. Unfortunately, the current paradigm yields a collection of data from many separate contact investigations without placing the combined results into a broader context of community TB transmission. The outcomes of each contact investigation are often stored (usually on paper) with the TB patient’s records, with no systematic strategy to construct and examine linkages among TB patients, their contacts, and the places where these persons regularly aggregate.
The science of network analysis is a mathematical strategy that includes visualization of nodes (people and places) and the connections among them.11,12 For a respiratory infection spread via droplet nuclei, network analysis aims to identify the most critical nodes responsible for transmission and, based upon their location in the network, to predict which nodes are likely to be infected. As subgroups of TB patients and contacts converge, specific collections of nodes can be selected for screening prioritization. Network analysis can add to our understanding of individual-level variables, commonly explored through conventional biostatistical methods that assume independence and often fail to reflect complex links among cases, contacts, and the places they interact.
Recent outbreak investigations have provided opportunities to explore various applications of this tool to TB control.7,13,14 Our interest in network analysis is in understanding how it may complement, not supplant, health departments’ TB contact investigation practices. We sought to determine whether routine contact investigation data could be extracted from health department records and analyzed by commercially available network analysis software and to test the hypothesis that contacts prioritized with network analysis were more likely to be diagnosed with latent TB infection (LTBI) than nonprioritized contacts.
METHODS
Initial Investigation
On March 18, 2002, the Centers for Disease Control and Prevention (CDC) were invited by the Oklahoma State Department of Health to investigate a cluster of TB patients in 4 locales in 3 contiguous counties in southwestern Oklahoma. Together, these counties averaged fewer than 5 TB cases per year between 1996 and 2000, an average rate not exceeding 3 per 100 000 (CDC, unpublished data, 2004). By the time the CDC staff arrived, the state TB control program had identified 18 outbreak-associated patients and 17 suspected TB patients over 9 months. It was uncertain at the time whether all the patients were epidemiologically related.
The index patient—the first outbreak-related patient that triggered the investigation—was an HIV-seronegative male, aged 23 years old, who had been incarcerated 5 times between 1996 and 2001. His symptoms of cough and fever started in November 2000. Over the next 9 months, he shared housing with family and friends in 3 contiguous Oklahoma counties. During that period, he was treated with antibiotics for pneumonia and bronchitis after 4 emergency department visits at 2 local hospitals. He also had worked for 3 weeks as a dishwasher in a local restaurant, and had spent 22 days in a city jail. On July 30, 2001, he was diagnosed with pulmonary TB on the basis of a sputum smear that tested positive for acid-fast bacilli (AFB). He was placed in respiratory isolation and began directly observed TB therapy. His chest radiograph showed a large cavity in the right upper lobe with evidence of right upper lobe collapse. He completed therapy on May 24, 2002.
Of the known TB patients identified by the state TB control program, culture-confirmed patients were those who had signs or symptoms of TB plus a microbiological isolate identified as M tuberculosis. Clinical TB patients had signs and symptoms of TB, a positive TST (determined by a Mantoux reaction of at least 5 mm induration15), treatment with 2 or more antituberculosis drugs, and a completed diagnostic evaluation consistent with TB.1
Contacts were those persons named by a TB patient during contact investigations conducted by the local health departments. Contacts were diagnosed with LTBI if they had a positive TST and no signs or symptoms of TB disease (including a normal chest radiograph) upon medical evaluation. TST converters were those contacts with a current TST of at least 5 mm induration and a documented TST of 0 mm induration within the previous 2 years, and no signs or symptoms of TB upon medical evaluation.16 The strength of each patient–contact relationship was defined by the local TB control staff as close (>4-hour exposure indoors or in a confined space), casual (exposure other than close), or undetermined (relationship strength not able to be characterized).
Contact Investigation Data
We reviewed available hospital admission charts, health department records, chest radiographs, and city jail records of all TB patients. Patients were interviewed with an emphasis on the date of onset of TB symptoms. The infectious period for each patient was the calendar time between the date of symptom onset and the date of the third consecutive AFB-negative sputum smear.
Routine contact investigation data collected by county TB control staff were abstracted from paper records and entered into a Microsoft Access (Microsoft Corp, Redmond, Wash) database. Data included each contact’s name, age, gender, race, address, HIV status, relationship to the patient, strength of relationship, TST results, symptom review, and chest radiograph results. The index patient’s contacts were further categorized. Household contacts included persons he lived with at the time of his diagnosis. Friends included acquaintances and relatives he spent time with during his infectious period. Work and school contacts included coworkers from the local restaurant where he had worked and classmates from a 1-week-long class. Hospital contacts were identified by the hospital infection control staff around his many emergency department visits. Jail contacts were inmates or employees whose presence overlapped his by at least 1 day. A contact was considered to have been evaluated if 2 TSTs were performed (i.e., a first TST immediately after TB exposure followed, if negative, by a second TST performed at least 12 weeks after the last TB exposure) or if at least 1 TST was performed at least 12 weeks after the last exposure to a TB patient, along with a symptom assessment and a chest radiograph if the TST was positive.
Available M tuberculosis isolates were genotyped at the CDC’s Mycobacteriology Laboratory Branch using spoligotyping17 and IS6110-based restriction fragment length polymorphism analysis.18 All isolates underwent drug susceptibility testing.
Data Management and Analysis
Each TB patient and contact was assigned a unique identification number. A second Microsoft Access table included a listing of each patient–contact pair (dyad; a linked pair of nodes in the network that is the fundamental unit for deriving network metrics). Contacts named by more than 1 TB patient were considered to be the same individual if they matched on first and last name (or alias), age or date of birth, and race/ethnicity. Standard descriptive analysis was performed using Epi Info version 6.04d (CDC, Atlanta, Ga). The data were also imported to InFlow software (Orgnet.com, Cleveland, Ohio) to perform network visualizations and analyses.
The outbreak network visualizations included the TB patients, their contacts, and the links that connected them. In Figures 1 ▶–3 ▶ ▶, a node was used to represent each TB patient (black), contact (gray), and person who was prioritized for evaluation (white). A line, with strength of relationship (close, casual, undetermined) represented by decreasing thickness, linked each pair of nodes. No data were collected from contacts regarding their specific contacts (i.e., no contacts of contacts were recorded, unless the contact developed TB).
FIGURE 1—
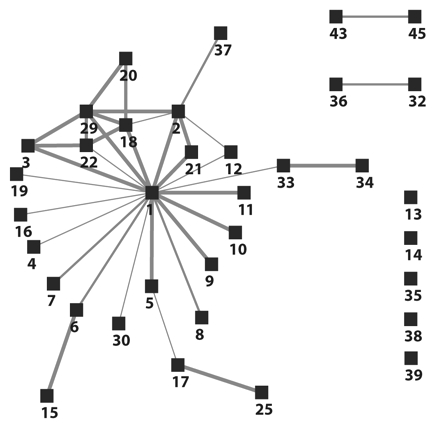
Visualization of the identified links among the first 35 tuberculosis patients during an outbreak investigation in southwest Oklahoma, 2002.
Note. This diagram was compiled using only the existing contact investigation records obtained before or during the Centers for Disease Control and Prevention on-site investigation. Tuberculosis patients are represented by black boxes. Gray lines represent the links between patients. Decreasing thicknesses of gray lines represent the strength of relationship between patients: close, casual, or undetermined, respectively.
FIGURE 2—
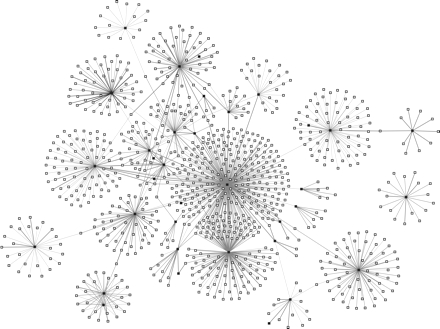
Visualization of the first 35 tuberculosis (TB) patients and their 1039 contacts, southwest Oklahoma, 2002.
Note. TB patients are represented by black boxes. Contacts are represented by white boxes. Gray lines represent the links between TB patients and contacts. Decreasing thicknesses of gray lines represent the strength of the relationship between patients and type of contacts: close, casual, or undetermined, respectively.
FIGURE 3—
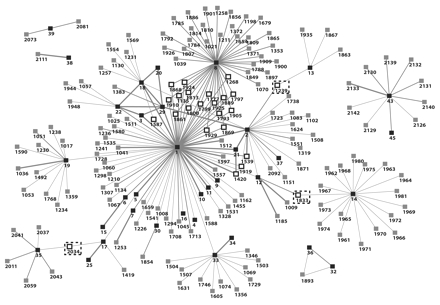
Visualization of the first 35 tuberculosis (TB) patients and all contacts in need of clinical evaluation for TB and latent TB infection in southwest Oklahoma, 2002.
Note. Critical contacts with high betweenness and reach centrality metrics are indicated. TB patients are represented by black boxes with 1- or 2-digit numbers. Gray boxes with 4-digit numbers represent unevaluated contacts at the time of CDC investigation. White boxes with 4-digit numbers represent priority contacts. Contacts surrounded by dashed boxes are those with high betweenness. Gray lines represent the links between contacts and patients. Decreasing thicknesses of gray lines represent the strength of the relationship between patients and type of contacts: close, casual, or undetermined, respectively.
We used 3 social network analysis metrics (standards of measurement) to describe the nodes in the network (see online data supplement). “Reach” calculates the number of nodes that can be encountered from a focal node within 2 steps. This measure incorporates both direct and indirect connections. “Degree” shows the most active nodes in the network and is computed as the number of lines incident with it. Nodes with the highest degree have the most ties to other nodes in the network. “Betweenness” measures how many pairs of nodes an individual connects that would otherwise not be connected.
RESULTS
The index patient’s estimated infectious period spanned 9 months: November 2000 to July 2001. The health departments recorded 294 contacts from this period; 251 (85%) could be located and evaluated (Table 1 ▶). Overall, 106 (42%) contacts had a positive TST, compared with a background positive TST rate of 5% or less (Oklahoma State Department of Health, unpublished data, 2002). With the exception of hospital and work and school contacts, all categories of contacts had positive TST rates exceeding 40%. Among 29 jail staff with a positive TST, 18 (63%) were documented converters, confirming recent exposure and infection with M tuberculosis. Among the index patient’s 251 evaluated contacts, 19 secondary TB cases were detected.
TABLE 1—
Summary of the Contact Investigation Conducted by the Local Health Departments Around the Index TB Patient, by Exposure Category: Southwest Oklahoma, November 2002
| Exposure Category | Identified, No. | Evaluated,a No. | No. With TST ≥ 5 mm (%)b | RR (95% CI) | Secondary Cases, No. |
| Household | 11 | 10 | 10 (100%) | 6.4 (2.9, 14.3) | 5 |
| Friend | 76 | 63 | 33 (52%) | 3.4 (1.5, 7.8) | 8 |
| Jailc | 125 | 108 | 55 (51%) | 3.2 (1.4, 7.3) | 5 |
| Inmates only | 49 | 39 | 26 (67%) | 4.3 (1.9, 9.8) | 4 |
| Staff only | 76 | 69 | 29 (42%) | 2.7 (1.2, 6.3) | 1 |
| Work/school | 40 | 32 | 5 (16%) | Reference | 1 |
| Hospital | 42 | 38 | 4 (11%) | 0.7 (0.2, 2.3) | 0 |
| Total | 294 | 251 | 106 (42%) | 19 |
Note. TB = tuberculosis; TST = tuberculin skin test; RR = relative risk; CI = confidence interval.
a TST was placed and read.
b Percentage of number evaluated based on the number of those with given test result.
cJail category included both staff and inmates.
Between August 2001 and December 2002, TB was diagnosed in 37 secondary cases (Table 2 ▶). One patient was found to have pleural TB at death.
TABLE 2—
Selected Demographics and Clinical Characteristics of 38 Outbreak-Related TB Patients: Southwest Oklahoma, November 2002
| No.a (%) | |
| Demographic Characteristics | |
| Female | 20 (53) |
| Age, y | |
| < 5 | 6 (16) |
| 5–14 | 4 (11) |
| 15–24 | 12 (32) |
| > 25 | 16 (42) |
| Black | 32 (84) |
| US-born | 37 (97) |
| Clinical Characteristics | |
| Pulmonary disease only | 19 (50) |
| Extrapulmonary disease only | 13 (34) |
| Hilar adenopathy only | 8 (21) |
| Pleural effusion only | 2 (5) |
| Pleural and disseminated TB | 1 (3) |
| Pleural and hilar adenopathy | 1 (3) |
| Lymphatic, hilar, and mediastinal | 1 (3) |
| Pulmonary and extrapulmonary | 6 (16) |
| Cavitary disease | 5 (13) |
| AFB sputum smear positive | 5 (13) |
| HIV status | 38 (100) |
| HIV-infected | 0 (0) |
| HIV-uninfected | 23 (61) |
| Unknownb | 15 (39) |
Note. TB = tuberculosis; AFB = acid-fast bacilli.
aIndex patient plus 37 secondary cases.
bOf the 15 unknowns, 11 (73%) were pediatric patients.
The contact investigations performed for the first 34 secondary cases diagnosed before or during the CDC investigation recorded 1019 contacts representing 745 unique individuals. Of these contacts, 609 (82%) were screened and 73 (12%) had a positive TST. No additional TB cases associated with this outbreak have been diagnosed in southwest Oklahoma since January 2003.
Network Visualizations
The network diagram in Figure 1 ▶ shows that the index patient (1) was directly linked to 19 (56%) and indirectly linked to 6 (18%) of the first 34 secondary cases in the community, respectively. Half of the direct links between the index and secondary cases were characterized as close.
The largest component in Figure 1 ▶ is a wheel-and-spoke configuration, with the index patient in the center. The multiple close links for patients in the upper left corner represent a household comprising the index patient’s sister, her boyfriend, and cousins with whom the index patient lived briefly during his infectious period. On the right side of Figure 1 ▶ are 9 secondary cases that neither named nor were named by the index patient. These 9 outliers with no links to the larger network suggested the possibility of separate, un-characterized clusters of M tuberculosis transmission (genotyping results were not concurrently available). We hypothesized that inclusion of the contacts in the diagram would help link the 9 “independent” patients to the larger transmission network.
Thus, Figure 2 ▶ includes the index TB patient and first 34 secondary cases, plus all contacts (n = 1039) identified during each separate contact investigation. With the exception of 1 TB patient and his 17 contacts (right side of figure), all nodes were now linked, directly or indirectly, to the index patient. The majority of contacts (gray nodes) were connected to the index patient. However, nearly 200 contacts remained unevaluated. To help prioritize the pursuit of these unevaluated contacts, we visualized all 35 TB patients plus only those contacts that remained unevaluated (gray nodes) at the time of the CDC investigation (Figure 3 ▶). This revealed several contacts located near the center of the diagram (white nodes) linked to more than 1 TB patient. Given their position within the network, we suspected these contacts included persons with undiagnosed TB or LTBI who would more immediately benefit from prompt evaluation and treatment and help prevent the outbreak from expanding.
Network Analysis
Measures of network centrality were calculated for the Figure 3 ▶ diagram and are presented in Table 3 ▶ (highest 20 scores and lowest 5 scores for each metric). Patient 1 (index) had the highest reach, degree, and betweenness scores, which provided a quantitative measure of his importance or “favored position” in the overall transmission network. The 17 contacts with reach scores of 0.538 all link the same number of nodes within 2 steps. Patients 1, 8, and 14 had the 3 highest degree scores (0.385, 0.253, 0.110, respectively) indicating their high number of connected contacts worthy of prioritization. Further down the same list are 6 contacts (1135, 1268, 1777, 1793, 1797, 1799) who also ranked among the top 20 degree scores. These contacts were connected to sputum smear–positive pulmonary TB patients 1 and 8, and consequently required prioritization by the health department over the hundreds of other unevaluated contacts. Finally, the betweenness score indicates the top 5 nodes (patients 1, 8, 12, 2, 14) that lie in the pathway of the greatest number of other nodes (mostly contacts) and thus act as critical junctures for determining the shape of the transmission network. Three high-ranking betweenness scores (represented within dashed boxes) were also calculated for contacts 1239, 1833, 2034. These 3 contacts served as the sole link to the overall network for TB patients 13, 14, and 35 (and their contacts), respectively.
TABLE 3—
Network Metrics (Reach, Degree, Betweenness) for TB Patients and Their Unevaluated Contacts: Southwest Oklahoma, July 2001 to November 2002
| Reach | Degree | Betweenness | ||||
| Score Rank | Nodea | Score | Nodea | Score | Nodea | Score |
| Highest 20 Scores | ||||||
| 1 | 1 | 0.830 | 1 | 0.385 | 1 | 0.849 |
| 2 | 1135 | 0.538 | 8 | 0.253 | 8 | 0.289 |
| 3 | 1268 | 0.538 | 14 | 0.110 | 12 | 0.208 |
| 4 | 1777 | 0.538 | 33 | 0.099 | 2 | 0.187 |
| 5 | 1793 | 0.538 | 19 | 0.071 | 14 | 0.179 |
| 6 | 1797 | 0.538 | 18 | 0.066 | 1833 | 0.179 |
| 7 | 1799 | 0.538 | 22 | 0.060 | 33 | 0.128 |
| 8 | 1800 | 0.538 | 29 | 0.038 | 19 | 0.118 |
| 9 | 1813 | 0.538 | 35 | 0.038 | 5 | 0.104 |
| 10 | 1861 | 0.538 | 12 | 0.033 | 17 | 0.095 |
| 11 | 1868 | 0.538 | 13 | 0.027 | 2034 | 0.064 |
| 12 | 1869 | 0.538 | 17 | 0.022 | 18 | 0.062 |
| 13 | 1889 | 0.538 | 21 | 0.022 | 35 | 0.054 |
| 14 | 1905 | 0.538 | 3 | 0.016 | 1239 | 0.043 |
| 15 | 1910 | 0.538 | 1135 | 0.016 | 13 | 0.033 |
| 16 | 1924 | 0.538 | 1268 | 0.011 | 22 | 0.033 |
| 17 | 1925 | 0.538 | 1777 | 0.011 | 29 | 0.018 |
| 18 | 1929 | 0.538 | 1793 | 0.011 | 30 | 0.011 |
| 19 | 8 | 0.538 | 1797 | 0.011 | 6 | 0.011 |
| 20 | 2 | 0.516 | 1799 | 0.011 | 7 | 0.011 |
| Lowest 5 Scores | ||||||
| 5 | 1935 | 0.022 | 25 | 0.005 | 3 | 0.000 |
| 4 | 25 | 0.022 | 34 | 0.005 | 34 | 0.000 |
| 3 | 1253 | 0.011 | 37 | 0.005 | 37 | 0.000 |
| 2 | 15 | 0.011 | 4 | 0.005 | 4 | 0.000 |
| 1 | 1854 | 0.011 | 9 | 0.005 | 9 | 0.000 |
Note. TB = tuberculosis. The network metrics in this table quantify the visual information of Figure 3 ▶ and were used to develop and identify the cases and contacts identified as high priorities on the basis of high scores for reach, degree, and betweenness. For example, nodes 1833, 2034, and 1239 (surrounded by dashed-line boxes in Figure 3 ▶) were identified as important contacts for screening and evaluation because of their high betweenness scores in this table.
aNodes numbered between 1 and 35 represent TB patients; nodes with numbers greater than 1000 represent named contacts.
Among the 21 prioritized contacts with high reach scores highlighted in Figure 3 ▶ (white nodes), 14 (67%) were evaluated and 4 (29%) were diagnosed with LTBI, including 1 documented TST converter. Following completion of our initial network analysis, 212 additional contacts were identified for the index and secondary cases (including 33 contacts for new patients 36, 37, and 38) but were not incorporated into the network analysis. Among 189 (89%) new contacts evaluated, 26 were contacts of the index, and 12 (41%) were TST positive. The remaining 163 contacts of secondary cases resulted in only 8 (5%) TST-positive reactions. This contrasted with the 29% TST-positive rate (odds ratio= 7.8; 95% confidence interval=1.6, 36.6; 2-tailed P=.009) among the contacts prioritized through network analysis (Figure 3 ▶, Table 3 ▶). In total, 195 (98%) contacts with LTBI initiated isonicotinic acid hydrazide therapy for treatment of LTBI, and 165 (84%) completed therapy by December 2003.
Laboratory Analyses
All 14 M tuberculosis isolates from the culture-confirmed patients were susceptible to first-line TB drugs. Among 13 isolates genotyped at the CDC, all shared a matching spoligotype (octal code: 000000000003771) and 21-band restriction fragment length polymorphism pattern. The strain was identified as a member of the Beijing family, with no other strains identified.
DISCUSSION
Delayed diagnosis of a highly infectious TB patient was associated with a large outbreak. Aside from recent M tuberculosis infection among the 37 secondary cases, none had evidence of previous TB, injection drug use, HIV infection, or other immunocompromising conditions known to increase the risk of TB.19 This outbreak illustrates why TB contact investigations, while highly resource intensive, are critical to controlling this disease. Genotyping of M tuberculosis isolates indicates that some US communities still attribute up to 40% of their incident TB cases to recent M tuberculosis transmission,20 as opposed to remotely acquired infection. As transmission continues, the current contact investigation paradigm requires improvements before TB elimination can be achieved.2,4
An ongoing, systematic approach that could periodically analyze a health department’s contact investigation data for the existence of transmission patterns may help in earlier detection of M tuberculosis transmission and prioritization of contacts. The routinely gathered data accumulated in this outbreak provided a real-time opportunity to assess the visual and quantitative power of network analysis to complement standard contact investigation practice. Local and state TB programs already collect many of the necessary data to perform network analyses. The next steps for them to consider are how to organize their data into the proper format for analysis and how frequently to analyze them. This will depend on the local TB epidemiology and the extent to which inter-jurisdictional movement influences transmission; a fruitful strategy for Wichita may not necessarily serve New York City.
The first question in many public health investigations is whether all the cases are related. In the absence of M tuberculosis genotyping data (owing to delays in specimen processing, loss of isolates, or inability to culture the organism), the decision to link a TB patient to a particular disease cluster can be difficult. In an area of low TB incidence, local disease controllers may automatically attribute an increase in new cases to a single strain. In areas of higher incidence, it is often difficult to determine which incident cases are related.21,22 Network visualization provides a tool to identify linkages among cases, quantify the magnitude of an outbreak, and begin control measures while awaiting genotyping results (which are often delayed by several months). When we collectively visualized the connections among all TB patients and contacts (Figure 2 ▶), we observed that all but 1 patient were either directly or indirectly linked to the index patient. The lone unconnected patient in Figure 2 ▶ prompted further investigation. This teenager previously lived in close proximity to the index patient, a detail elicited from the teen owing to his original lack of connection to the main network and our subsequent follow-up interview. Later, DNA fingerprint analysis of both patients’ M tuberculosis isolates confirmed a matching strain.
Once a network diagram is constructed, a variety of metrics can describe the members.11,23 The metrics can reveal much about individuals, dyads, components, or the whole network. Metrics can reveal who is central in the network, who has the most connections, how dense the network is, and how long the average path is among all of the nodes. Network metrics in Table 3 ▶ quantify the visual representation in Figure 3 ▶. There were 21 unevaluated contacts with a reach metric that corresponded to a prominent role within the network. Nodes 1239 (upper right corner), 1833 (right lower corner), and 2034 (left lower corner) had high betweenness scores. These nodes represented the only identified epidemiological bridge connecting 3 smaller network components to the larger outbreak network.
Degree is a local metric that incorporates direct connections between 2 persons. It is simple to measure, but reveals information regarding only a small portion of the network and does not reflect the spread of infection. Reach is similar to degree in its simplicity of calculation and understanding, but offers more insight by incorporating both direct and indirect contacts. As an example, consider 2 contacts, both diagnosed with LTBI, named by 2 TB patients. The degree metric for these contacts is the same, implying that their effect in the network is the same. Yet 1 of these contacts may be more instrumental in propagation of infection, should TB develop and reach contagiousness. This would be revealed by the indirect, or secondary, links, which are captured in the reach metric.
Certain contacts may be prioritized for follow-up because they lie between groups in the network. They may serve as bridges, spreading infection through the social network. Contacts who connect 2 or more separate components may also serve as valuable sources of information about the dynamics of the network’s social milieu.24 Such persons may consequently serve as key informants for TB controllers trying to predict further M tuberculosis transmission in their community. Unevaluated contacts with a high betweenness metric could thus be prioritized for screening and extensive interview by outreach workers.
Network analysis has practical benefits and has proved feasible to implement. It empowers local TB controllers by allowing them to more rapidly uncover and visualize M tuberculosis transmission patterns within their own jurisdictions. With increased interjurisdictional sharing of data, the potential exists to uncover transmission patterns across a broader geographic region (county, state, interstate).21,25 In this investigation, the “connect-the-dots” approach helped frame and coordinate the outbreak response of 3 different county TB control programs and state health officials.
In addition to prioritizing contacts likely to have LTBI, it is also important to consider the risk that the infection will progress to TB disease. How network analysis can be used in this respect, particularly as host genetic factors for disease progression become elucidated, is an area we and other network analysts continue to pursue.23,26,27 The CDC and the TB Epidemiological Studies Consortium28 are currently completing a multisite study to assess the feasibility of using network analysis to complement standard day-to-day contact investigation procedures.
The resources required to perform network analysis may be beyond many TB control programs’ current capacity. Nevertheless, some of the basic concepts of network analysis can be incorporated into TB control practice without incurring substantial costs. For example, pursuing and evaluating repeatedly named contacts should be a common strategy, yet many programs have no trigger for identifying contacts named by more than 1 TB case over time. Training local staff on the basics of network analysis will require commitment from state and federal sources. Regional training of state-level staff that could examine statewide data or assist local programs to periodically assess their own network patterns should be considered. Free network analysis software is available.29,30
The virulence of this strain was also explored. This strain is identical to strain 210 (National TB Genotyping and Surveillance Network, unpublished data, 2000) and is widely distributed in the United States.31 This 21-band strain shares similar properties with strains designated W, which have caused large outbreaks in the past32; it may be considered a W variant.33 Although increased strain virulence has been associated with a large outbreak,34 it is unclear whether the increased ability of strain 210 to grow in human macrophages contributed to increased virulence.35
The CDC has recently made M tuberculosis genotyping services available to 50 state and 10 large city TB control programs in the United States.36 This strategy will advance our understanding of the nationwide transmission dynamics of M tuberculosis. As TB programs accumulate genotyping data and conduct cluster investigations over time (keeping in mind that 20% to 25% of TB patients in the United States are not M tuberculosis culture–confirmed and hence have no isolate for genotyping), they will need an analytic strategy to help examine the complex linkages among cases, contacts, and the places where these groups aggregate. Network analysis can help facilitate this strategy.
Acknowledgments
This project was funded by the Centers for Disease Control and Prevention, Department of Health and Human Services, US Public Health Service.
We wish to thank the following individuals for their assistance in coordinating the outbreak investigation: Phillip Lindsey, Associate TB Controller, Oklahoma Department of Health; Joe Mallonee, Deputy Commissioner of Disease and Prevention Services, Division of Communicable Diseases, Oklahoma Department of Health; Helen Gretz, TB Nursing Consultant, Oklahoma Department of Health; and Dhananjay Manthripragada, Phyllis Cruise, and Gail Grant, Division of TB Elimination, Centers for Disease Control and Prevention.
We are also grateful for the field activities performed by the following staff: Barbara McEndree, District Nurse Manager; Karen S. Weaver, District Nurse Manager; Cathy Terry; and Debi Hashimoto, all of the Comanche County Health Department; Francyne B. Winters, District Nurse Manager; Janie Osborne; Karen D. Brooks; and Elizabeth White, all of the Jackson County Health Department; and Teresa J. Downs, of the Tillman County Health Department.
Human Participant Protection This investigation was deemed to be an urgent public health response and, under CFR Title 45, Part 46, determined not to be human subject research by the National Center for HIV, STD, and TB Prevention, Centers for Disease Control and Prevention.
Peer Reviewed
Contributors M. Andre coordinated all outbreak investigation activities in the field including data collection and management and routine analyses, and led manuscript development. K. Ijaz assisted with study coordination and conducted field activities. J. D. Tillinghast provided overall supervision and logistical support on behalf of the State of Oklahoma. V.E. Krebs provided technical expertise in conceptualizing and designing the study, and performed network analyses. L. A. Diem and B. Metchock performed all molecular genotyping analyses and interpreted genotyping data. T. Crisp was responsible for overseeing contact investigations and follow-up of outbreak investigation activities. P.D. McElroy conceptualized the study and supervised all aspects of the study and drafting of the article.
References
- 1.Centers for Disease Control and Prevention. Reported Tuberculosis in the United States, 2003. Atlanta, Ga: US Department of Health and Human Services, Centers for Disease Control and Prevention; September 2004.
- 2.Centers for Disease Control and Prevention. Controlling tuberculosis in the United States: recommendations from the American Thoracic Society, CDC, and the Infectious Diseases Society of America [published correction appears in MMWR Morb Mortal Wkly Rep. 54(45):1161]. MMWR Recomm Rep. 2005;54(RR-12): 1–81. [PubMed] [Google Scholar]
- 3.Reichler MR, Taylor Z, Castro KG. Tuberculosis contact investigations. Int J Tuberc Lung Dis. 2003;7(12 suppl 3):S325–S327. [PubMed] [Google Scholar]
- 4.Mohle-Boetani JC, Flood J. Contact investigations and the continued commitment to control tuberculosis. JAMA. 2002;287:1040–1042. [DOI] [PubMed] [Google Scholar]
- 5.Jereb J, Etkind SC, Joglar OT, Moore M, Taylor Z. Tuberculosis contact investigations: outcomes in selected areas of the United States, 1999. Int J Tuberc Lung Dis. 2003;7(12 suppl 3):S384–S390. [PubMed] [Google Scholar]
- 6.Wilce M, Shrestha-Kuwahara R, Taylor Z, Qualls N, Marks S. Tuberculosis contact investigation policies, practices, and challenges in 11 US communities. J Pub Health Manag Pract. 2002;8:69–78. [DOI] [PMC free article] [PubMed] [Google Scholar]
- 7.Klovdahl AS, Graviss EA, Yaganehdoost A, et al. Networks and tuberculosis: an undetected community outbreak involving public places. Soc Sci Med. 2001; 52:681–694. [DOI] [PubMed] [Google Scholar]
- 8.Reichler MR, Reves R, Bur S, et al. Evaluation of investigations conducted to detect and prevent transmission of tuberculosis. JAMA. 2002;287:991–995. [DOI] [PubMed] [Google Scholar]
- 9.Etkind S. Contact tracing. TB: a comprehensive international approach. In: Reichman L, Hershfield E, eds. Lung Biology in Health and Disease. New York, NY: Marcel Dekker; 1993:275–289.
- 10.Veen J. Microepidemics of tuberculosis: the stone-in-the-pond principle. Tuber Lung Dis. 1992;73:73–76. [DOI] [PubMed] [Google Scholar]
- 11.Wasserman S, Faust K. Social Network Analysis: Methods and Applications. Cambridge, United Kingdom: Cambridge University Press; 1994.
- 12.Doherty IA, Padian NS, Marlow C, Aral SO. Determinants and consequences of sexual networks as they affect the spread of sexually transmitted infections. J Infect Dis. 2005;191(suppl 1):S42–S54. [DOI] [PubMed] [Google Scholar]
- 13.Fitzpatrick LK, Hardacker J, Heirendt W, et al. A preventable outbreak of tuberculosis investigated through an intricate social network. Clin Infect Dis. 2001;33:1801–1806. [DOI] [PubMed] [Google Scholar]
- 14.McElroy PD, Rothenberg RB, Varghese R, et al. A network-informed approach to investigating a tuberculosis outbreak: implications for enhancing contact investigations. Int J Tuberc Lung Dis. 2003;7(12 suppl 3): S486–S493. [PubMed] [Google Scholar]
- 15.American Thoracic Society, Centers for Disease Control and Prevention. Diagnostic standards and classification of tuberculosis in adults and children. Am J Respir Crit Care Med. 2000;161(4 pt 1):1376–1395. [DOI] [PubMed] [Google Scholar]
- 16.Menzies D. Interpretation of repeated tuberculin skin tests: boosting, conversion, and reversion. Am J Respir Crit Care Med. 1999;159:15–21. [DOI] [PubMed] [Google Scholar]
- 17.Kamerbeek J, Schouls L, Kolk A, et al. Simultaneous detection and strain differentiation of Mycobacterium tuberculosis for diagnosis and epidemiology. J Clin Microbiol. 1997;35:907–914. [DOI] [PMC free article] [PubMed] [Google Scholar]
- 18.van Embden JD, Cave MD, Crawford JT, et al. Strain identification of Mycobacterium tuberculosis by DNA fingerprinting: recommendations for a standardized methodology. J Clin Microbiol. 1993;31:406–409. [DOI] [PMC free article] [PubMed] [Google Scholar]
- 19.Centers for Disease Control and Prevention. Targeted tuberculin testing and treatment of latent tuberculosis infection. MMWR Recomm Rep. 2000; 49(RR-6):7–8. [PubMed] [Google Scholar]
- 20.Castro KG, Jaffe HW. Rationale and methods for the National Tuberculosis Genotyping and Surveillance Network. Emerg Inf Dis. 2002;8:1188–1191. [DOI] [PMC free article] [PubMed] [Google Scholar]
- 21.Lathan M, Mukasa LN, Hooper N, et al. Cross-jurisdictional transmission of Mycobacterium tuberculosis in Maryland and Washington, DC, 1996–2000, linked to the homeless. Emerg Infect Dis. 2002;8:1249–1251. [DOI] [PMC free article] [PubMed] [Google Scholar]
- 22.Dillaha JA, Yang Z, Ijaz K, et al. Transmission of Mycobacterium tuberculosis in a rural community, Arkansas, 1945–2000. Emerg Infect Dis. 2002;8: 1246–1248. [DOI] [PMC free article] [PubMed] [Google Scholar]
- 23.Bell DC, Atkinson JS, Carlson JW. Centrality measures for disease transmission networks. Soc Networks. 1999;21:1–21. [Google Scholar]
- 24.Rothenberg RB, Sterk C, Toomey KE, et al. Using social network and ethnographic tools to evaluate syphilis transmission. Sex Transm Dis. 1998;25: 154–160. [DOI] [PubMed] [Google Scholar]
- 25.McElroy PD, Sterling TR, Driver CR, et al. Use of DNA fingerprinting to investigate a multiyear, multi-state tuberculosis outbreak. Emerg Infect Dis. 2002;8: 1252–1256. [DOI] [PMC free article] [PubMed] [Google Scholar]
- 26.Potterat JJ, Rothenberg RB, Muth SQ. Network structural dynamics and infectious disease propagation. Int J STD AIDS. 1999;10:182–185. [DOI] [PubMed] [Google Scholar]
- 27.Rothenberg R. The transformation of partner notification. Clin Infect Dis. 2002;35(suppl 2):S138–S145. [DOI] [PubMed] [Google Scholar]
- 28.Centers for Disease Control and Prevention. Tuberculosis Epidemiologic Studies Consortium (TBESC). Atlanta, Ga: US Department of Health and Human Services, Centers for Disease Control and Prevention. Available at: http://www.cdc.gov/nchstp/tb/TBESC/TOC.htm. Accessed August 15, 2006.
- 29.Pajek [computer program]. Ljubljana, Slovenia: University of Ljubljana; 2006. Available at: http://vlado.fmf.uni-lj.si/pub/networks/pajek/. Accessed August 15, 2006.
- 30.KrackPlot [computer program]. Pittsburgh, Penn: Carnegie Mellon University; 2006. Available at: http://www.andrew.cmu.edu/user/krack/krackplot.shtml. Accessed August 15, 2006.
- 31.Yang Z, Barnes PF, Chaves F, et al. Diversity of DNA fingerprints of Mycobacterium tuberculosis isolates in the United States. J Clin Microbiol. 1998;36: 1003–1007. [DOI] [PMC free article] [PubMed] [Google Scholar]
- 32.Bifani PJ, Mathema B, Liu Z, et al. Identification of a W variant outbreak of Mycobacterium tuberculosis via population-based molecular epidemiology. JAMA. 1999;282:2321–2327. [DOI] [PubMed] [Google Scholar]
- 33.Beggs ML, Eisenach KD, Cave MD. Mapping of IS6110 insertion sites in two epidemic strains of Mycobacterium tuberculosis. J Clin Microbiol. 2000;38: 2923–2928. [DOI] [PMC free article] [PubMed] [Google Scholar]
- 34.Valway SE, Sanchez MP, Shinnick TF, et al. An outbreak involving extensive transmission of a virulent strain of Mycobacterium tuberculosis. New Engl J Med. 1998;338:633–639. [DOI] [PubMed] [Google Scholar]
- 35.Zhang M, Gong J, Yang Z, Samten B, Cave MD, Barnes PF. Enhanced capacity of a widespread strain of Mycobacterium tuberculosis to grow in human macrophages. J Infect Dis. 1999;179:1213–1217. [DOI] [PubMed] [Google Scholar]
- 36.National TB Controllers Association/CDC Advisory Group on Tuberculosis Genotyping. Guide to the Application of Genotyping to Tuberculosis Prevention and Control. Atlanta, Ga: US Department of Health and Human Services, Centers for Disease Control and Prevention; June 2004. Available at: http://www.cdc.gov/nchstp/tb/genotyping/toc.htm. Accessed August 15, 2006.