

Abstract
Background: Various statistical methods are commonly used to assess the accuracy of near-continuous glucose sensors. The performance and reliability of these methods have not been well described.
Methods: We used computer simulation to describe the behavior of several statistical measures including error grid analysis (EGA), receiver operating characteristics (ROC), correlation and repeated measures under varying conditions. Actual data from an inpatient accuracy study conducted by the Diabetes Research in Children Network (DirecNet) were also used to demonstrate these limitations.
Results: Sensors that were made artificially inaccurate by randomly shuffling the pairings to reference values still fell in zones A or B 78% of the time for the Clarke grid and 79% of the time for the modified grid. Area under the curve (AUC) values for these shuffled pairs averaged 64% for hypoglycemia and 68% for hyperglycemia. Continuous EGA analysis resulted in 73% of shuffled pairs designated as “Accurate Readings” or “Benign Errors”. Correlation analysis gave inconsistent results for sensors simulated to have identical accuracies with values ranging from 0.50-0.96. Simplistic repeated measures analyses accounting for subject effects, but ignoring temporal correlation patterns substantially inflated the probability of falsely obtaining a statistically significant result. In simulations where the null hypothesis was correct, 23% of observed p-values were <0.05 and 12% of observed p-values were <0.01.
Conclusions: Commonly used statistical methods can give overly optimistic and/or inconsistent notions of sensor accuracy if results are not placed in proper context. Novel techniques are needed to assess the accuracy of near-continuous glucose sensors.
Introduction
The introduction of glucose sensing devices for near continuous monitoring of interstitial glucose concentrations offers the potential to markedly alter the clinical management of type 1 diabetes. However, the appropriate set of accuracy measures to evaluate near continuous glucose sensors remains to be developed. Traditional methods applied to glucose meters do not fully capture the temporal dimension of glucose sensor data. Moreover, some of these methods have substantial limitations that should be understood in order to place analysis results in proper context.
Classical statistical measures are based on the sum of squared errors between the instrument and reference glucose measurements. Examples of these types of analyses are regression, analysis of variance (ANOVA) and correlation. A disadvantage of these approaches is that they focus on the magnitude of measurement errors and do not distinguish those errors that would be clinically significant in the management of diabetes.
Error grid analysis was developed to classify measurement errors according to their perceived clinical significance. 1 These errors are grouped into different levels, or “zones”, in order of assessed importance. A modification to the error grid was later proposed to further discern the clinical relevance of glucose measurement errors. 2 The advantages and disadvantages of error grid vs. classical statistical measures for the analysis of meter data have been debated. 3, 4 More recently, an adaptation of error grid analysis has been proposed for the evaluation of measurement error in the case of continuous glucose sensors. 5
Receiver operating characteristics (ROC) analysis 6 has been used to assess the ability to detect hypo- and hyperglycemia. In this approach, the sensitivity (percent of true events correctly classified) is compared to one minus the specificity (percent of non-events incorrectly classified). Area under the curve (AUC) is a commonly cited statistic from ROC analysis to describe how well a glucose meter or sensor detects values in the hypo- or hyperglycemic range.
The accuracy of a near-continuous sensor is often summarized by reporting the percentage of values falling in zone A or B of an error grid, the correlation between sensor and reference glucose values and AUC values for hypo- and/or hyperglycemia. In this paper we argue that these statistics do not adequately describe, and may give inflated notions of the true accuracy of a glucose sensor. We give examples from simulation results and a previous Diabetes Research in Children Network (DirecNet) study 7 to demonstrate the limitations of these and other methods commonly used to assess the accuracy of glucose measurements. The focus of this paper is on near-continuous sensors, but many of these results apply to meters as well.
We propose some alternative strategies to avoid the problems highlighted with these methods. Finally, we consider some ideas for incorporating the continuous nature of glucose sensors that are not captured by the “point-by-point” analysis methods typically used to assess glucose meters.
Materials and Methods
Data from an inpatient study conducted by DirecNet 7 to assess the accuracy of the GlucoWatch G2® Biographer (GW2B; Cygnus, Inc., Redwood City, CA) and simulation were used to investigate the behavior of error grid, receiver operating characteristics (ROC), correlation and repeated measures analyses. The methodology used in the DirecNet accuracy study has been described previously 7 and is briefly summarized here. Children aged 3-17 with type 1 diabetes were admitted to a clinical research center for 24h where they wore either one or two GW2B sensors. Concurrent hourly reference serum glucose values were obtained from venous blood using a hexokinase enzymatic method 8, 9 at the DirecNet Central Biochemistry Laboratory at the University of Minnesota. GW2B sensor glucose measurements were paired with the laboratory reference values within ±5 minutes after adjusting for physiologic and processing lags.
Error Grid and ROC Analyses
We used these GW2B-reference glucose pairs to simulate artificially inaccurate sensors by randomly “shuffling” the pairings. Within each subject, the GW2B sensor values were paired at random to a reference glucose value. Discrete 1, 2 and the recently presented continuous 5 error grid analyses were then conducted on the resulting “pairs” and area under the curve (AUC) 6 was computed for hypoglycemia (≤60 mg/dL) and hyperglycemia (>300 mg/dL). Continuous error grid analysis was restricted to consecutive reference glucose measurements within ±30 minutes. This was repeated for a total of 1,000 simulations. These results were compared to those from the actual (unshuffled) GW2B-reference pairs.
Difference Measures
For each sensor-reference glucose pair, the absolute difference was defined as the absolute value of the difference between the sensor and reference values. The relative absolute difference (RAD) was defined as the absolute difference divided by the reference glucose. RAD values were expressed as percentages. The ISO criteria 10 were used for binary assessment of accuracy for each sensor-reference pair. For reference values ≤75 mg/dL, the ISO criterion was defined as the sensor being within ±15 mg/dL. For reference values >75 mg/dL, the ISO criterion was defined as the sensor being within ±20%.
Correlation
Correlation gives a unit-free measure of association between two variables ranging from −1 to +1. A correlation of 0 denotes no association while a correlation approaching ± 1 denotes a nearly linear relationship between the two variables. The correlation between sensor and reference glucose is often interpreted as a measure of accuracy.
We simulated four different sensors each having identical accuracy, but with varying ranges of the reference glucose. The mean reference glucose was simulated using a uniform distribution with mean 200 mg/dL for each sensor. The range for the reference glucoses was taken to be ±25, ±50, ±100 and ±150 mg/dL, respectively for the four sensors. The accuracy of the sensors was fixed by taking the measured glucose level to be the reference glucose plus a normally distributed error with mean zero and a standard deviation of 25 mg/dL. Correlation was calculated between the sensor and true glucoses using the methods of Pearson and Spearman. 11 This was repeated for a total of 10,000 simulations and the mean correlation values over all simulations were displayed.
Correlation values (Pearson and Spearman) were also calculated using the actual GW2B-reference pairs from the DirecNet accuracy study 7 overall and stratified by the reference glucose level.
Repeated Measures
Data sets used to evaluate the accuracy of glucose sensors inevitably contain multiple data points from each subject. The statistical precision of the resulting accuracy measures depends on the number of different subjects as well as the number of total data points. For example, a data set of 50 sensor-reference pairs from each of 20 subjects would generally contain less information than a data set of 20 sensor-reference pairs from each of 50 subjects, even though both have 1,000 total data points.
It is therefore necessary to account for correlated data from the same subject in the analysis. Popular statistical methods for doing this are repeated measures ANOVA and mixed effects models. However, the simplest versions of these methods do not account for the potentially complex time-series patterns that may exist in these data.
Simulations were run to study the performance of repeated measures analyses that account for subject effects, but ignore temporal correlation patterns. Twenty subjects were simulated with 30 sensor-reference glucose pairs each and random subject effects (standard deviation=20 mg/dL) and a first-order autoregressive structure for the sensor errors (standard deviation=20 mg/dL; correlation=0.5 between successive values). The distribution of the errors was identical for all 30 values from each subject, so the null hypothesis of no sensor age effect was true in these simulations.
For each simulated dataset, a repeated measures analysis was performed to test this null hypothesis. Analysis accounted for subject effects, but not the autoregressive correlations within each subject. Sensor age was treated as a continuous variable with a linear slope and a p-value was computed for its effect. This was repeated for a total of 1,000 simulations. Analysis was performed using PROC MIXED in the SAS statistical software (SAS Institute, Cary NC) version 8.02.
Results
Error Grid Analysis
When sensors were made artificially inaccurate by randomly shuffling (repairing) the reference glucose values, 78% and 79% of GWB-reference pairs fell in zones A or B of the Clarke and modified error grids, respectively (Table 1). The actual (unshuffled) data resulted in 95% of GWB-reference glucose pairs falling in zones A or B of the Clarke error grid and 97% fell in zones A or B for the modified error grid.
Table 1.
Various Measures of Accuracy for Real and Simulated Sensors (N=3,190 sensor-reference pairs).
| Shuffled | Actual | |
|---|---|---|
| Pairs* | Data† | |
| Error Grid Analysis (EGA) | ||
| Clarke Zone A+B | 78% | 95% |
| Modified Zone A+B | 79% | 97% |
| Continuous EGA | ||
| Rate Grid Zone A+B | 80% | 94% |
| Accurate + Benign Errors | 75% | 94% |
| Area Under the ROC Curve | ||
| Hypoglycemia | 64% | 88% |
| Hyperglycemia | 68% | 93% |
| Difference Measures | ||
| Absolute Difference (median) | 53 mg/dL | 24 mg/dL |
| RAD‡ (median) | 32% | 15% |
| ISO criteria§ | 33% | 61% |
Sensor-reference pairs taken from the DirecNet Inpatient Accuracy Study 7 with reference values randomly reallocated to the sensor measurements.
Unshuffled sensor-reference glucose pairs taken from the same dataset.
RAD = Relative Absolute Difference defined as the Absolute Difference divided by the reference glucose (expressed as a percentage).
Binary assessment of accuracy. For reference value ≤75 mg/dL the sensor value must be within ± 15 mg/dL. For reference value >75 mg/dL, sensor value must be within ± 20%.
Similar results were observed with the newly proposed continuous glucose error grid analysis. 5 When the rates calculated from the reference were randomly paired to sensor calculated rates, 80% of the resulting points fell in zone A or B of the rate error grid (R-EGA). In the combined analysis of rate and point error grids, 75% of the shuffled pairs were deemed “Accurate Readings” or “Benign Errors” (Table 1). The actual (unshuffled) pairs fell in zone A or B of the rate grid 94% of the time and were classified as an “Accurate Reading” or “Benign Error” 94% of the time.
ROC Analysis
Many continuous glucose sensors, including the GW2B, can be set to alarm when the measured value is deemed too high or too low. As shown in Figure 1, an ROC curve is a plot of the percentage of true events that are correctly classified (sensitivity) vs. the percentage of non-events that are misclassified (one minus specificity). Both sensitivity and specificity depend on what threshold is chosen for the alarm level. Each point on the ROC curve therefore corresponds to a different alarm level. When the sensor-reference pairs were randomly shuffled, the mean AUC values were 64% for hypoglycemia and 68% for hyperglycemia. The actual GWB-reference pairs had AUC values of 88% and 93%, respectively (Table 1).
Figure 1.
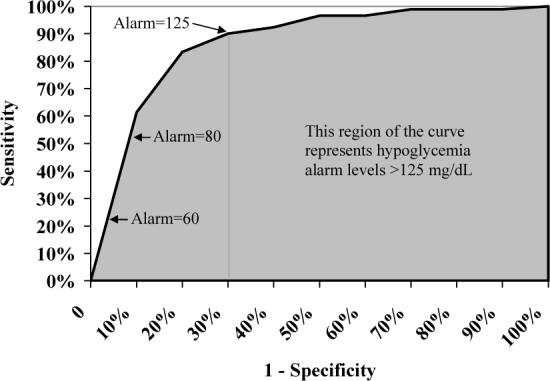
Receiver Operating Characterics (ROC) Curve for the Detection of Hypoglycemia (≤60 mg/dL). Each point on the ROC curve represents a different alarm level. Area under the curve (shaded) is heavily influenced by hypothetical alarm settings much higher than what would realistically be used in practice. This gives an artificial measure of “average” sensitivity as shown here using actual data from GW2B sensors in a DirecNet accuracy study.7
Difference Measures
The median absolute difference of the shuffled pairs was 53 mg/dL and the median relative absolute difference (RAD) was 32%. The ISO criteria were met by 33% of the shuffled pairs. In contrast, the median absolute difference of the actual pairs was 24 mg/dL and the median RAD was 15%. The ISO criteria were met by 61% of the GWB-reference pairs.
Correlation
Four simulated sensors with identical accuracies gave highly varying correlation values ranging from 0.50 to 0.96 (Table 2). The correlation value is influenced by the range of true glucose levels as well as by the accuracy of the sensor.
Table 2.
Correlation Values for Simulated and Actual Glucose Sensors.
| Range of “True” | |||
|---|---|---|---|
| Sensor #* | Glucose Values | Pearson | Spearman |
| 1 | 200 ± 25 mg/dL | 0.51 | 0.50 |
| 2 | 200 ± 50 mg/dL | 0.76 | 0.77 |
| 3 | 200 ± 100 mg/dL | 0.92 | 0.93 |
| 4 | 200 ± 150 mg/dL | 0.96 | 0.96 |
| Glucose† | N | Pearson | Spearman |
| ≤ 100 | 613 | 0.22 | 0.27 |
| 101-150 | 789 | 0.34 | 0.37 |
| 151-225 | 960 | 0.41 | 0.42 |
| > 225 | 828 | 0.53 | 0.50 |
| Overall | 3,190 | 0.85 | 0.86 |
Four sensors were simulated with identical accuracies, but with differing levels of variation in the true glucose.
Data from the GW2B sensor correlated with a laboratory reference 7 stratified by glucose level.
Another way of demonstrating this same phenomenon is to look at subgroups defined by the reference glucose where the range is necessarily reduced. Actual data from the DirecNet accuracy study 7 show that correlation values were much lower in each glucose level subgroup than for the overall data set combined. Even though the overall Pearson correlation was 0.85, the subgroup values only ranged from 0.22 to 0.53 (Table 2).
Repeated Measures
Simulations were run with 30 sensor-reference pairs for each of 20 subjects to estimate the effect of sensor age on the glucose measurement errors. The naïve statistical analysis accounting for repeated measures from the same subject, but ignoring the autocorrelation of the errors substantially underestimated the variance of the sensor age effect. The variance of the sensor age slope calculated by the regression model averaged 0.008, but the actual variance of the slope estimate in these simulations was 0.02.
This 2.5-fold underestimation of the variance resulted in a dramatic inflation of the Type I error rate giving the false impression of a sensor age effect. The observed p-value was <0.05 for 23% of the simulations (should be only 5% from a valid statistical method) and <0.01 for 12% of the simulations (should be only 1% from a valid statistical method).
Discussion
We have shown that error grid analysis, AUC statistics and the correlation coefficient can give misleading notions of sensor accuracy if results are not placed in proper context. Our analyses used GW2B sensor data as an example, but the limitations of these analytical methods also apply to other sensors and meters.
When sensors were paired at random to reference values, the percentage of data points falling in zones A or B was still nearly 80%. Thus, a seemingly impressive value of 90% would really only be half way between random guessing and the theoretic ideal of 100%. As the large majority of error grid analyses result in values between 90% and 99%, this measure may not distinguish the accuracy of different sensors very well.
These percentages are high even for the shuffled sensors because the combined A and B zones form a large region on both the Clarke and modified error grids. For example, a sensor measurement of 180 mg/dL would be classified as Zone A or B whenever the true glucose is >100mg/dL on either grid. However, a correction bolus dose calculated based on a sensor measurement of 180mg/dL when the true glucose was >300mg/dL could seriously underestimate the amount of insulin required to return plasma glucose to the normal range.
A continuous-time version of the Clarke error grid was recently presented. 5 However, like the original error grids, this approach may give artificial notions of sensor accuracy. In our simulations, 80% of randomly shuffled sensors fell in zones A or B of the rate of change grid (R-EGA) and 75% were deemed “Accurate Readings” or “Benign Errors”.
Area under the ROC curve (AUC) can be artificially inflated because much of that curve involves specificity levels much lower than would realistically be used in clinical practice. For example, GW2B data from the DirecNet accuracy study suggest that the hypoglycemia alarm would need to be set at 125 mg/dL before specificity would be as low as 70%. Since this is unlikely to be done in actual practice, it is largely irrelevant what the sensitivity would be at this or higher alarm levels. However, the AUC value is heavily weighted toward these scenarios since 70% of the ROC curve involves alarm settings over 125 mg/dL (Figure 1).
It is very tempting to use correlation as a surrogate measure of accuracy. A unit-free value constrained to always fall between −1 and +1 is very appealing and offers the seeming potential to directly compare results across studies with heterogeneous designs and conditions. We have shown, however, that correlation lacks two properties we would typically want from an accuracy measure. It does not always give comparable values for comparable sensors and the overall value need not be within the range of the subgroup values. The problem is that correlation is sensitive to variations in the true glucose values. 12 Increasing the range of the true glucose (e.g., inducing hypo- and/or hyperglycemia) will therefore increase the correlation value and decreasing the range (e.g., dividing into subgroups by reference glucose) will decrease the correlation even when accuracy of the sensor remains the same.
A p-value is sometimes reported in conjunction with (or instead of) a correlation coefficient. This p-value may be even more misleading because it corresponds to the hypothesis that the correlation is zero. Even a very inaccurate sensor would presumably have some positive correlation, so a highly significant p-value (e.g., p<0.001) tells us nothing about the accuracy of the sensor.
A simple alternative is the use of descriptive statistics on the differences between sensor and reference glucose measurements. For example, the difference (sensor minus reference value), absolute difference, relative difference and relative absolute difference (RAD) 7, 13, 14 are simple measures to describe the accuracy of the sensor. Because these distributions are often skewed, we advocate reporting median rather than mean values in abstracts where space is limited, but manuscripts should describe more of the distribution (e.g., median, quartiles and mean). It seems unlikely that a median absolute difference of 53 mg/dL or relative absolute error of 32% (Table 1) would be confused for an accurate sensor.
The ISO criteria 10 combines absolute (in the hypoglycemic range) and relative (for higher glucoses) differences in a binary assessment of whether the sensor was “close” to the reference. The percentage of sensor-reference pairs meeting these criteria offers another simple way of describing sensor accuracy. We agree with previous commentary that accuracy statistics should be reported separately for hypo-, normo- and hyperglycemic ranges. 15
Datasets used to evaluate sensor accuracy inevitably contain multiple points per subject. Statistical inferences must account for potentially correlated data from the same subject. The simulations presented in this paper show that simplistic repeated measures analysis can give invalid conclusions if the complexities of the covariance pattern are ignored. This is not as problematic when analyzing factors that remain constant for each subject (e.g., gender), but can lead to gross underestimation of the variance when examining factors that vary within subjects (e.g., sensor age). Even more sophisticated regression models can also go astray if the particular covariance pattern is unknown or misspecified. A safer alternative not requiring specification of the (usually unknown) covariance pattern is the use of the “bootstrap”. 16 In this statistical method, subjects are randomly re-sampled with replacement to determine the statistical margin of error.
Current analysis methods for the accuracy of near-continuous glucose sensors are largely borrowed from those originally developed for glucose meters. As such, they tend to focus on “point-by-point” assessments of accuracy and may miss important temporal aspects to the data. Even the proposed continuous error grid 5 is a point-by-point assessment of pairs of consecutive glucose measurements. It is unclear how much of the continuous nature of the data can be captured by looking back a single data point.
We believe that additional methods must be developed for analysis of near continuous glucose sensors. A simple step in this direction is changing the focus to “events” rather than individual time points. An isolated sensor value in the hypoglycemic range, for example, would not necessarily be considered a false positive. A sensor-defined event of hypo- or hyperglycemia should contain multiple values in the given range, and distinct events should be separated by multiple consecutive values outside the defined range. The assessment of sensitivity and false positive rates can then be performed on the event level rather than by individual points. A “buffer zone” of say 10 mg/dL could be used so that sensor values barely on the opposite side of the hypo- or hyperglycemic threshold are not considered a failure (e.g., a sensor event below 60 mg/dL should not be considered a false positive unless the reference is >70 mg/dL). 17
Another simple strategy to incorporate the continuous nature of the data would be to compare clinically relevant indices of glycemic control measured over time by a sensor vs. reference method. Examples include mean glucose, percentage of values in a given target range, magnitude of glycemic excursions (MAGE), the low and high blood glucose indices (LBGI/HBGI) 18 and number and severity of hypo/hyperglycemic events. Descriptive statistics of the differences between sensor and reference values could be used to further evaluate accuracy.
Ultimately, the best way to assess the accuracy of near-continuous sensors will depend on the intended use. Assessing sensors intended, for example, for retrospective assessment of trends would likely require different methodology than for a sensor intended to regulate an insulin pump. As was the case in the development of the error grids, the clinical relevance of measurement errors must be kept in mind when analyzing the accuracy of glucose sensors.
Footnotes
This research has been supported by the following NIH/NICHD Grants: HD041919-01; HD041915-01; HD041890; HD041918-01; HD041908-01; and HD041906-01. Clinical Centers also received funding through the following GCRC Grant Numbers M01 RR00069; RR00059; RR 06022 and RR00070-41. The GlucoWatch® G2™ Biographers were purchased from Cygnus, Inc. at a discounted price.
References
- 1.Clarke WL, Cox D, Gonder-Frederick LA, Carter W, Pohl SL. Evaluating clinical accuracy of systems for self-monitoring of blood glucose. Diabetes Care. 1987;10:622–8. doi: 10.2337/diacare.10.5.622. [DOI] [PubMed] [Google Scholar]
- 2.Parkes JL, Slatin SL, Pardo S, Ginsberg BH. A new consensus error grid to evaluate the clinical significance of inaccuracies in the measurement of blood glucose. Diabetes Care. 2000;23:1143–8. doi: 10.2337/diacare.23.8.1143. [DOI] [PubMed] [Google Scholar]
- 3.Gough DA, Botvinick EL. Reservations on the use of error grid analysis for the validation of blood glucose assays. Diabetes Care. 1997;20:1034–6. doi: 10.2337/diacare.20.6.1034. [DOI] [PubMed] [Google Scholar]
- 4.Cox DJ, Gonder-Frederick LA, Kovatchev BP, Julian DM, Clarke WL. Understanding error grid analysis. Diabetes Care. 1997;20:911–2. doi: 10.2337/diacare.20.6.911. [DOI] [PubMed] [Google Scholar]
- 5.Kovatchev BP, Gonder-Frederick LA, Cox DJ, Clarke WL. Evaluating the accuracy of continuous glucose-monitoring sensors: continuous glucose-error grid analysis illustrated by TheraSense Freestyle Navigator data. Diabetes Care. 2004;27:1922–8. doi: 10.2337/diacare.27.8.1922. [DOI] [PubMed] [Google Scholar]
- 6.Hanley JA, McNeil BJ. The meaning and use of the area under a receiver operating characteristic (ROC) curve. Radiology. 1982;143:29–36. doi: 10.1148/radiology.143.1.7063747. [DOI] [PubMed] [Google Scholar]
- 7.Diabetes Research in Children Network (DirecNet) Study Group The accuracy of the GlucoWatch G2 Biographer in children with type 1 diabetes: results of the Diabetes Research in Children Network (DirecNet) accuracy study. Diabetes Technol Ther. 2003;5:791–800. doi: 10.1089/152091503322526996. [DOI] [PMC free article] [PubMed] [Google Scholar]
- 8.Neese JW, Duncan P, Bayse D, Robinson M, Cooper T, Stewart C. Center for Disease Control; Atlanta: 1976. Development and evaluation of a hexokinase/glucose-6-phosphate dehydrogenase procedure for use as a national glucose reference method. [Google Scholar]
- 9.Passey RB, Gillum RL, Fuller JB, Urry FM, Giles ML. Evaluation and comparison of 10 glucose methods and the reference method recommended in the proposed product class standard (1974) Clin Chem. 1977;23:131–9. [PubMed] [Google Scholar]
- 10.International Organisation for Standardisation In vitro diagnostic test systems- Requirements for blood-glucose monitoring systems for self-testing in managing diabetes mellitus 2003ISO 15197:2003 Geneva, Switzerland [Google Scholar]
- 11.Snedecor GW, Cochran WG. Iowa State University Press; Ames, IA: 1980. Statistical Methods. [Google Scholar]
- 12.Bland JM, Altman DG. Statistical methods for assessing agreement between two methods of clinical measurement. Lancet. 1986;1:307–10. [PubMed] [Google Scholar]
- 13.Diabetes Research in Children Network (DirecNet) Study Group The accuracy of the CGMS in children with type 1 diabetes: results of the Diabetes Research in Children Network (DirecNet) accuracy study. Diabetes Technol Ther. 2003;5:781–9. doi: 10.1089/152091503322526987. [DOI] [PMC free article] [PubMed] [Google Scholar]
- 14.Diabetes Research in Children Network (DirecNet) Study Group Accuracy of the GlucoWatch G2 Biographer and the Continuous Glucose Monitoring System during hypoglycemia: experience of the Diabetes Research in Children Network. Diabetes Care. 2004;27:722–6. doi: 10.2337/diacare.27.3.722. [DOI] [PMC free article] [PubMed] [Google Scholar]
- 15.Klonoff DC. The need for separate performance goals for glucose sensors in the hypoglycemic, normoglycemic, and hyperglycemic ranges (Editorial) Diabetes Care. 2004;27:834–6. doi: 10.2337/diacare.27.3.834. [DOI] [PubMed] [Google Scholar]
- 16.Efron B, Tibshirani R. Chapman & Hall; New York, NY: 1993. An Introduction to the Bootstrap. [Google Scholar]
- 17.Diabetes Research in Children Network (DirecNet) Study Group GlucoWatch G2 Biographer alarm reliability during hypoglycemia in children. Diabetes Technol Ther. 2004;6:559–66. doi: 10.1089/dia.2004.6.559. [DOI] [PMC free article] [PubMed] [Google Scholar]
- 18.Kovatchev BP, Straume M, Cox D, Farhy LS. Risk analysis of blood glucose data: A quantitative approach to optimizing the control of insulin dependent diabetes. Theor Med. 2000;3:1–10. [Google Scholar]