

Abstract
Paclitaxel chemotherapy frequently induces neuropathic pain during and often persisting after therapy. The mechanisms responsible for this pain are unknown. Using a rat model of paclitaxel-induced painful peripheral neuropathy, we have performed studies to search for peripheral nerve pathology. Paclitaxel-induced mechano-allodynia and mechano-hyperalgesia were evident after a short delay, peaked at day 27 and finally resolved on day 155. Paclitaxel- and vehicle-treated rats were perfused on days 7, 27 and 160. Portions of saphenous nerves were processed for electron microscopy. There was no evidence of paclitaxel-induced degeneration or regeneration as myelin structure was normal and the number/density of myelinated axons and C-fibres was unaltered by paclitaxel treatment at any time point. In addition, the prevalence of ATF3-positive dorsal root ganglia cells was normal in paclitaxel-treated animals. With one exception, at day 160 in myelinated axons, total microtubule densities were also unaffected by paclitaxel both in C-fibres and myelinated axons. C-fibres were significantly swollen following paclitaxel at days 7 and 27 compared to vehicle. The most striking finding was significant increases in the prevalence of atypical (swollen and vacuolated) mitochondria in both C-fibres (1.6- to 2.3-fold) and myelinated axons (2.4- to 2.6-fold) of paclitaxel-treated nerves at days 7 and 27. Comparable to the pain behaviour, these mitochondrial changes had resolved by day 160. Our data do not support a causal role for axonal degeneration or dysfunction of axonal microtubules in paclitaxel-induced pain. Instead, our data suggest that a paclitaxel-induced abnormality in axonal mitochondria of sensory nerves contributes to paclitaxel-induced pain.
Keywords: Chemotherapy, Pain, Cancer, Microtubule, Degeneration, Allodynia, Hyperalgesia
1. Introduction
Paclitaxel (Taxol®) is a widely used chemotherapeutic agent derived from Pacific yew tree bark (Wani et al., 1971). It is indicated for the treatment of ovarian, breast and non-small cell lung carcinomas and Kaposi’s sarcoma. Paclitaxel binds to β-tubulin of microtubules, which form the mitotic spindle (Nogales et al., 1995), thereby stabilizing microtubules and enhancing microtubule polymerization (Kumar, 1981), a mechanism that was thought to underlie paclitaxel’s anti-tumour effect. However, it appears that the suppression of spindle-microtubule dynamics plays a greater role in paclitaxel’s chemotherapeutic properties (Yvon et al., 1999). Such suppression halts mitosis at the metaphase–anaphase transition, inducing apoptosis (Jordan et al., 1996; Kelling et al., 2003).
Peripheral neurotoxicity is a serious dose-limiting side effect of paclitaxel therapy. It evokes an array of symptoms; numbness and tingling, mechanical allodynia, cold allodynia and on-going burning pain. Patients describe some or all of these symptoms in a stocking-glove distribution (Rowinsky et al., 1993; Forsyth et al., 1997; Dougherty et al., 2004). Often symptoms are first experienced bilaterally in the toes and feet, but they have been reported to appear simultaneously in fingers and toes (Rowinsky et al., 1993; Dougherty et al., 2004). The incidence and severity of paclitaxel-induced neurotoxicity are dose-related (Postma et al., 1995), with doses exceeding 200 mg/m2 or repeated courses at 135/175 mg/m2 often inducing neurotoxicity (Lipton et al., 1989; van Gerven et al., 1994). Unfortunately, paclitaxel-induced pain and sensory abnormalities can become chronic, persisting for months or years following the termination of paclitaxel therapy (van den Bent et al., 1997; Dougherty et al., 2004).
The means by which paclitaxel induces a painful peripheral neuropathy are currently unknown, although impaired axoplasmic transport secondary to paclitaxel binding to the β-tubulin of axonal microtubules has been assumed. Early morphological studies reported degeneration when paclitaxel was injected into the sciatic nerve (Roytta et al., 1984; Roytta and Raine, 1985, 1986). The clinical relevance of these studies is questionable as endoneurial concentrations of paclitaxel were exceedingly high. Recent rat studies are more clinically relevant as they employed systemic paclitaxel administration, either intravenous (Cavaletti et al., 1997; Cliffer et al., 1998) or intraperitoneal (Cavaletti et al., 1995; Campana et al., 1998; Authier et al., 2000; Polomano et al., 2001). The consensus of these studies is that the degree of degeneration observed is positively correlated to the dose of paclitaxel. Many of these studies used high doses of paclitaxel, which impaired animal health, and the morphological analyses were mainly descriptive, not quantitative. Polomano et al. (2001) reported that low doses of paclitaxel-induced pain without sciatic nerve degeneration, suggesting that peripheral nerve degeneration does not cause the pain syndrome.
Here, using low doses of paclitaxel in rats as previously described (Flatters and Bennett, 2004a), we describe a full behavioural time course of paclitaxel-induced mechanical hypersensitivity from onset to resolution. We then present a quantitative examination of peripheral sensory nerves in relation to pain behaviour following paclitaxel treatment. Preliminary results of this study have appeared in abstract form (Flatters and Bennett, 2004b).
2. Methods
2.1. Animals
Adult male Sprague–Dawley rats (250–300 g, Harlan Inc., Indianapolis, IN; Frederick, Maryland breeding colony) were housed in groups of three on sawdust bedding in plastic cages. Artificial lighting was provided on a fixed 12 h light–dark cycle with food and water available ad libitum. These studies were approved by the Faculty of Medicine Animal Care Committee of McGill University and were conducted in accordance with the Guidelines for Animal Research by the International Association for the Study of Pain (Zimmermann, 1983).
2.2. Drug administration
Paclitaxel, 2 mg/kg/ml: Taxol® (Bristol-Myers-Squibb – 6 mg/ml paclitaxel in Cremophor EL and dehydrated ethanol), was diluted with saline. Vehicle was prepared from 1 part vehicle stock solution diluted with 2 parts saline (vehicle stock solution: Cremophor EL and 95% dehydrated ethanol in 1:1 ratio). Paclitaxel or vehicle was injected intraperitoneally (i.p.) on four alternate days (days 0, 2, 4 and 6) as previously described (Flatters and Bennett, 2004a). Both paclitaxel and vehicle were administered in a 1.0 ml/kg volume. Both vehicle-treated and paclitaxel-treated rats gained weight normally as previously described (Polomano et al., 2001).
2.3. Behavioural testing
All animals were habituated to the behavioural testing environment and three baseline measurements of mechanical sensitivity were taken prior to paclitaxel or vehicle administration. For each testing session, animals were placed on an elevated wire mesh floor and confined underneath individual overturned perspex boxes (dimensions – 29 × 18 × 13 cm) and allowed to acclimatize for 10 min. Mechano-allodynia and mechano-hyperalgesia were assessed using three von Frey filaments with bending forces of 4, 8 and 15 g. In ascending order of force, each filament was applied to the mid-plantar area (avoiding the base of the tori) of each hind paw 5 times, with each application held for 5 s. Withdrawal responses to the von Frey filaments from both hind paws were counted and then expressed as an overall percentage response, as previously described in (Flatters and Bennett, 2004a). Behavioural testing was performed on days 6, 15, 27, 51, 66, 79, 93, 132, 147 and 155 following the initiation of paclitaxel or vehicle treatment (see Fig. 1). Paclitaxel-induced responses to 4 g are best described as allodynia. Responses to 15 g are probably best described as hyperalgesia and responses to 8 g are intermediate (see Flatters and Bennett, 2004a).
Fig. 1.
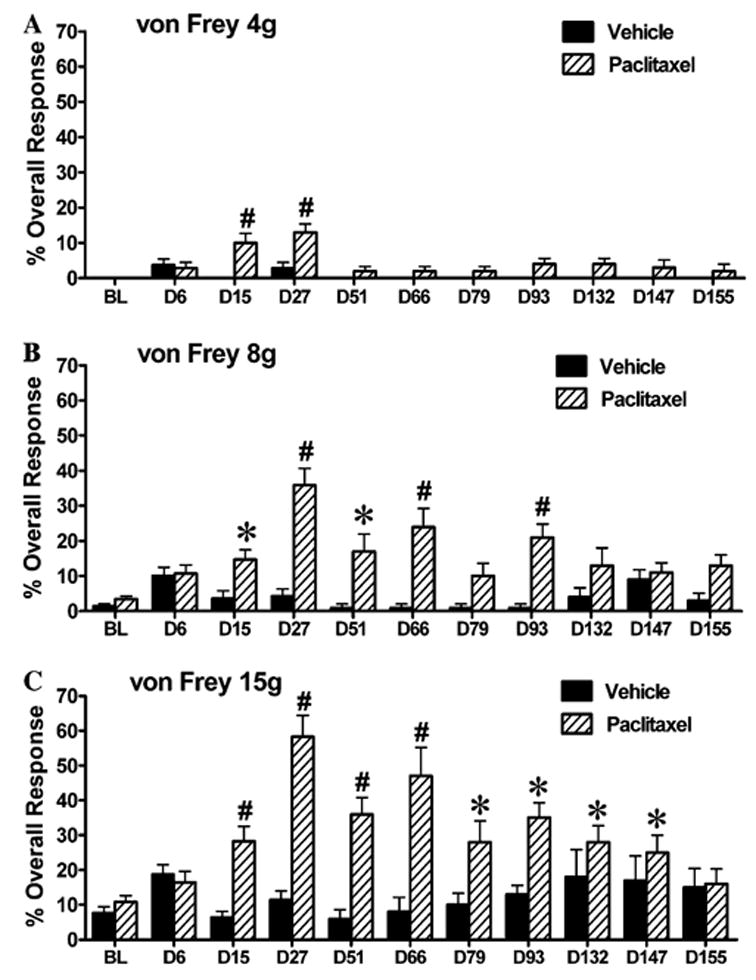
Behavioural time-course of mechano-allodynia and mechano-hyperalgesia induced by paclitaxel treatment. Graph shows the mean ± SEM of the response frequency to mechanical stimulation by (A) von Frey 4 g, (B) von Frey 8 g and (C) von Frey 15 g. n = 8–14 for vehicle treatment, n = 10–17 for paclitaxel treatment. *p < 0.05, #p < 0.01, one-way repeated-measures ANOVA with Dunnett’s post hoc analysis compared to baseline (BL).
2.4. Immunohistochemistry
Rats were overdosed with sodium pentobarbital and transcardially perfused with perfusion buffer (containing 50 ml of 0.2 M phosphate buffer (PB), 8 g NaCl, 0.25 g KCl, 0.5 g NaHCO3 and 950 ml distilled water/L) containing 0.1% sodium nitrite for 1 min, followed by 4% paraformaldehyde in 0.1 M PB, pH 7.4, for 30 min. Paclitaxel-treated and vehicle-treated rats were perfused at days 11 and 27 post-initiation of treatment. Nerve-injured rats were perfused 3 days following a standard sciatic nerve transection (axotomy) procedure (under anaesthesia the sciatic nerve was exposed, ligated at mid-thigh level and transected distal to the ligature). The vertebral column was removed and post-fixed for 12 h, after which the L4 and L5 DRGs were removed and cryoprotected in 30% sucrose solution at 4 °C overnight. The following day, DRG, were frozen, embedded in Optical Cutting Temperature (OCT) compound. Sixteen micrometre sections were cut on a cryostat and collected in phosphate-buffered saline (PBS) containing 0.2% Triton X-100 (PBS + T). Following a 1 h incubation in PBS + T containing 10% normal goat serum (NGS) at room temperature (RT), sections were incubated in rabbit anti-ATF3 primary antibody (Santa Cruz Biotechnology) diluted to 1:500 in PBS + T containing 5% NGS for 24 h at 4 °C. After rinsing in PBS + T, sections were incubated in goat anti-rabbit CY3-labelled secondary antibody (Jackson ImmunoResearch Laboratories Inc.) diluted to 1:200 in PBS + T containing 2% NGS for 90 min at RT. Following a rinse in PBS sections were mounted on slides with Vectashield mounting medium (Vector Labs). There was no difference between the numbers of ATF3-positive cells at day 11 and day 27 post-treatment in either vehicle-treated or paclitaxel-treated animals. Therefore, day 11 and day 27 groups were pooled for analysis. For quantification, a total of 36 sections from 8 paclitaxel-treated rats, 25 sections from 4 vehicle-treated rats and 12 sections (of ipsilateral DRG) from 3 nerve-transected rats were examined.
2.5. Electron microscopy
Rats were overdosed with sodium pentobarbital and transcardially perfused with perfusion buffer containing 0.1% sodium nitrite for 1 min, followed by 1% glutaraldehyde and 1% paraformaldehyde in 0.1M PB, pH 7.4, for 30 min. Paclitaxel-treated and vehicle-treated rats were perfused at days 7, 27 and 160 post-initiation of treatment, i.e., 24 h after the last injection of paclitaxel/vehicle, at the time of peak abnormal pain behaviour, and at the time of resolution of pain behaviour (see Fig. 1). Fifty millimetre portions of saphenous nerves were dissected at the mid-thigh level and post-fixed for 2 h in the fixation described above. Nerve portions were then transferred to 10% sucrose in 0.1 M PB and kept at 4 °C for a minimum of 12 h. The following day, sections were incubated in 1% osmium tetroxide in 0.1 M PB, pH 7.4, at 4 °C for 2 h, dehydrated in ascending concentrations of alcohol and propylene oxide at room temperature and then embedded in blocks of Epon. 1 μm transverse sections of nerves were cut and then stained with toluidine blue for preliminary examination with a light microscope at 40× to assess specimen quality. For analysis, 70 nm ultrathin sections were acquired with an ultramicrotome using a diamond knife, collected on Formvar-coated single slot grids and then counterstained with lead citrate and uranyl acetate. Grids were observed in a Philips EM410 electron microscope operated at 80 kV. Photographs of nerve sections were taken and analysed using a Megaview II CCD camera and AnalySIS 5.0 software (both from Soft Imaging System Corp., Lakewood, CO, USA). Electron photomicrographs were taken for analysis at three magnifications: 725×, 3130× and 44,400×. The analysis and quantification described below was performed by the same investigator under blind conditions.
2.6. 725× magnification
Electron photomicrographs were taken at 725× and compiled to make a photo-montage of the entire cross-section of the saphenous nerves (n = 3 for both paclitaxel and vehicle treatment at each time point). From these 725× montages, the total number of myelinated axons was counted in each nerve (Fig. 2C). The cross-sectional nerve area was calculated (see Table 1), using the area of an ellipse formula (π × long axis × short axis). The density of myelinated axons was calculated by dividing the total number of axons by the cross-sectional nerve area (no./μm2, see Table 1).
Fig. 2.
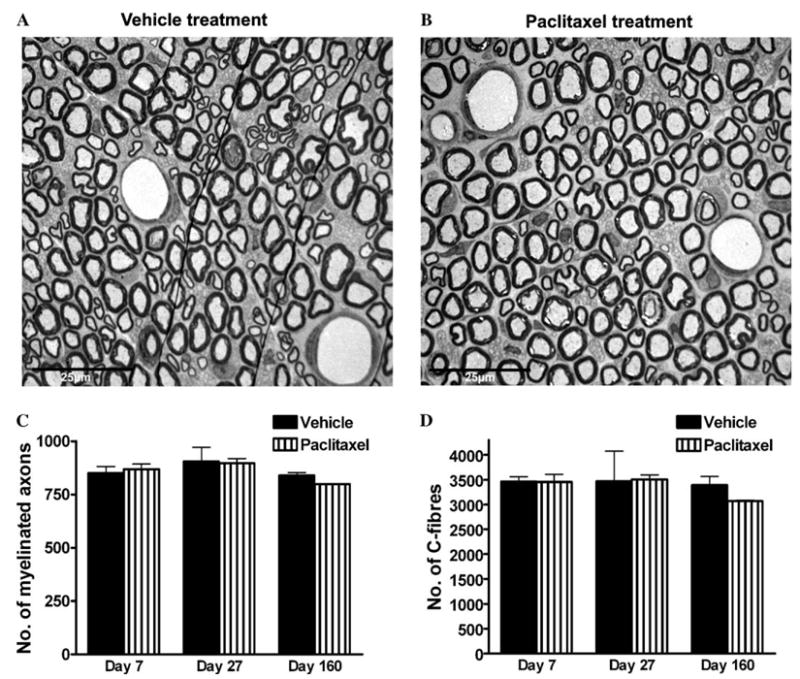
Saphenous nerve sections from (A) vehicle-treated and (B) paclitaxel-treated rats at day 27 post-treatment initiation, i.e., at the time of peak of paclitaxel-induced pain behaviour. Examination at this magnification (725×) shows that the overall morphology of peripheral sensory nerves is unaltered by paclitaxel treatment. Note: the fine black lines seen in (A) are small folds in the section. Graphs show the mean ± SEM of the number of (C) myelinated axons and (D) C-fibres in complete saphenous nerve sections of vehicle-treated and paclitaxel-treated rats, n = 3 per group (C) and n = 2 per group (D). There is no significant difference in the number of myelinated axons or C-fibres following paclitaxel treatment, at any time point, compared to vehicle treatment (two-tailed unpaired t-tests, Welch correction applied as appropriate).
Table 1.
Cross-sectional area and density of myelinated axons and C-fibres of saphenous nerves of vehicle- and paclitaxel-treated rats
| Day 7 vehicle | Day 7 paclitaxel | Day 27 vehicle | Day 27 paclitaxel | Day 160 vehicle | Day 160 paclitaxel | |
|---|---|---|---|---|---|---|
| Cross-sectional nerve area (μm2) | 37,958 ± 3277 | 33,236 ± 2055 | 35,219 ± 3128 | 38,496 ± 2264 | 46,695 ± 4453 | 44,089 ± 2544 |
| Density of myelinated axons (no./μm2) | 0.077 ± 0.052 | 0.025 ± 0.001 | 0.022 ± 0.001 | 0.019 ± 0.001 | 0.018 ± 0.001 | 0.018 ± 0.001 |
| Density of C-fibres (no./μm2) | 0.099 ± 0.006 | 0.092 ± 0.007 | 0.082 ± 0.006 | 0.074 ± 0.005 | 0.069 ± 0.010 | 0.072 ± 0.006 |
Values expressed as means ± SEM, n = 3 at each time point for nerve areas and myelinated axon density, n = 2 at each time point for C-fibre density.
2.7. 3130× magnification
Electron photomicrographs were taken at 3130× and compiled to make a photo-montage of the entire cross-section of the saphenous nerves (n = 2 for both paclitaxel and vehicle treatment at each time point). From these 3130× montages, the total number of C-fibres was counted in each nerve (Fig. 2D). The C-fibre density was calculated by dividing the total number of axons by the cross-sectional nerve area (no./μm2 see Table 1).
2.8. 44,400× magnification
Remak bundles that had the nuclei of their Schwann cells (nucleated Remak bundles, NRBs) in the plane of section were identified and numbered using the 725× photo-montages. Using a random number table, NRBs were randomly selected and 60 C-fibres that were enveloped by these NRBs were photographed at 44,400× magnification. Myelinated axons that surrounded the randomly selected NRBs were also photographed at 44,400× until 60 myelinated axons had been photographed from the section. Only myelinated axons that directly surrounded the NRBs selected were photographed. This selection method provided unbiased sampling of 60 C-fibres and 60 myelinated axons from each saphenous nerve section. When photographing myelinated axons, each axon was searched for mitochondria present in the plane of section; if observed, a photograph was taken to encompass the mitochondria and the surrounding cytoplasm. If no mitochondria were present, then a random photograph was taken of the cytoplasm. This process was performed on one section of saphenous nerve per animal (three paclitaxel-treated rats and two vehicle-treated rats at days 7, 27 and 160 post-initiation of treatment). Therefore at each time point, 180 C-fibres and 180 myelinated axons from paclitaxel-treated nerves were compared to 120 C-fibres and 120 myelinated axons from vehicle-treated nerves. From these photographs, C-fibre cross-sectional areas, microtubules, and mitochondria were examined and quantified.
2.9. C-fibre cross-sectional area
This was measured in μm2 electronically using AnalySIS 5.0 software (See Fig. 4).
Fig. 4.
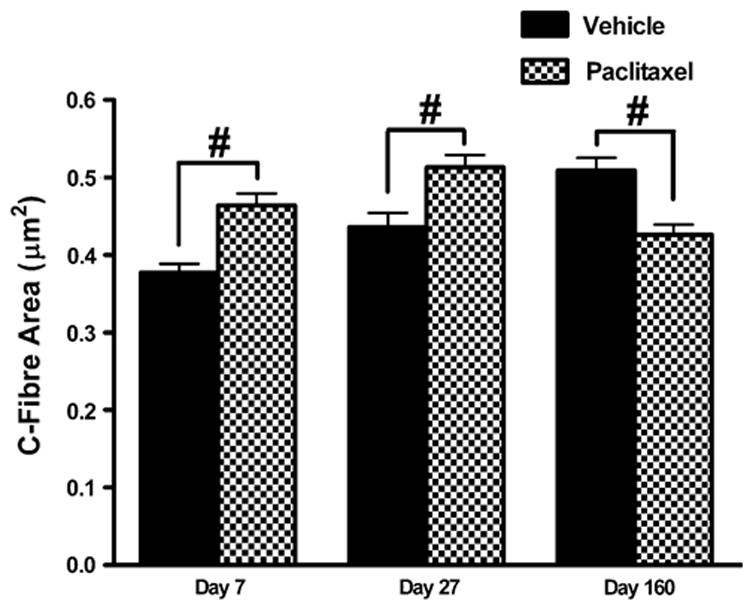
Effect of paclitaxel on cross-sectional area of C-fibres. Graph shows the mean ± SEM of the C-fibre area in vehicle-treated and paclitaxel-treated nerves at days 7, 27 and 160 post-initiation of treatment. At each time point, 120 C-fibres were measured from two vehicle-treated rats and 180 C-fibres from three paclitaxel-treated rats. Vehicle n = 120, paclitaxel n = 180: #p < 0.01, two-tailed unpaired t-tests, Welch correction applied as appropriate.
2.10. Analysis of microtubules
Microtubules were identified in C-fibres and myelinated axons as small dark circles approximately 25 nm in diameter. The majority of microtubules observed in both paclitaxel-treated and vehicle-treated nerves were circular, as would be expected in cross-sectional views because they are oriented parallel to the long axis of the nerve. As previously published (Tanner et al., 1998; Topp et al., 2000) oblique-sectioned (‘‘oblique’’) microtubules were also observed; these had an oval structure, approximately 25 nm in width and varying in length (see Fig. 6). Microtubules were counted in the sampled C-fibres and myelinated axons of each nerve section and classified as either circular or oblique. The density of all microtubules (total microtubule density) was calculated at each time point for paclitaxel- and vehicle-treated myelinated axons and C-fibres (no./μm2, see Fig. 5). In addition, the densities of circular and oblique microtubules were calculated, separately, for paclitaxel- and vehicle-treated myelinated axons (no./μm2, see Fig. 7). As C-fibres were photographed in their entirety, the mean total number of microtubules per C-fibre, mean number of circular microtubules per C-fibre, and mean number of oblique microtubules per C-fibre were calculated for paclitaxeland vehicle-treated nerves (see Fig. 8).
Fig. 6.
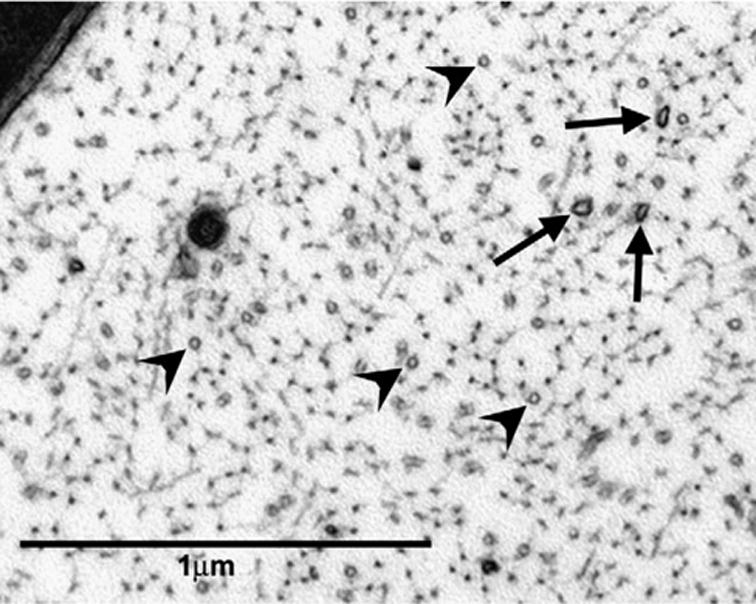
Circular and oblique microtubule profiles in a myelinated axon. Axoplasm of a myelinated axon in the saphenous nerve from a paclitaxel-treated rat at day 27 post-treatment initiation (44,400×). Circular (arrowheads) and oblique (arrows) microtubules. Note that circular microtubules occur with a much greater frequency than oblique microtubules.
Fig. 5.
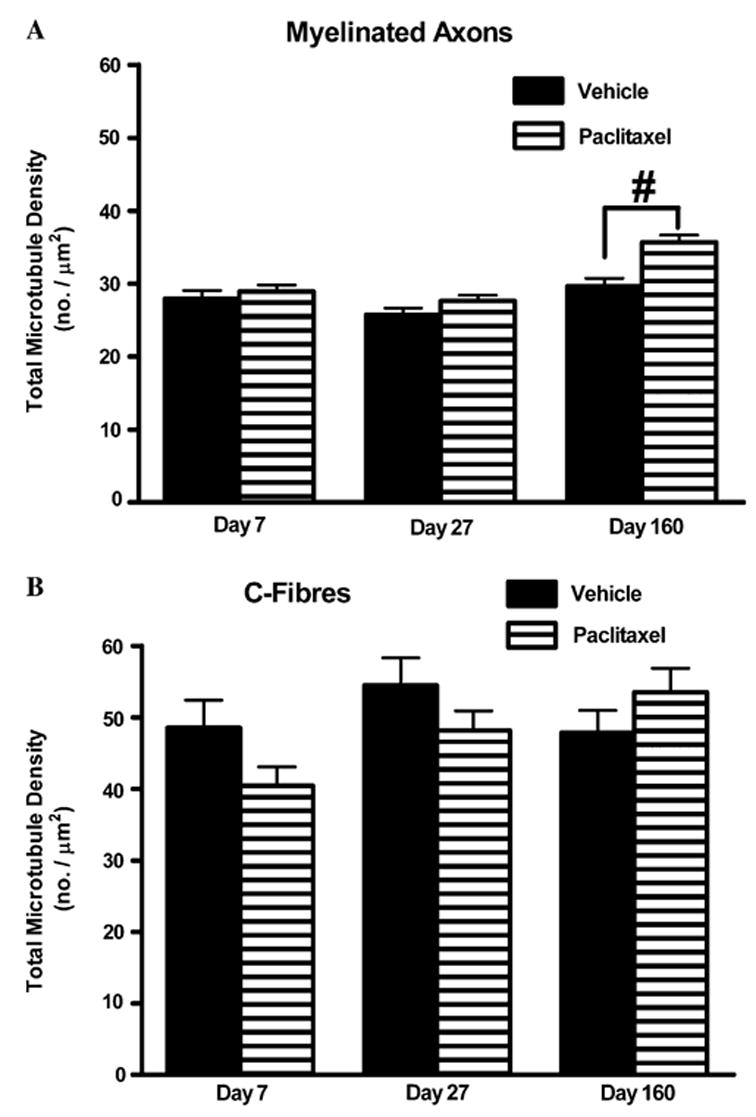
Effect of paclitaxel on total microtubule densities in myelinated axons and C-fibres. Graphs show the mean ± SEM of the total microtubule density in (A) myelinated axons and (B) C-fibres of vehicle-treated and paclitaxel-treated nerves at days 7, 27 and 160 postinitiation of treatment. At each time point, microtubules were counted in 120 myelinated axons/C-fibres randomly sampled from two vehicle-treated rats and 180 myelinated axons/C-fibres randomly sampled from three paclitaxel-treated rats. Vehicle n = 120, paclitaxel n = 180: #p < 0.01, two-tailed unpaired t-tests.
Fig. 7.
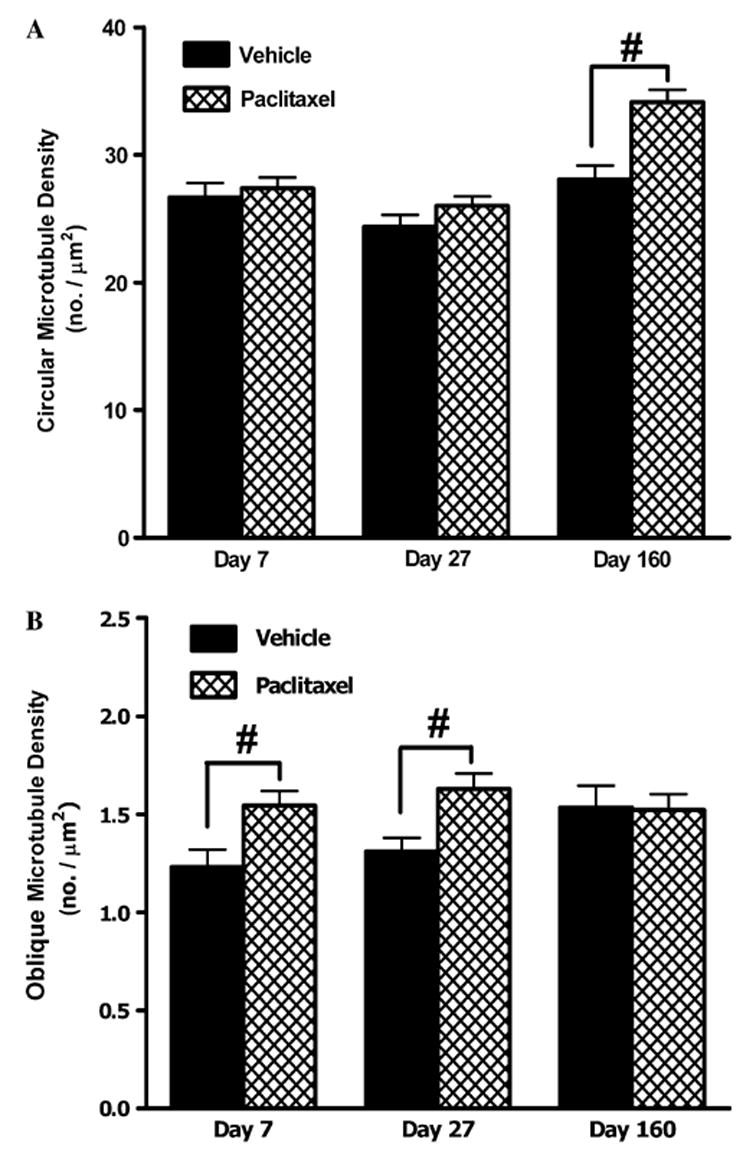
Effect of paclitaxel on circular and oblique microtubule populations in myelinated axons. Graphs show the mean ± SEM of the density of (A) circular microtubule profiles and (B) oblique microtubule profiles in myelinated axons of vehicle-treated and paclitaxel-treated nerves at days 7, 27 and 160 post-initiation of treatment. At each time point, circular and oblique microtubules were counted in 120 myelinated axons randomly sampled from two vehicle-treated rats and 180 myelinated axons randomly sampled from three paclitaxel-treated rats. Vehicle n = 120, paclitaxel n = 180: #p < 0.01, two-tailed unpaired t-tests, Welch correction applied as appropriate. Note: marked 16-fold change in y-axis range in (B) compared to (A).
Fig. 8.
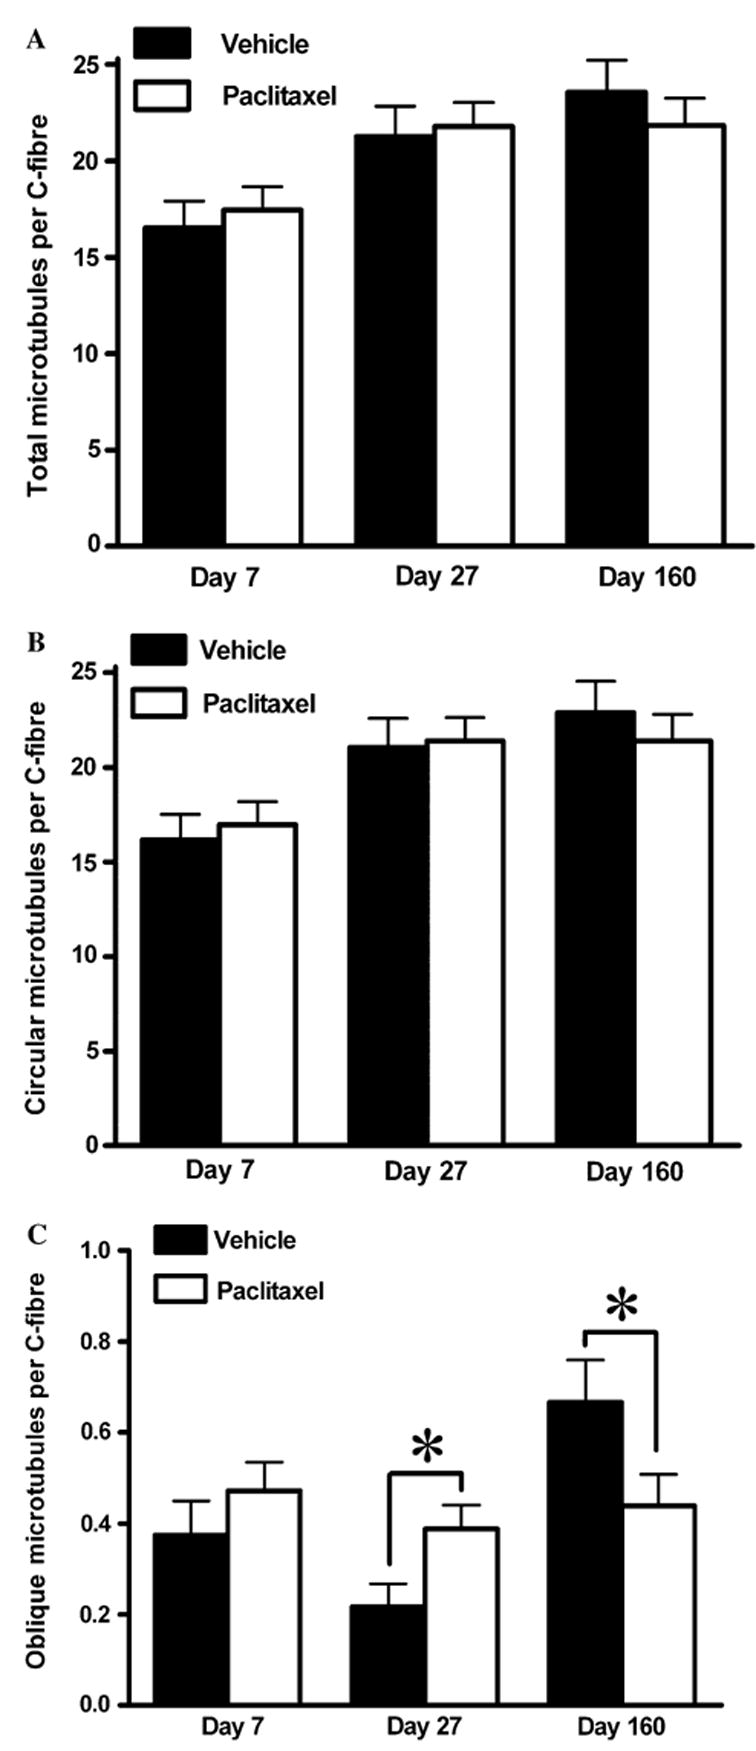
Effect of paclitaxel on microtubule populations in C-fibres. Graphs show the mean ± SEM of the number of (A) total microtubules, (B) circular microtubules and (C) oblique microtubules per C-fibre in vehicle-treated and paclitaxel-treated nerves at days 7, 27 and 160 post-initiation of treatment. At each time point, microtubules were counted and classified in 120 C-fibres randomly sampled from two vehicle-treated rats and 180 C-fibres randomly sampled from three paclitaxel-treated rats. Vehicle n = 120, paclitaxel n = 180: *p < 0.05, two-tailed unpaired t-tests, Welch correction applied as appropriate. Note: the marked 20-fold change in y-axis range in (C) compared to (A) and (B).
2.11. Analysis of mitochondria
Mitochondria were identified within C-fibres and myelinated axons as circular or oval structures containing cristae and amorphous electron dense material enveloped by double membranes. As the orientation of mitochondria is variable in relation to the plane of section, the length of mitochondria was variable within the range 165–265 nm. Atypical mitochondria were observed within both C-fibres and myelinated axons. Atypical mitochondria also possessed a complete double membrane; they were defined as atypical on the basis of: (a) vacuolation of 50% or more of the mitochondrial area and/or (b) pronounced swelling. Vacuolated mitochondria often contained an accumulation of relatively electron dense material situated at one pole of the mitochondria. This material was generally amorphous, with occasional linear structures that are probably the remnants of cristae (examples shown in Figs. 9 and 10). Pronounced swelling was defined as an approximate 2- to 3-fold increase in mitochondrial size, thus the length of swollen mitochondria varied between 280 and 630 nm. Of the C-fibres or myelinated axons that were sampled in each nerve section, those that contained one or more atypical mitochondria were counted. The proportion of C-fibres or myelinated axons that contained atypical mitochondria was then expressed as a percentage of the total C-fibres or myelinated axons sampled. Therefore, the mean prevalence of atypical mitochondria was quantified in paclitaxel- treated nerves (n = 3) and vehicle-treated nerves (n = 2) at each of the three time points (see Fig. 11). As the C-fibres were photographed in their entirety, it was possible to quantify the total number of mitochondria that were observed in the plane of section of the C-fibres sampled. From this, we calculated the proportion of atypical mitochondria of the total number of mitochondria observed in C-fibres for both paclitaxel- and vehicle-treated nerves.
Fig. 9.
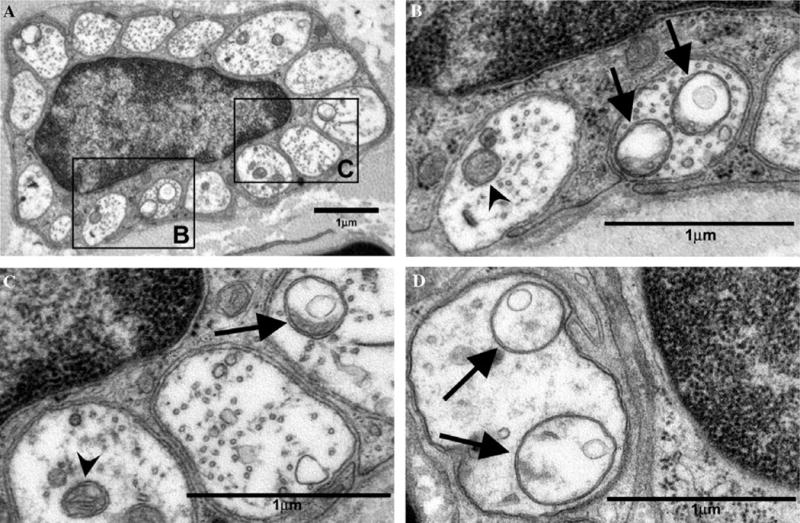
Atypical and normal mitochondria in C-fibres of the saphenous nerve of paclitaxel-treated rats. Normal mitochondria (arrowheads) and atypical (swollen and vacuolated) mitochondria (arrows). (A) Remak bundle with Schwann cell nucleus from a paclitaxel-treated rat at day 27 post-treatment initiation. (B, C) C-fibres from nucleated Remak bundle shown in (A) of paclitaxel-treated rat at day 27 post-treatment initiation. (D) C-fibres from a paclitaxel-treated rat at day 7 post-treatment initiation. Magnifications: (A) 13,800×, (B–D) 44,400×.
Fig. 10.
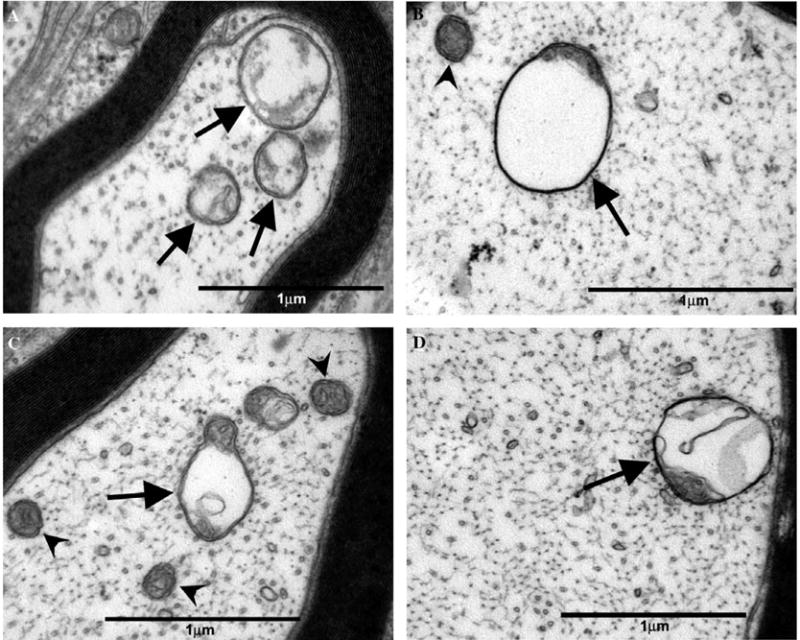
Atypical and normal mitochondria in myelinated axons of the saphenous nerve of paclitaxel-treated rats. Normal mitochondria (arrowheads) and atypical (swollen and vacuolated) mitochondria (arrows). (A) Small, thinly myelinated Aδ-fibre and (B) large myelinated Aβ-fibre of a paclitaxel-treated rat at day 7 post-treatment initiation. (C) Small, thinly myelinated Aδ-fibre and (D) large myelinated Aβ-fibre of a paclitaxel-treated rat at day 27 post-treatment initiation. Magnification: (A–D) 44,400×.
Fig. 11.
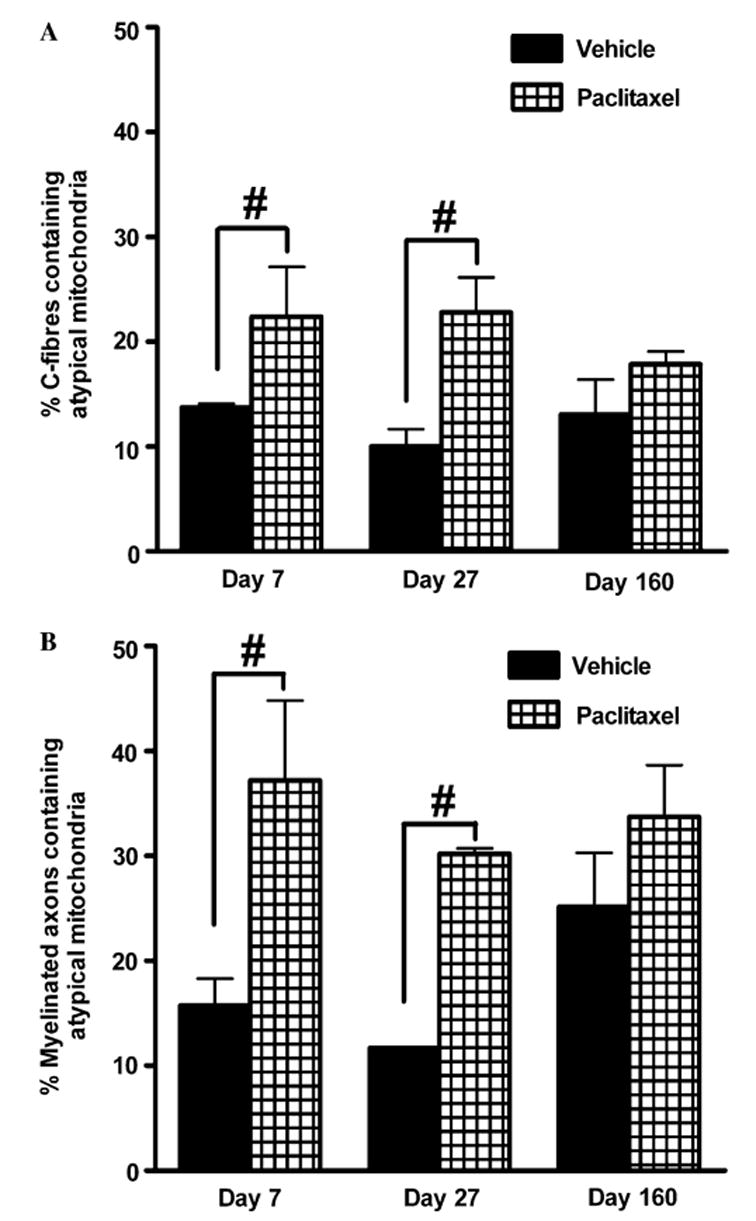
Effect of paclitaxel on the prevalence of atypical mitochondria in C-fibres and myelinated axons. Graphs show the mean ± SEM of the percentage of (A) C-fibres and (B) myelinated axons that contained atypical mitochondria in vehicle-treated and paclitaxel-treated nerves at days 7, 27 and 160 post-initiation of treatment. Sixty myelinated axons/C-fibres were randomly sampled per animal and the number of myelinated axons/C-fibres that contained atypical mitochondria counted and expressed as a percentage of the total C-fibres/myelinated axons sampled. At each time point, n = 2 for vehicle treatment and n = 3 for paclitaxel treatment. #p < 0.01, Fisher’s exact test.
2.12. Statistical analysis
One-way, repeated-measures, analysis of variance (ANOVA) followed by Dunnett’s post hoc analysis was used to compare pre-paclitaxel/vehicle baseline behavioural responses (BL) to post-paclitaxel/vehicle behavioural responses. Two-tailed unpaired t-tests (Welch correction applied when appropriate) were used to compare between paclitaxel-treated nerves and vehicle-treated nerves, at days 7, 27 and 160, for the following measurements: the number of myelinated axons, the number of C-fibres, cross-sectional nerve areas, density of myelinated axons, density of C-fibres, total microtubule densities in myelinated axons and C-fibres, circular microtubule densities in myelinated axons, oblique microtubule densities in myelinated axons, total number of microtubules in C-fibres, number of circular microtubules in C-fibres and number of oblique microtubules in C-fibres. Fisher’s exact test was used to test the association between the numbers of C-fibres or myelinated axons which contained atypical mitochondria and the treatment received (paclitaxel or vehicle) at each time point (days 7, 27 and 160). Fisher’s exact test was also used to test the association between the proportion of atypical mitochondria of the total number of mitochondria in C-fibres and the treatment received at each of the three time points. Significance was accepted at p < 0.05.
3. Results
3.1. Behavioural abnormalities induced by paclitaxel
As previously described (Polomano et al., 2001), none of the animals treated with paclitaxel showed any signs of ill-health such as alopecia, diarrhoea or weight loss and all gained weight normally. After a short delay period, paclitaxel treatment produced a marked and prolonged mechano-allodynia and mechano-hyperalgesia (Figs. 1A–C). The pain behaviour finally resolved 5 months (day 155) after the first injection of paclitaxel. Paclitaxel also induced cold allodynia, assessed by acetone application, as described (Flatters and Bennett, 2004a). Paclitaxel-induced cold allodynia was significant at day 13 post-initiation of paclitaxel and lasted until day 52 (data not shown). As previously reported (Polomano et al., 2001; Flatters and Bennett, 2004a) we also found that paclitaxel-induced heat hyperalgesia (data not shown), however this hyperalgesia was mild and transient.
3.2. Low magnification analysis
Examination at 725× magnification demonstrated that paclitaxel has no effect on the gross morphology of the saphenous nerve. Examples of the electron photomicrographs taken at this magnification are shown in Figs. 2A and B. Overall, the structure of myelin sheaths and blood capillaries was normal with no sign of degeneration or occlusion of blood flow. The lack of degeneration or regeneration in peripheral sensory nerves following paclitaxel was further confirmed by quantifying the number of myelinated axons and C-fibres following paclitaxel treatment (Figs. 2C and D). There was no significant difference between vehicle-treated and paclitaxel-treated nerves in the total number of myelinated axons or in the total number of C-fibres they contained, at any time point (unpaired t-tests).
The lack of degeneration in paclitaxel-treated animals was further confirmed by examination ofATF3-immuno-reactivity in DRG sections. The majority of (ipsilateral) DRG cells in sciatic nerve-transected animals (n = 3) had ATF3-stained nuclei (89.7% ± 0.1%), as shown in Fig. 3 and described previously (Tsujino et al., 2000). In contrast, paclitaxel-treated animals (n = 8) had a very small population of ATF3-positive cells (0.318% ± 0.08%, Fig. 3). Vehicle-treated animals (n = 4) had a very similar incidence of ATF3-positive cells (0.320% ± 0.11%). A very low level of ATF3-immuno-reactivity in normal animals has been reported previously (Tsujino et al., 2000).
Fig. 3.
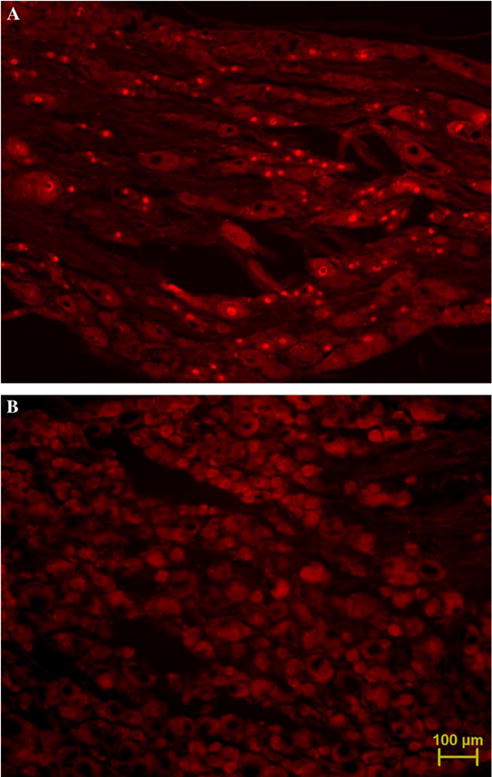
ATF3-immuno-reactivity in nuclei of L4/5 DRG cells. (A) Three days following complete sciatic nerve transection, the majority of cells are ATF3-positive. (B) Day 27 post-paclitaxel initiation, virtually no ATF3-positive cells. Micrographs taken at 10× magnification. Scale bar, 100 μm.
The cross-sectional areas of paclitaxel-treated nerves compared to those of vehicle-treated nerves at days 7, 27 and 160 post-initiation of treatment were not significantly different (Table 1). Thus, paclitaxel did not induce neural oedema at any point during the behavioural time course when compared to the concurrent vehicle-treated group. The absence of paclitaxel-induced neural oedema was also reflected in both the density of myelinated axons and the density of C-fibres, given that these densities were also unaffected by paclitaxel treatment compared to vehicle treatment at each of the time points examined (Table 1).
3.3. C-fibre area
Fig. 4 illustrates the effect of paclitaxel treatment on the cross-sectional area of C-fibres. In paclitaxel-treated nerves, there was a small but significant increase of 18% and 15% in C-fibre area at days 7 and 27 post-initiation of treatment, respectively, compared to vehicle-treated nerves (p < 0.01, unpaired t-tests). There was a small but statistically significant 16% decrease in C-fibre area following paclitaxel compared to vehicle treatment at day 160 post-treatment initiation (p < 0.01, unpaired t-test).
3.4. Microtubules
There was no significant difference in the total microtubule density in myelinated axons at days 7 and 27 following paclitaxel compared to vehicle treatment (Fig. 5A, unpaired t-tests). However, there was a small but statistically significant increase of 17% in the total microtubule density in myelinated axons of paclitaxel-treated nerves compared to vehicle-treated nerves at day 160 post-treatment initiation (Fig. 5A, p < 0.01, unpaired t-test). Compared to vehicle treatment, paclitaxel treatment did not significantly affect the total microtubule density in C-fibres at any of the time points examined (Fig. 5B, unpaired t-tests).
Microtubules normally run parallel to the axon’s long axis; thus in cross-sectioned axons, they appear as circular profiles. Microtubules with atypical orientations would be sectioned obliquely and thus appear as oval profiles. We thus classified microtubules profiles as either ‘‘circular’’ or ‘‘oblique’’. Most microtubules were circular; a vastly smaller population of microtubules was oblique (for examples, see Fig. 6). Both circular and oblique microtubules could be found in myelinated axons and C-fibres of both vehicle-treated and paclitaxel-treated nerves at each of the post-treatment time points.
In myelinated axons, paclitaxel had no effect on the density of circular microtubules at days 7 and 27 post-treatment initiation compared to the vehicle-treated group (Fig. 7A). However, there was a significant increase of 18% in circular microtubule density in the paclitaxel-treated animals at day 160 compared to vehicle-treated animals (Fig. 7A, p < 0.01, unpaired t-test), which is almost certainly a consequence of the increase in the total microtubule density data in myelinated axons at this time point that we noted above. The incidence of oblique microtubules in myelinated axons was far lower than the incidence of circular microtubules with an approximate 20-fold difference (Fig. 7B). Nonetheless, paclitaxel induced significant increases of 20% in oblique microtubule density both at days 7 and 27 time points compared to vehicle (Fig. 7B, p < 0.01, unpaired t-test). There was no difference in oblique microtubule density of myelinated axons at day 160 following the initiation of paclitaxel or vehicle treatment (Fig. 7B).
Fig. 8 illustrates the effect of paclitaxel on the number and nature of microtubules present in C-fibres. Paclitaxel had no effect on the total number of microtubules per C-fibre (Fig. 8A) or on the number of circular microtubules per C-fibre (Fig. 8B) at day 7, 27 or 160 following the initiation of treatment compared to the concurrent vehicle group. As with myelinated axons, there were substantially less (approximately 30-fold) oblique microtubules in C-fibres compared to circular microtubules (Fig. 8C). There was a significant increase and decrease in oblique microtubules in C-fibres of paclitaxel- treated nerves at day 27 and day 160 time points, respectively, compared to vehicle-treated nerves (Fig. 8C, p < 0.05, unpaired t-tests). The population of oblique microtubules in C-fibres is tiny, so although the paclitaxel-induced changes were statistically significant they reflect an average increase of 0.17 oblique microtubules per C-fibre at day 27 and a decrease of 0.23 oblique microtubules per C-fibre at day 160.
3.5. Mitochondria
Normal and atypical (swollen and vacuolated) mitochondria were observed in both C-fibres and myelinated axons of paclitaxel-treated nerves, as illustrated in the electron photomicrographs of Figs. 9 and 10. The occurrence of atypical mitochondria is not specific to paclitaxel treatment as atypical mitochondria were also observed in C-fibres and myelinated axons of vehicle-treated nerves (see Fig. 11). However, paclitaxel treatment significantly increased the prevalence of atypical mitochondria in C-fibres and myelinated axons in relation to the time course of pain behaviour (Fig. 11). There was a 1.7-fold (64%) and a 2.3-fold (128%) significant increase in the prevalence of atypical mitochondria in C-fibres of paclitaxel-treated nerves compared to vehicle-treated nerves at days 7 and 27, respectively, following initiation of treatment (Fig. 11A, p < 0.01, Fisher’s exact test). In contrast, at day 160 post-treatment initiation, there was no significant difference in the prevalence of atypical mitochondria in C-fibres of paclitaxel-treated nerves compared to vehicle-treated nerves. As all the C-fibres sampled were photographed in their entirety at 44,400×, it was possible to examine the proportion of the mitochondria population (i.e., the mitochondria that were present in the plane of section) that were atypical. At day 7 post-treatment initiation, the proportion of mitochondria that were atypical in C-fibres was 48.2% ± 5.7% in paclitaxel-treated nerves compared to 28% ± 1% in vehicle-treated nerves; a significant 72% increase (p < 0.01, Fisher’s exact test). At day 27 post-treatment initiation, there was a significant 67% increase in the proportion of atypical mitochondria in C-fibres (p < 0.01, Fisher’s exact test): 49.5% ± 4.5% of mitochondria were atypical in paclitaxel-treated nerves compared to 29.7% ± 7.6% in vehicle-treated nerves. There was no significant increase in the proportion of atypical mitochondria in C-fibres at day 160 post-treatment initiation: 40.3% ± 1.6% of mitochondria were atypical in paclitaxel-treated nerves compared to 39.6% ± 0.1% in vehicle-treated nerves.
Paclitaxel also affected mitochondria in myelinated axons (Fig. 11B). There was a 2.4-fold (137%) and a 2.6-fold (159%) significant increase in the prevalence of atypical mitochondria in myelinated axons of paclitaxel-treated nerves compared to vehicle-treated nerves at days 7 and 27, respectively, following initiation of treatment (Fig. 11B; p < 0.01, Fisher’s exact test). As seen in C-fibres there was no significant difference in the prevalence of atypical mitochondria in myelinated axons of paclitaxel-treated nerves compared to vehicle-treated nerves at day 160 post-treatment initiation.
4. Discussion
We have examined peripheral sensory nerve structure to search for potential pathology responsible for paclitaxel-induced painful peripheral neuropathy. We examined nerves at three key points in the behavioural time course: (a) day 7, 24 h after the last injection of paclitaxel – prior to the emergence of pain, (b) day 27 post-paclitaxel initiation – at the peak of pain behaviour, and (c) day 160 post-paclitaxel initiation – at the resolution of pain behaviour. Our results do not support the hypotheses that paclitaxel-induced painful peripheral neuropathy is related to axonal degeneration or to disruption of the axonal cytoskeleton that might impair axonal transport. Instead, our observations suggest that paclitaxel-induced pain results from a marked abnormality of axonal mitochondria.
4.1. Paclitaxel-induced painful neuropathy is not accompanied by peripheral nerve degeneration or oedema
There was no evidence of degeneration or regeneration following paclitaxel treatment as the number/density of myelinated axons and C-fibres was unaffected. In addition, the prevalence of ATF3-positive DRG cells was normal in paclitaxel-treated animals. Other morphological studies have reported differential effects of systemic paclitaxel on neural integrity. Cumulative intraperitoneal doses of 2–18 mg/kg paclitaxel did not cause degeneration in sciatic and sural nerves (Campana et al., 1998; Polomano et al., 2001). In contrast, cumulative intravenous doses of 25–125 mg/kg paclitaxel (Cavaletti et al., 1997; Cliffer et al., 1998) and cumulative intraperitoneal doses of 8–80 mg/kg paclitaxel (Cavaletti et al., 1995; Authier et al., 2000) produced various degrees of degeneration in the sciatic nerve, peroneal nerve and dorsal roots. This suggests that the incidence of degeneration increases with the dose of paclitaxel administered. Recently, a decrease in intraepidermal nerve fibre density was reported following a cumulative intravenous dose of 25 mg/kg (Lauria et al., 2005). A dose this large would be expected to produce axonal degeneration in the sciatic nerve and dorsal root (Cavaletti et al., 1997; Cliffer et al., 1998), and this would be consistent with the abnormal nerve conduction studies reported by Lauria et al. (2005) and others (e.g., Cliffer et al., 1998).
We did not detect endoneurial oedema, but we found changes in C-fibre cross-sectional area following paclitaxel treatment. Small significant increases (15–18%) were seen at days 7 and 27 post-paclitaxel initiation. An increase, of similar magnitude (21%), in C-fibre cross-sectional area was also seen in saphenous nerves of vincristine-treated rats (Tanner et al., 1998). In contrast, at day 160 post-paclitaxel initiation, there was a small significant decrease in C-fibre cross-sectional area of paclitaxel-treated nerves. The effect of changes in C-fibre cross-sectional area on nociceptive transmission from the periphery remains to be elucidated.
4.2. Paclitaxel does not markedly alter microtubules in myelinated axons and C-fibres
With one exception, at day 160 in myelinated axons, total microtubule densities were unaffected by paclitaxel both in C-fibres and myelinated axons, despite changes in C-fibre cross-sectional areas. The total number of microtubules per C-fibre were also unaffected by paclitaxel treatment. Vincristine produced significant decreases of 19% and 23% in total microtubule densities of C-fibres and myelinated axons, respectively, which was accompanied by increases in the cross-sectional area of C-fibres and myelinated axons (Tanner et al., 1998; Topp et al., 2000). As seen with the total microtubule data, paclitaxel only affected the circular microtubule population at day 160 in myelinated axons, where their density was increased. In comparison, vincristine decreased the number of circular microtubules when quantified in number per axon for myelinated axons and C-fibres. The reason for these differential effects on microtubules induced by paclitaxel and vincristine is unknown.
Vincristine induced increases in the oblique microtubule population of myelinated axons and, to a lesser extent, that of C-fibres (Tanner et al., 1998; Topp et al., 2000). We also found increases in the incidence of oblique microtubules in myelinated axons and C-fibres during paclitaxel-induced pain; although circular microtubules were still far more common (20- to 30-fold). The increased incidence of oblique microtubules is not the expected effect of paclitaxel, which promotes β-tubulin polymerization, nor of vincristine, which inhibits its polymerization. The promotion of microtubule polymerization could be expected to increase the number or density of microtubules or to cause microtubules to cluster together; neither of which occurred in myelinated axons or C-fibres of paclitaxel-treated nerves. The inhibition of polymerization with vincristine could be expected to decrease the number of all microtubules. We postulate that oblique microtubules arise from distortion of the cytoskeletal framework by swollen mitochondria (discussed below). This is supported by the observation that paclitaxel induced a significant increase in both atypical mitochondria and oblique microtubules in myelinated axons at days 7 and 27 post-treatment initiation, but had no effect on either at day 160.
4.3. Paclitaxel increases the prevalence of atypical mitochondria in C-fibres and myelinated axons
The most striking finding of this study was the increased prevalence of atypical mitochondria in C-fibres and myelinated axons following paclitaxel treatment. Moreover, these increases were evident at days 7 and 27, 24 h after the last injection of paclitaxel and at peak of mechanical hypersensitivity, but not at day 160 when the pain behaviour had resolved. The increased prevalence of atypical mitochondria at day 7 post-treatment initiation, prior to the appearance of mechanical hypersensitivity, suggests that the functional consequence of atypical mitochondria on pain behaviour evolves over time. Thus, the cumulative impact of mitochondrial dysfunction might explain the distinct delay that we see between the termination of paclitaxel administration (day 6) and the peak of pain behaviour (day 27, Fig. 1).
It seems extremely unlikely that atypical mitochondria result from inadequate fixation because their double membrane and nearby ultrastructure, i.e., microtubules, are well preserved (see Figs. 9B–D and 10A–D). Alternatively, it is probable that the structure of atypical mitochondria either accurately reflects their structure in vivo or is the result of an interaction between the fixative and the physiological state of the mitochondria. The latter possibility is supported by previous observations that showed an increased prevalence of swollen mitochondria in electrically stimulated axonal terminals in tissue preserved with 3% glutaraldehyde compared to tissue preserved by rapid-freezing (Brewer and Lynch, 1986). A low incidence of swollen axonal mitochondria is a common observation in tissue from normal animals that have been adequately fixed with aldehydes (e.g., Brewer and Lynch, 1986). The significant finding in the present work is the clearly increased prevalence of such mitochondria following paclitaxel treatment.
We suggest that the increased prevalence of atypical mitochondria is due to a direct action of paclitaxel on the mitochondrial membrane. Paclitaxel is known to alter both mitochondrial function and structure. Paclitaxel evokes calcium release from mitochondria in Ehrlich ascites tumour cells (Evtodienko et al., 1996) and pancreatic acinar cells (Kidd et al., 2002). This calcium release occurs via the opening of the mitochondrial permeability transition pore (mPTP), as the mPTP blocker–cyclosporin A, blocks paclitaxel-evoked calcium efflux (Evtodienko et al., 1996; Kidd et al., 2002). β-tubulin is specifically associated with the mPTP (Carre et al., 2002), thus providing a paclitaxel binding site on mitochondria. The morphological consequence of mPTP opening is mitochondrial swelling. Paclitaxel-induced, cyclosporin A-reversible, mitochondrial swelling has been shown in rat liver, kidney, heart and brain mitochondria (Varbiro et al., 2001) and in human neuroblastoma cells (Andre et al., 2000). Thus, paclitaxel-induced swelling of mitochondria is not a tissue-specific event, suggesting that this could also occur in peripheral sensory axons.
We hypothesize that paclitaxel binds to axonal mitochondria causing mPTPs to open and release intracellular calcium. Perhaps such an increase in intracellular calcium promotes neuronal hyperexcitability resulting in pain behaviour. In vivo recordings have revealed spontaneous activity in peripheral nociceptive fibres of paclitaxel-treated rats (Xiao and Bennett, 2005) and calcium-chelating agents inhibited paclitaxel-induced pain (Siau and Bennett, 2005). Such observations could be related to paclitaxel-induced mitochondrial dysfunction. Ours is not the first report linking mitochondrial pathology and pain. Swollen and vacuolated mitochondria have been observed in the nerves of patients with painful peripheral neuropathy induced by 2′3′-dideoxycytidine (Dalakas et al., 2001). Thallium salts also produce a painful neuropathy and vacuolated mitochondria in peripheral nerves (Spencer et al., 1973).
5. Conclusions
Our data indicate that paclitaxel-induced pain is not associated with axonal degeneration. However, we cannot exclude the possibility that paclitaxel causes degeneration of the distal-most sensory receptors. If such degeneration occurs, then it is insufficient to activate ATF3 in the DRG. Our data also indicate that paclitaxel-induced pain is not associated with an abnormality of axonal microtubules. Instead, our data suggest that paclitaxel induces an abnormality in axonal mitochondria. The stocking-glove distribution of paclitaxel-induced pain (Dougherty et al., 2004) suggests a length-dependent component to this neuropathy. The nerves innervating the fingers and toes are the longest in the body and almost certainly contain the largest number of mitochondria; it is thus possible that long nerves are particularly vulnerable to the paclitaxel–mitochondria interactions described above. Our observation of mitochondrial abnormality associated with pain in the absence of axonal degeneration suggests a link between pain and impaired axonal physiology. Thus, the pain syndrome may be an early sign of neurotoxicity and the axonal degeneration seen with higher doses of paclitaxel may be a consequence of an increase in the severity of the mitochondrial injury reported here.
Acknowledgments
This work was supported by the National Institutes of Health (R01-NS36834) and the Canada Foundation for Innovation. S.J.L.F. was supported by the Ronald Melzack Pain Research Fellowship provided by the Louise Edwards Foundation. G.J.B. is a Canada Senior Research Chair. We thank Lina Naso, Johanne Ouellette and Manon St-Louis for their technical advice and assistance.
References
- Andre N, Braguer D, Brasseur G, Goncalves A, Lemesle-Meunier D, Guise S, et al. Paclitaxel induces release of cytochrome c from mitochondria isolated from human neuroblastoma cells. Cancer Res. 2000;60:5349–53. [PubMed] [Google Scholar]
- Authier N, Gillet JP, Fialip J, Eschalier A, Coudore F. Description of a short-term Taxol-induced nociceptive neuropathy in rats. Brain Res. 2000;887:239–49. doi: 10.1016/s0006-8993(00)02910-3. [DOI] [PubMed] [Google Scholar]
- Brewer PA, Lynch K. Stimulation-associated changes in frog neuro-muscular junctions. A quantitative ultrastructural comparison of rapid-frozen, chemically fixed nerve terminals. Neuroscience. 1986;17:881–95. doi: 10.1016/0306-4522(86)90052-7. [DOI] [PubMed] [Google Scholar]
- Campana WM, Eskeland N, Calcutt NA, Misasi R, Myers RR, O’Brien JS. Prosaptide prevents paclitaxel neurotoxicity. Neurotoxicology. 1998;19:237–44. [PubMed] [Google Scholar]
- Carre M, Andre N, Carles G, Borghi H, Brichese L, Briand C, et al. Tubulin is an inherent component of mitochondrial membranes that interacts with the voltage-dependent anion channel. J Biol Chem. 2002;277:33664–9. doi: 10.1074/jbc.M203834200. [DOI] [PubMed] [Google Scholar]
- Cavaletti G, Cavalletti E, Montaguti P, Oggioni N, De Negri O, Tredici G. Effect on the peripheral nervous system of the short-term intravenous administration of paclitaxel in the rat. Neurotoxicology. 1997;18:137–45. [PubMed] [Google Scholar]
- Cavaletti G, Tredici G, Braga M, Tazzari S. Experimental peripheral neuropathy induced in adult rats by repeated intraperitoneal administration of taxol. Exp Neurol. 1995;133:64–72. doi: 10.1006/exnr.1995.1008. [DOI] [PubMed] [Google Scholar]
- Cliffer KD, Siuciak JA, Carson SR, Radley HE, Park JS, Lewis DR, et al. Physiological characterization of Taxol-induced large-fiber sensory neuropathy in the rat. Ann Neurol. 1998;43:46–55. doi: 10.1002/ana.410430111. [DOI] [PubMed] [Google Scholar]
- Dalakas MC, Semino-Mora C, Leon-Monzon M. Mitochondrial alterations with mitochondrial DNA depletion in the nerves of AIDS patients with peripheral neuropathy induced by 2′3′-dideoxycytidine (ddC) Lab Invest. 2001;81:1537–44. doi: 10.1038/labinvest.3780367. [DOI] [PubMed] [Google Scholar]
- Dougherty PM, Cata JP, Cordella JV, Burton A, Weng HR. Taxolinduced sensory disturbance is characterized by preferential impairment of myelinated fiber function in cancer patients. Pain. 2004;109:132–42. doi: 10.1016/j.pain.2004.01.021. [DOI] [PubMed] [Google Scholar]
- Evtodienko YV, Teplova VV, Sidash SS, Ichas F, Mazat JP. Microtubule-active drugs suppress the closure of the permeability transition pore in tumour mitochondria. FEBS Lett. 1996;393:86–8. doi: 10.1016/0014-5793(96)00875-7. [DOI] [PubMed] [Google Scholar]
- Flatters SJL, Bennett GJ. Ethosuximide reverses paclitaxel- and vincristine-induced painful peripheral neuropathy. Pain. 2004a;109:150–61. doi: 10.1016/j.pain.2004.01.029. [DOI] [PubMed] [Google Scholar]
- Flatters SJL, Bennett GJ. Paclitaxel-induced painful peripheral neuropathy: the search for pathophysiology. Society of Neurosci Abstracts. 2004b:982.2. [Google Scholar]
- Forsyth PA, Balmaceda C, Peterson K, Seidman AD, Brasher P, DeAngelis LM. Prospective study of paclitaxel-induced peripheral neuropathy with quantitative sensory testing. J Neurooncol. 1997;35:47–53. doi: 10.1023/a:1005805907311. [DOI] [PubMed] [Google Scholar]
- Jordan MA, Wendell K, Gardiner S, Derry WB, Copp H, Wilson L. Mitotic block induced in HeLa cells by low concentrations of paclitaxel (Taxol) results in abnormal mitotic exit and apoptotic cell death. Cancer Res. 1996;56:816–25. [PubMed] [Google Scholar]
- Kelling J, Sullivan K, Wilson L, Jordan MA. Suppression of centromere dynamics by Taxol in living osteosarcoma cells. Cancer Res. 2003;63:2794–801. [PubMed] [Google Scholar]
- Kidd JF, Pilkington MF, Schell MJ, Fogarty KE, Skepper JN, Taylor CW, et al. Paclitaxel affects cytosolic calcium signals by opening the mitochondrial permeability transition pore. J Biol Chem. 2002;277:6504–10. doi: 10.1074/jbc.M106802200. [DOI] [PubMed] [Google Scholar]
- Kumar N. Taxol-induced polymerization of purified tubulin. Mechanism of action. J Biol Chem. 1981;256:10435–41. [PubMed] [Google Scholar]
- Lauria G, Lombardi R, Borgna M, Penza P, Bianchi R, Savino C, et al. Intraepidermal nerve fiber density in rat foot pad neuropathologic –neurophysiologic correlation. J Peripher Nerv Syst. 2005;10:202–8. doi: 10.1111/j.1085-9489.2005.0010210.x. [DOI] [PubMed] [Google Scholar]
- Lipton RB, Apfel SC, Dutcher JP, Rosenberg R, Kaplan J, Berger A, et al. Taxol produces a predominantly sensory neuropathy. Neurology. 1989;39:368–73. doi: 10.1212/wnl.39.3.368. [DOI] [PubMed] [Google Scholar]
- Nogales E, Wolf SG, Khan IA, Luduena RF, Downing KH. Structure of tubulin at 6.5 A¢ª and location of the taxol-binding site. Nature. 1995;375:424–7. doi: 10.1038/375424a0. [DOI] [PubMed] [Google Scholar]
- Polomano RC, Mannes AJ, Clark US, Bennett GJ. A painful peripheral neuropathy in the rat produced by the chemotherapeutic drug, paclitaxel. Pain. 2001;94:293–304. doi: 10.1016/S0304-3959(01)00363-3. [DOI] [PubMed] [Google Scholar]
- Postma TJ, Vermorken JB, Liefting AJ, Pinedo HM, Heimans JJ. Paclitaxel-induced neuropathy. Ann Oncol. 1995;6:489–94. doi: 10.1093/oxfordjournals.annonc.a059220. [DOI] [PubMed] [Google Scholar]
- Rowinsky EK, Eisenhauer EA, Chaudhry V, Arbuck SG, Donehower RC. Clinical toxicities encountered with paclitaxel (Taxol) Semin Oncol. 1993;20:1–15. [PubMed] [Google Scholar]
- Roytta M, Horwitz SB, Raine CS. Taxol-induced neuropathy: short-term effects of local injection. J Neurocytol. 1984;13:685–701. doi: 10.1007/BF01148489. [DOI] [PubMed] [Google Scholar]
- Roytta M, Raine CS. Taxol-induced neuropathy: further ultrastructural studies of nerve fibre changes in situ. J Neurocytol. 1985;14:157–75. doi: 10.1007/BF01150269. [DOI] [PubMed] [Google Scholar]
- Roytta M, Raine CS. Taxol-induced neuropathy: chronic effects of local injection. J Neurocytol. 1986;15:483–96. doi: 10.1007/BF01611731. [DOI] [PubMed] [Google Scholar]
- Siau C, Bennett GJ. Dysregulation of cellular calcium homeostasis in chemotherapy-evoked painful peripheral neuropathy. Anesth Analg. doi: 10.1213/01.ane.0000204318.35194.ed. in press. [DOI] [PMC free article] [PubMed] [Google Scholar]
- Spencer PS, Peterson ER, Madrid R, Raine CS. Effects of thallium salts on neuronal mitochondria in organotypic cord–ganglia– muscle combination cultures. J Cell Biol. 1973;58:79–95. doi: 10.1083/jcb.58.1.79. [DOI] [PMC free article] [PubMed] [Google Scholar]
- Tanner KD, Levine JD, Topp KS. Microtubule disorientation and axonal swelling in unmyelinated sensory axons during vincristine-induced painful neuropathy in rat. J Comp Neurol. 1998;395:481–92. [PubMed] [Google Scholar]
- Topp KS, Tanner KD, Levine JD. Damage to the cytoskeleton of large diameter sensory neurons and myelinated axons in vincristine-induced painful peripheral neuropathy in the rat. J Comp Neurol. 2000;424:563–76. [PubMed] [Google Scholar]
- Tsujino H, Kondo E, Fukuoka T, Dai Y, Tokunaga A, et al. Activating transcription factor 3 (ATF3) induction by axotomy in sensory and motoneurons: A novel neuronal marker of nerve injury. Mol Cell Neurosci. 2000;15(2):170–82. doi: 10.1006/mcne.1999.0814. [DOI] [PubMed] [Google Scholar]
- van den Bent MJ, van Raaij-van den Aarssen VJ, Verweij J, Doorn PA, Sillevis Smitt PA. Progression of paclitaxel-induced neuropathy following discontinuation of treatment. Muscle Nerve. 1997;20:750–2. doi: 10.1002/(sici)1097-4598(199706)20:6<750::aid-mus15>3.0.co;2-y. [DOI] [PubMed] [Google Scholar]
- van Gerven JM, Moll JW, van den Bent MJ, Bontenbal M, van der Burg ME, Verweij J, et al. Paclitaxel (Taxol) induces cumulative mild neurotoxicity. Eur J Cancer A. 1994;30:1074–7. doi: 10.1016/0959-8049(94)90459-6. [DOI] [PubMed] [Google Scholar]
- Varbiro G, Veres B, Gallyas F, Jr, Sumegi B. Direct effect of Taxol on free radical formation and mitochondrial permeability transition. Free Radic Biol Med. 2001;31:548–58. doi: 10.1016/s0891-5849(01)00616-5. [DOI] [PubMed] [Google Scholar]
- Wani MC, Taylor HL, Wall ME, Coggon P, McPhail AT. Plant antitumor agents. VI. The isolation and structure of taxol, a novel antileukemic and antitumor agent from Taxus brevifolia. J Am Chem Soc. 1971;93:2325–7. doi: 10.1021/ja00738a045. [DOI] [PubMed] [Google Scholar]
- Xiao WH, Bennett GJ. Spontaneous discharge in primary afferent fibers in paclitaxel-evoked neuropathic pain in the rat. Abstracts: 11th world congress on pain, IASP Press. 2005:426. Abst no. 1180. [Google Scholar]
- Yvon AM, Wadsworth P, Jordan MA. Taxol suppresses dynamics of individual microtubules in living human tumor cells. Mol Biol Cell. 1999;10:947–59. doi: 10.1091/mbc.10.4.947. [DOI] [PMC free article] [PubMed] [Google Scholar]
- Zimmermann M. Ethical guidelines for investigations of experimental pain in conscious animals [editorial] Pain. 1983;16:109–10. doi: 10.1016/0304-3959(83)90201-4. [DOI] [PubMed] [Google Scholar]