

Abstract
We have identified a cytokine of the IL-6 family and named it novel neurotrophin-1/B cell-stimulating factor-3 (NNT-1/BSF-3). NNT-1/BSF-3 cDNA was cloned from activated Jurkat human T cell lymphoma cells. Its sequence predicts a 225-aa protein with a 27-aa signal peptide, a molecular mass of 22 kDa in mature form, and the highest homology to cardiotrophin-1 and ciliary neurotrophic factor. The gene for NNT-1/BSF-3 is on chromosome 11q13. A murine equivalent to NNT-1/BSF-3 also was identified, which shows 96% homology to human NNT-1/BSF-3. NNT-1/BSF-3 mRNA is found mainly in lymph nodes and spleen. NNT-1/BSF-3 induces tyrosine phosphorylation of glycoprotein 130 (gp130), leukemia inhibitory factor receptor β, and signal transducer and activator of transcription 3 in the SK-N-MC human neuroblastoma cells. NNT-1/BSF-3 shows activities typical of IL-6 family members. In vitro, it supports the survival of chicken embryo motor and sympathetic neurons. In mice, it induces serum amyloid A, potentiates the induction by IL-1 of corticosterone and IL-6, and causes body weight loss and B cell hyperplasia with serum IgG and IgM increase. NNT-1/BSF-3 is a gp130 activator with B-cell stimulating capability.
The activation of the signal transducing receptor molecule glycoprotein 130 (gp130) distinguishes a group of cytokines referred to as the IL-6 family (1–3). IL-6, IL-11, leukemia inhibitory factor (LIF), oncostatin M (OM), ciliary neurotrophic factor (CNTF), and cardiotrophin-1 (CT-1) are the gp130 activators currently known (2, 3).
In addition to gp130 usage, IL-6 family members share a number of similarities at various levels (2, 3). They all show the conserved location of one intron in their gene structure (4) and, in common with cytokines of the hematopoietin superfamily, the presence of a four-helix bundle in their protein structure (5, 6). Along with gp130, LIF, OM, CNTF, and CT-1 make use of LIF-receptor β (LIF-Rβ) as signal transducing receptor molecule (7–10). Thus, whereas IL-6 and IL-11 signaling involves the formation of a gp130 homodimer (11, 12), LIF, OM, CNTF, and CT-1 signaling involves the formation of a gp130/LIF-Rβ heterodimer (9, 10, 13). gp130 homodimers and gp130/LIF-Rβ heterodimers activate the Janus kinase-signal transducer and activator of transcription (STAT) pathway with tyrosine auto-phosphorylation and phosphorylation of STAT3 (3, 14–19).
IL-6 family members also share similarities at the level of functional activity. In vitro, they all induce neuron survival and/or differentiation, and all but IL-11 promote the differentiation of M1 cells into macrophages (3). In vivo, they all induce the acute phase protein serum amyloid A (SAA) and potentiate the elevation of serum levels of corticosterone and IL-6 triggered by IL-1 (20). Furthermore, IL-6, IL-11, LIF, and CNTF cause body weight (BW) loss and/or food intake reduction (21, 22), and IL-6, IL-11, LIF, and OM stimulate hematopoiesis, especially platelet production (23–26). IL-6 has pronounced effects on adaptive immunity (27). Indeed, IL-6 was originally described as a B cell differentiation or stimulating factor (28, 29) and as a hybridoma growth factor (30), promoting the development of B cells and Ab production (27).
We have identified a gp130 activator that, in addition to features typical of IL-6 family cytokines, including neurotropic effects, shows B cell-stimulating capability. We have named it novel neurotrophin-1/B cell stimulating factor-3 (NNT-1/BSF-3) [BSF-1 is IL-4 (31), and BSF-2 is IL-6 (28)].
MATERIALS AND METHODS
Isolation of an NNT-1/BSF-3 cDNA Clone.
A subtraction cDNA library was constructed from activated Jurkat human T-cell lymphoma cells (ATCC TIB 152). After growth at 37°C in 5% CO2 in RPMI 1640 medium [with 10% FCS, glutamine, penicillin, streptomycin, and 10 mM Hepes (pH 7.5); Life Technologies, Rockville, MD], cells to provide “tester” RNA were incubated for 8 hr in presence of staphylococcal enterotoxin B (80 ng/ml; Sigma) and phorbol 12-myristate 13-acetate (50 ng/ml; Sigma), whereas cells to provide “driver” RNA were incubated in medium alone. To construct the library, poly(A) RNA was isolated from both cell groups. Tester RNA was reverse-transcribed, and the ensuing cDNA was hybridized with photobiotinated driver RNA. Biotin-containing hybrids then were removed with streptavidin. The remaining subtracted cDNA was amplified by PCR and size-selected. The library was then screened by expressed sequence tag analysis (32). Individual clones were randomly picked and sequenced on a model 373A automated DNA sequencer by using vector primer and Taq dye-terminator reactions (Applied Biosystems) according to manufacturer’s instructions. The resulting nucleotide sequences were translated, compared with the existing database of known proteins by using the blastp program (33), and analyzed for predictions of secondary structure folding by using a nearest neighbor secondary structure prediction algorithm (34).
Isolation of an NNT-1/BSF-3 Genomic Clone.
The genomic P1 library (Genome Systems, St. Louis) was screened by using a probe prepared from the NNT-1/BSF-3 cDNA. Two positive clones were identified. The plasmid DNA containing one of these clones was purified and sequenced as above to determine exons and introns.
Isolation of a Murine NNT-1/BSF-3 cDNA Clone.
A partial murine cDNA clone was isolated by PCR amplification from mouse embryo cDNA (CLONTECH) by using the human-specific primers. The full-length cDNA clone then was obtained by 5′ and 3′ RACE (rapid amplification of cDNA end), sequenced, and translated as above.
Size Assessment and Tissue Localization of NNT-1/BSF-3 mRNA.
The size and distribution in human tissues of NNT-1/BSF-3 transcripts were assessed by Northern blot analysis. Northern blots of human tissues (CLONTECH) were analyzed by using a probe prepared from the NNT-1/BSF-3 cDNA. NNT-1/BSF-3 mRNA was quantified in mouse tissues relative to cyclophylin mRNA by RNase protection assay. In brief, total RNA was extracted from various mouse tissues by using the RNA STAT60 solution (Tel-Test, Friendswood, TX) and following manufacturer’s instructions. A riboprobe for NNT-1/BSF-3 mRNA was prepared by using an NNT-1/BSF-3 cDNA fragment as a template, and a riboprobe for murine cyclophilin mRNA was obtained from Ambion (Austin, TX). The RNase protection assay was performed by using 10 μg of tissue-extracted RNA and the RPA II kit (Ambion). After precipitation, washing, and PAGE separation of the RNase-protected RNA, riboprobes were visualized and quantified with a PhosphorImager and the imagequant program (Molecular Dynamics), and the NNT-1/BSF-3 mRNA to cyclophilin mRNA ratios were calculated.
Expression of NNT-1/BSF-3 as a Recombinant Protein.
A cDNA clone coding for the NNT-1/BSF-3 sequence from Leu (28) to Phe (225) was inserted into appropriate vector. Host cells (Escherichia coli K12, strain CGSC 6159, Yale University Genetic Stock, New Haven, CT) were transformed with the vector and grown at 30°C in 2× YT medium containing kanamycin (Difco, Detroit, MI). The protein was found mostly in the inclusion bodies and purified by sequential precipitation and refolding. Before use in vitro or in vivo, all preparations of NNT-1/BSF-3 were checked for the presence of endotoxin and always found to contain <4.4 EU/mg of protein.
Identification of NNT-1/BSF-3 Signal Transducers.
SK-N-MC human neuroblastoma cells (ATCC HTB 10) were grown at 37°C in 5% CO2 in minimal essential medium (with 10% FCS, glutamine, nonessential amino acids, penicillin, and streptomycin; Life Technologies). After washing and incubation in serum-free medium for 1 hr, cells were treated for 5 min with 100 ng/ml of NNT-1/BSF-3 or human recombinant LIF (Amgen) or NNT-1/BSF-3 buffer as a control. Cells then were lysed in PBS containing 1% NP-40 with protease inhibitors and orthovanadate. Tyrosine phosphorylated proteins were recovered with an antiphosphotyrosine Ab (Upstate Biotechnology, Lake Placid, NY) and protein-A agarose (Calbiochem) and separated by SDS/PAGE. Gels then were blotted and probed with either anti-gp130 or anti-LIF-Rβ or anti-STAT3 mAbs (Santa Cruz Biotechnology). Blots were developed with a peroxidase-conjugated rabbit anti-mouse antibody by enhanced chemiluminescence using a commercially available kit (Amersham Pharmacia).
Support of Chicken Embryo Neuron Survival.
Motor and sympathetic neurons were isolated from chicken embryos, resuspended in L15 medium (with 10% FCS, glucose, sodium selenite, progesterone, conalbumin, putrescine, and insulin; Life Technologies) and Dulbecco’s modified Eagles medium [with 10% FCS, glutamine, penicillin, and 25 mM Hepes (pH 7.2); Life Technologies], respectively, and incubated at 37°C in 5% CO2 in presence of different concentrations of NNT-1/BSF-3 or human recombinant CNTF (Amgen). After 3 days, neuron survival was determined by evaluation of cellular morphology and by using the colorimetric assay of Mosmann (35).
Induction of M1 Myeloid Leukemia Cell Growth.
M1 murine myeloid leukemia cells (ATCC TIB 192) were incubated at 37°C in 5% CO2 in RPMI 1640 medium (with 10% FCS, glutamine, penicillin, and streptomycin; Life Technologies) in the presence of different concentrations of NNT-1/BSF-3 or human recombinant LIF (Amgen) or NNT-1/BSF-3 buffer as a control. After 7 days, cell growth was determined by using the colorimetric assay above (35).
Induction of Serum SAA and Liver SAA mRNA and Potentiation of Corticosterone and IL-6 Induction by IL-1.
Mice (BALB/c females of 9–11 wk and 19–21 g), obtained from Charles River Breeding Laboratories, fed with standard laboratory diet and water ad libitum, and housed in rooms at constant temperature and humidity under 12-hr light/dark cycles) were given 5 mg/kg of NNT-1/BSF-3 i.v., alone or with human recombinant IL-1β (100 ng/mouse; Amgen). Control mice received NNT-1/BSF-3 buffer. Blood was taken 8 hr after the injection of NNT-1/BSF-3 for the determination of SAA and 2 hr after for those of corticosterone and IL-6. Livers for SAA mRNA determination were also taken 8 hr after the injection of NNT-1/BSF-3, snap-frozen in liquid nitrogen, and stored at −80°C.
Change in BW, Lymphoid Organs, and Serum IgG and IgM.
Mice (as above) received for 7 consecutive days a daily i.p. injection of 5 mg/kg of NNT-1/BSF-3 or control buffer at 9 a.m. BW was daily recorded at 9 a.m. before treatment and 24 hr after the seventh injection, when mice were sacrificed to collect organs (brain, thymus, heart, lungs, kidneys, adrenals, bladder, ileum, colon, liver, pancreas, femur, spleen and lymph nodes) for histological examination and peripheral blood and lymph nodes for cell counts.
Determinations of Serum Analytes and Liver SAA mRNA.
SAA and IL-6 were measured in serum by ELISA by using commercially available kits (BioSource International, Camarillo, CA), and corticosterone was measured by RIA with a commercially available kit (ICN). Serum IgG and IgM were measured with a turbidimetric assay by using specific antisera in a Hitachi 717 chemistry analyzer (Boehringer Mannheim) and following the manufacturer’s instructions. Liver SAA mRNA was measured by RNase protection assay relative to 18S RNA. Livers were homogenized, and total RNA was extracted as above. Riboprobes for murine SAA mRNA and 18S RNA were prepared by transcribing cloned DNA templates. The RNase protection assay was performed by using 50 μg of liver-extracted RNA and the RPA II kit (Ambion). After processing of the RNase-protected RNA and visualization and quantification of the riboprobes as above, the SAA mRNA to 18S RNA ratios were calculated.
Histological Examination and Peripheral Blood and Lymph Node Cell Counts.
Organs were fixed in formalin, embedded in paraffin, and stained with hematoxylin and eosin. Lymph nodes were disrupted to yield a cell suspension. Peripheral blood and lymph node cells were counted with a H1E cell counter (Technicon, Tarrytown, NY). Percentages of lymph node cells were derived by direct immunofluorescence double staining and flow cytometry by using anti-CD3 and anti-CD45R (B220) monoclonal antibodies (PharMingen) and a FACScan analyser (Becton Dickinson).
Statistical Analysis.
Results are expressed as mean ± SD. Differences between groups were analyzed by the Student’s t test. Because BW was repeatedly measured in each individual, differences in BW change within and between groups were tested by the ANOVE for repeated measures.
RESULTS
Identification of NNT-1/BSF-3.
A subtraction cDNA library was prepared from activated Jurkat cells with the purpose of identifying new human proteins specifically expressed in activated T cells. These proteins may be able to modulate the immune response and thus prove useful to treat immune-mediated disorders. One clone randomly picked from this library was found to represent a full-length cDNA containing 5′ and 3′ end codons and to encode a protein that we named NNT-1/BSF-3 (Fig. 1). NNT-1/BSF-3 appears to be a 225-aa protein with a conventional signal peptide spanning from amino acid 1 (Met) to amino acid 27 (Ala). In mature form NNT-1/BSF-3 is predicted to be a 198-aa peptide of 22 kDa. Cleavage of the signal peptide was verified by N-terminal amino acid analysis of the mature protein recombinantly expressed in human embryonic kidney 293 cells (data not shown). NNT-1/BSF-3 contains four cysteine residues, two of which are in the signal peptide. NNT-1/BSF-3 has one potential N-linked glycosylation site located at amino acid 29 (Asn), i.e., amino acid 2 of the mature protein. NNT-1/BSF-3 has the highest homology to CT-1 (28% for rat and mouse CT-1) and CNTF (28% for chicken CNTF). As to the human peptides of the IL-6 family, NNT-1/BSF-3 has 27% homology for CT-1, 24% for IL-11, 23% for CNTF, 21% for LIF, and 19% for both IL-6 and OM. NNT-1/BSF-3 secondary structure is predicted to contain α-helices.
Figure 1.

Nucleotide sequence of NNT-1/BSF-3 cDNA and predicted amino acid sequence. The first 27 aa define a signal peptide and are underlined. Triangles indicate the locations of the introns. Cysteines are in bold type. Position 29 (Asn) is a potential N-glysosylation site and is indicated by an asterisk.
Structure of NNT-1/BSF-3 Gene.
An NNT-1/BSF-3 genomic clone was isolated from a genomic P1 library, revealing that the gene for NNT-1/BSF-3 consists of three exons and two introns. The sequences of the exon-intron junctions conform to the consensus sequence of eukaryotic splice junctions (Fig. 2). The first two exons in the NNT-1/BSF-3 gene encode 5 and 56 aa, respectively (Figs. 1 and 2). The gene for NNT-1/BSF-3 was located on chromosome 11q13 by fluorescence in situ hybridization of diamidinophenylindole-banded chromosomes (data not shown).
Figure 2.

Structure of the NNT-1/BSF-3 gene. Exon sequences are shown in uppercase letters, and intron sequences in lowercase letters. The length of each intron is shown in parenthesis.
Identification of Murine NNT-1/BSF-3.
A mouse NNT-1/BSF-3 cDNA clone was isolated from mouse embryo cDNA by PCR amplification. Mouse NNT-1/BSF-3 is highly homologous (96%) to human NNT-1/BSF-3. Like human NNT-1/BSF-3, mouse NNT-1/BSF-3 is a 225-aa protein with a 27-aa signal peptide and one potential N-linked glycosylation site at amino acid 29 (Asn).
Size and Tissue Localization of NNT-1/BSF-3 mRNA.
Probing Northern blots of human tissues indicated that the NNT-1/BSF-3 gene is expressed as a 2.2-kb transcript chiefly in lymph nodes, spleen, peripheral blood lymphocytes, bone marrow, and fetal liver. NNT-1/BSF-3 mRNA was also identified by RNase protection assay in various mouse tissues. The presence of NNT-1/BSF-3 mRNA, relative to the one of cyclophilin mRNA, was the strongest in lymph nodes, spleen, liver, lung, uterus, and ovary (Fig. 3).
Figure 3.

Localization of NNT-1/BSF-3 mRNA in mouse tissues by RNase protection assay. Histograms indicate the NNT-1/BSF-3 mRNA to cyclophilin mRNA ratios for each tissue.
Identification of NNT-1/BSF-3 Signal Transducers.
Probing Western blots of precipitates recovered with an antiphosphotyrosine Ab from NNT-1/BSF-3-treated SK-N-MC human neuroblastoma cells revealed that on exposure to NNT-1/BSF-3 tyrosine phosphorylation of gp130, LIF-Rβ, and STAT3 occurs in these cells (Fig. 4). The same phenomenon occurs on exposure to LIF, but not to NNT-1/BSF-3 buffer as a control (Fig. 4).
Figure 4.
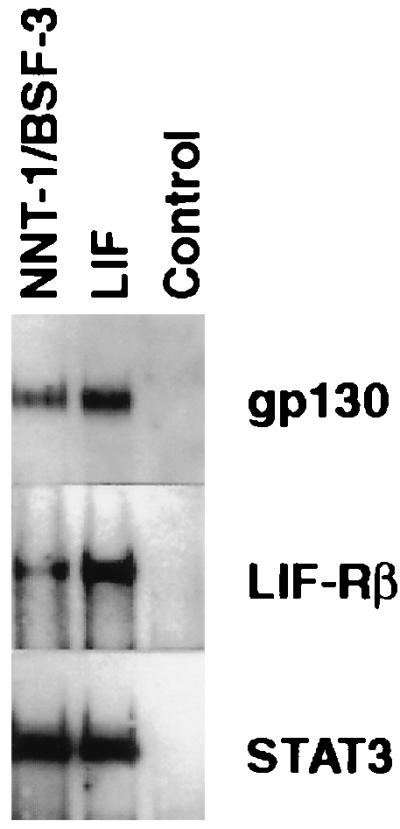
Phosphorylation of gp130, LIF-Rβ, and STAT3 induced by NNT-1/BSF-3. Western blot of immunoprecipitates recovered with an antiphosphotyrosine Ab from SK-N-MC human neuroblastoma cells exposed in culture to NNT-1/BSF-3 or LIF or NNT-1/BSF-3 buffer as a control were probed with anti-gp130, anti-LIF-Rβ, and anti-STAT3 Abs. This experiment was done twice with similar results.
Support of Neuron Survival.
Chicken embryo motor and sympathetic neurons rapidly die in culture. NNT-1/BSF-3 supports the survival of both types of neurons in a dose-dependent fashion, although less potently than CNTF (Fig. 5). NNT-1/BSF-3 shows minimal efficacy at concentrations between 0.1 and 1 ng/ml and maximal at concentrations between 10 and 100 ng/ml.
Figure 5.

Neuron survival supported by NNT-1/BSF-3. Chicken embryo motor (A) and sympathetic (B) neurons were exposed in culture for 3 days to a concentration range of NNT-1/BSF-3 or CNTF. The horizontal line in A indicates the survival of motor neurons exposed to NNT-1/BSF-3 buffer as a control. Sympathetic neurons exposed to NNT-1/BSF-3 buffer do not survive and therefore do not generate OD. OD values given by NNT-1/BSF-3 concentrations above 0.1 ng/ml or by CNTF concentrations above 0.01 ng/ml were higher than those given by NNT-1/BSF-3 buffer (n = 5, P < 0.001). The experiment on motor neurons was done three times and the one on sympathetic neurons twice, with similar results.
Induction of M1 Cell Growth.
NNT-1/BSF-3 induces the growth of M1 murine myeloid leukemia cells in culture (Fig. 6). After 7 days of culture, NNT-1/BSF-3 increases M1 cell growth, whereas LIF decreases it. NNT-1/BSF-3 shows efficacy at a concentration as low as 0.01 ng/ml.
Figure 6.

Growth of M1 murine myeloid leukemia cell exposed in culture for 7 days to a concentration range of NNT-1/BSF-3 or LIF. The horizontal line indicates the growth of M1 cells exposed to NNT-1/BSF-3 buffer as a control. OD values given by NNT-1/BSF-3 concentrations above 10−3 ng/ml were higher than those given by NNT-1/BSF-3 buffer (P < 0.001), whereas OD values given by LIF concentrations ranging between 10−3 and 1 ng/ml were lower (P < 0.001; n = 5). This experiment was done four times with similar results.
Induction of Serum SAA and Liver SAA mRNA and Potentiation of Corticosterone and IL-6 Induction by IL-1.
A single dose of NNT-1/BSF-3 induces a 14-fold increase in the circulating levels of SAA (Fig. 7A). The increase in serum SAA was accompanied by an increase in SAA mRNA in the liver (Fig. 7A), although this was less pronounced (2.5 times) than the increase in serum SAA. The increase in liver SAA mRNA, however, was found to be more pronounced (6.4 times) after seven daily doses of NNT-1/BSF-3 (data not shown).
Figure 7.

In vivo effects of NNT-1/BSF-3. (A) Levels of serum SAA and liver SAA mRNA to 18S RNA ratios in mice 8 hr after the injection of 5 mg/kg of NNT-1/BSF-3 or control buffer. Both levels of serum SAA and liver RNA ratios were higher in mice treated with NNT-1/BSF-3 than those treated with control buffer (n = 5, P < 0.03 in both cases). This experiment was done five times with similar results. (B) Levels of serum corticosterone and IL-6 in mice 2 hr after the injection of 5 mg/kg of NNT-1/BSF-3 or control buffer alone or with 100 ng/mouse of IL-1. Levels of both corticosterone and IL-6 were higher in mice treated with NNT-1/BSF-3 and IL-1 than those treated with control buffer and IL-1 (n = 5, P < 0.01 in both cases). Levels of corticosterone were also higher in mice treated with NNT-1/BSF-3 than those treated with control buffer (n = 5, P < 0.001). The experiment on IL-6 was done twice with similar results. (C) BW change during 7 days follow-up in mice treated daily with 5 mg/kg of NNT-1/BSF-3 or control buffer. NNT-1/BSF-3-treated mice showed a loss in BW (P < 0.001), whereas mice treated with control buffer did not show a significant BW change. The BW change in the NNT-1/BSF-3-treated mice was different from that in controls overall (P < 0.001) and on every single day of treatment (P < 0.04 on day 1 and P < 0.001 on the following days; n = 7). This experiment was done five times with similar results.
The administration of NNT-1/BSF-3 potentiates the induction of serum corticosterone by IL-1 (Fig. 7B). Mice that received NNT-1/BSF-3 and IL-1 had corticosterone levels higher than those that received control buffer and IL-1. Moreover, NNT-1/BSF-3 alone strongly induces corticosterone (Fig. 7B). Serum corticosterone in the NNT-1/BSF-3-treated mice was ≈12 times higher than in mice treated with control buffer. The administration of NNT-1/BSF-3 also potentiates the induction of serum IL-6 by IL-1 (Fig. 7B). The coinjection of NNT-1/BSF-3 and IL-1 resulted in IL-6 levels 11 times higher that those observed after the coinjection of control buffer and IL-1. However, the injection of NNT-1/BSF-3 alone does not induce IL-6 in the circulation (Fig. 7B).
Change in BW, Lymphoid Organs, and Serum IgG and IgM.
Treatment with NNT-1/BSF-3 daily for 7 consecutive days resulted in an 8% BW loss, whereas control treatment did not change BW significantly (Fig. 7C). Differences in BW change between NNT-1/BSF-3-treated and control mice were noticeable on the first day of treatment and on all subsequent days (Fig. 7C).
There were important alterations in the secondary lymphoid organs—i.e., lymph nodes, spleen, and Peyer’s patches—from the NNT-1/BSF-3-treated mice but not in the other organs examined. The peripheral blood cell counts were not significantly different between NNT-1/BSF-3-treated mice and controls. The lymph nodes of the NNT-1/BSF-3-treated mice were larger than those of controls and had follicular hyperplasia with prominent secondary follicles and germinal centers (Fig. 8). The total number of white blood cells recovered from the axillary and inguinal lymph nodes of the NNT-1/BSF-3-treated mice was higher than that from controls (5.58 ± 0.71 vs. 4.36 ± 0.29 × 10⁶ cells, n = 5, P < 0.05). In particular, the number of B cells (identified as CD3-negative and CD45R-positive cells) in the lymph nodes of the NNT-1/BSF-3-treated mice was higher than that of controls (1.29 ± 0.12 vs. 0.79 ± 0.16 × 10⁶ cells, n = 5, P < 0.01). Also the white pulp in the spleen of the NNT-1/BSF-3-treated mice and the Peyer’s patches had follicular hyperplasia similar to the lymph nodes. The occasional presence of Russell bodies (enlarged plasma cells containing abundant intracytoplasmic secretory vesicles) was observed in the bone marrow of NNT-1/BSF-3-treated mice, but no other alteration was observed. NNT-1/BSF-3-treated mice showed higher levels of serum IgG (25.4 ± 5.7 vs. 12.3 ± 5.4 mg/dl, n = 7, P < 0.001) and IgM (46.3 ± 4.3 vs. 35.6 ± 3.2 mg/dl, n = 7, P < 0.001) than controls.
Figure 8.

Sections of mesenteric lymph nodes from mice treated daily with 5 mg/kg of NNT-1/BSF-3 (A) or control buffer (B). The lymph nodes from the NNT-1/BSF-3-treated mice were larger than those from controls and had follicular hyperplasia with prominent secondary follicles and germinal centers (arrowheads).
DISCUSSION
This study reports the identification of a novel protein that shows various features typical of cytokines of the IL-6 family. First, this protein makes use of gp130, the distinctive feature of the IL-6 family (1–3). It also activates STAT3, has neurotropic activity, triggers the acute phase response, and potentiates the action of IL-1 on the hypothalamus-pituitary-adrenal axis, all features of the IL-6 family (2, 3, 20). Moreover, in interesting similarity to IL-6 (27), it promotes B cell development and Ab production. We have named this protein NNT-1/BSF-3.
A full-length cDNA coding for the protein was identified while screening by expressed sequence tag analysis a subtraction cDNA library prepared from activated Jurkat human T cell lymphoma cells. The fact that the amino acid sequence deduced from this cDNA shows the highest homology (28%) to CT-1 and CNTF, both cytokines of the IL-6 family (2, 3), led to the hypothesis that this protein also may belong to this family and therefore be of some interest.
NNT-1/BSF-3 primary structure includes a conventional signal peptide, unlike CNTF and CT-1, but similar to IL-6, IL-11, LIF, and OM (4). It also includes predictions of the formation of α-helices in the secondary structure, a hallmark of cytokines of the hematopoietin superfamily, including all gp130 activators (5, 6).
The cumulative size of the first two exons in the NNT-1/BSF-3 gene is similar to that in the genes for IL-6, IL-11, LIF, OM, and CT-1 and to the size of the first exon in the CNTF gene, which is structured on only two exons and one intron (4). Thus, the second intron in the NNT-1/BSF-3 gene occupies the same location conserved throughout the IL-6 family (4). The gene for NNT-1/BSF-3 is localized on chromosome 11q13, in proximity of the gene for CNTF, which is on chromosome 11q12 (36). This result may indicate a close relationship between NNT-1/BSF-3 and CNTF, because the genes for LIF and OM, two closely related gp130 activators (2, 3), colocalize on chromosome 22q12 (37), whereas those for the other IL-6 family members are dispersed on different chromosomes (4).
A murine counterpart of human NNT-1/BSF-3 was also identified in this study, which shares great homology to human NNT-1/BSF-3, indicating that NNT-1/BSF-3 is strongly conserved throughout evolution.
The gene for NNT-1/BSF-3 is expressed mainly in secondary lymphoid organs, such as lymph nodes and spleen, in both humans and mice, suggesting that NNT-1/BSF-3 is relevant to the immune system. However, NNT-1/BSF-3 mRNA is also present in various other organs, as is the case for most IL-6 family members (3). This finding may indicate a functional pleiotropy, a characteristic feature of cytokines in general.
NNT-1/BSF-3 was expressed in E. coli and added to the SK-N-MC human neuroblastoma cells in culture to test its ability to activate gp130. gp130 is recovered from these cells with an antiphosphotyrosine Ab, indicating activation on exposure to NNT-1/BSF-3 (2). LIF-Rβ and STAT3 are also recovered by the same Ab, indicating that they also have undergone activation (2). Therefore, NNT-1/BSF-3 makes use of gp130, qualifying as a member of the IL-6 family (2, 3). Moreover, like all the members of this family, it engages the Janus kinase-STAT pathway of intracellular signal transduction with the involvement of STAT3 (2, 14–19). The fact that NNT-1/BSF-3 also activates LIF-Rβ indicates that it probably induces the formation of a gp130/LIF-Rβ heterodimer, similar to LIF, OM, CNTF, and CT-1 (7–10) and unlike IL-6 and IL-11 (11, 12). It is possible that NNT-1/BSF-3 makes use of a third ligand-binding molecule in its receptor complex, as has been demonstrated for CNTF (9) and indicated for CT-1 (38).
Recombinant NNT-1/BSF-3 was also added to chicken embryo sympathetic neurons in culture and found to support either motor or sympathetic neuron survival. Thus, NNT-1/BSF-3 has neurotropic effects like all the gp130 activators (3) but appears to be one to two logs less potent than CNTF. IL-6 was recognized early as being capable of arresting the growth of the M1 murine myeloid leukemia cells, initiating differentiation (39). LIF, OM and CT-1 also have this property (3, 40). NNT-1/BSF-3 induces M1 cell growth at very low concentration, proving to be potently active on these cells but in a different manner from other gp130 activators. This result suggests that in the M1 cells NNT-1/BSF-3 signal transduction may use different pathways from those of the other IL-6 family members.
Recombinant NNT-1/BSF-3 was then used in vivo. Mice were given NNT-1/BSF-3 in either a single dose or a daily dose for 7 consecutive days. The single dose treatment revealed that NNT-1/BSF-3 has anti-inflammatory features. NNT-1/BSF-3 is a strong inducer of SAA, consistent with the fact that it is a strong inducer of STAT3, the acute phase response factor (41). Thus, NNT-1/BSF-3 triggers the same chain of events that all gp130 activators typically do, i.e., gp130 activation, STAT3 activation, and SAA production (2, 3). Like all the members of the IL-6 family, NNT-1/BSF-3 potentiates the induction by IL-1 of serum corticosterone and IL-6 (20). Interestingly, NNT-1/BSF-3 appears to be able to increase the serum levels of corticosterone also when used alone, like LIF (20, 42). The regulation of inflammation may thus be a major physiological role played by NNT-1/BSF-3. The multiple dose treatment revealed that NNT-1/BSF-3 induces BW loss and stimulates B cells. Seven days of NNT-1/BSF-3 treatment cause 8% BW loss, much less than LIF (7 days of 0.5 mg/kg/day of LIF cause 22% BW loss) but considerably more than leptin (7 days of 5 mg/kg/day of leptin cause 3% BW loss) (42). Therefore, NNT-1/BSF-3 may be involved in BW control, as has been reported for IL-6, IL-11, LIF, and CNTF (21, 22). Seven days of NNT-1/BSF-3 treatment also result in hyperplasia of the B cell areas of secondary lymphoid organs and augment lymph node B cell counts. An increase of the circulating levels of IgG and IgM accompanies NNT-1/BSF-3-induced B cell hyperplasia, confirming the B cell stimulating capability of this gp130 activator. Therefore, another major physiological role for NNT-1/BSF-3 may be the regulation of B cell development and antibody production, in resemblance to IL-6 (27).
IL-6 family cytokines, namely IL-6, IL-11, LIF, and OM, are known for their ability to stimulate hematopoiesis, especially platelet production (23–26). Seven days of NNT-1/BSF-3 treatment, however, do not change either the histological aspect of the bone marrow or the counts of any of the peripheral blood cells, lending no obvious support to the possibility that NNT-1/BSF-3 affects hematopoiesis.
In conclusion, we have identified a gp130 activator that, in addition to most of the activities typical of IL-6 family cytokines, displays an intriguing B cell stimulating capability.
Acknowledgments
We thank Dr. Norman Davidson for helpful discussion and advice. We thank Dr. Carl-Georg Meinhof for assistance with the analysis of the NNT-1/BSF-3-translated amino acid sequence and Dr. Louis Munyakazi for assistance with the statistical analysis. We also thank Meiying Qi for excellent technical assistance.
ABBREVIATIONS
- BW
body weight
- CNTF
ciliary neurotrophic factor
- CT-1
cardiotrophin-1
- LIF
leukemia inhibitory factor
- LIF-Rβ
LIF-receptor β
- NNT-1/BSF-3
novel neurotrophin-1/B-cell stimulating factor-3
- OM
oncostatin M
- SAA
serum amyloid A protein
- STAT
signal transducer and activator of transcription
Footnotes
This paper was submitted directly (Track II) to the Proceedings Office.
References
- 1.Yamasaki K, Taga T, Hirata Y, Yawata H, Kawanishi Y, Seed B, Taniguchi T, Hirano T, Kishimoto T. Science. 1988;241:825–828. doi: 10.1126/science.3136546. [DOI] [PubMed] [Google Scholar]
- 2.Kishimoto T, Akira S, Narazaki M, Taga T. Blood. 1995;86:1243–1254. [PubMed] [Google Scholar]
- 3.Kishimoto T, Taga T. Annu Rev Immunol. 1997;15:797–819. doi: 10.1146/annurev.immunol.15.1.797. [DOI] [PubMed] [Google Scholar]
- 4.Pennica D, Swanson T A, Shaw K J, Kuang W J, Gray C L, Beatty B G, Wood W I. Cytokine. 1996;8:183–189. doi: 10.1006/cyto.1996.0026. [DOI] [PubMed] [Google Scholar]
- 5.Groetzinger J, Kurapkat G, Wollmer A, Kalai M, Rose-John S. Proteins. 1997;27:96–109. [PubMed] [Google Scholar]
- 6.Bazan J F. Neuron. 1991;7:197–208. doi: 10.1016/0896-6273(91)90258-2. [DOI] [PubMed] [Google Scholar]
- 7.Layton M J, Cross B A, Metcalf D, Ward L D, Simpson R J, Nicola N A. Proc Natl Acad Sci USA. 1992;89:8616–8620. doi: 10.1073/pnas.89.18.8616. [DOI] [PMC free article] [PubMed] [Google Scholar]
- 8.Gearing D P, Bruce A G. New Biol. 1992;4:61–65. [PubMed] [Google Scholar]
- 9.Davis S, Aldrich T H, Stahl N, Pan L, Taga T, Kishimoto T, Ip N Y, Yancopoulos G D. Science. 1993;260:1805–1808. doi: 10.1126/science.8390097. [DOI] [PubMed] [Google Scholar]
- 10.Pennica D K, Shaw J, Swanson T A, Moore M W, Shelton D L, Zioncheck K A, Rosenthal A, Taga T, Paoni N F, Wood W I. J Biol Chem. 1995;270:10915–10922. doi: 10.1074/jbc.270.18.10915. [DOI] [PubMed] [Google Scholar]
- 11.Murakami M, Hibi M, Nakagawa N, Nakagawa T, Yasukawa K, Yamanishi K, Taga T, Kishimoto T. Science. 1993;260:1808–1810. doi: 10.1126/science.8511589. [DOI] [PubMed] [Google Scholar]
- 12.Hilton D J, Hilton A A, Raicevic A, Rakar S, Harrison-Smith M, Gough N M, Begley C G, Metcalf D, Nicola N A, Willson T A. EMBO J. 1994;13:4765–4775. doi: 10.1002/j.1460-2075.1994.tb06802.x. [DOI] [PMC free article] [PubMed] [Google Scholar]
- 13.Gearing D P, Comeau M R, Friend D J, Gimpel S D, Thut C J, McGourty J, Brasher K K, King J A, Gillis S, Mosley B, et al. Science. 1992;255:1434–1437. doi: 10.1126/science.1542794. [DOI] [PubMed] [Google Scholar]
- 14.Luetticken C, Wegenka U M, Yuan J, Buschmann J, Schindler C, Ziemiecki A, Harpur A G, Wilks A F, Yasukawa K, Taga T, et al. Science. 1994;263:89–92. doi: 10.1126/science.8272872. [DOI] [PubMed] [Google Scholar]
- 15.Stahl N, Boulton T G, Farruggella T, Ip N Y, Davis S, Witthuhn B A, Quelle F W, Silvennoinen O, Barbieri G, Pellegrini S, et al. Science. 1994;263:92–95. doi: 10.1126/science.8272873. [DOI] [PubMed] [Google Scholar]
- 16.Yin T, Yasukawa K, Taga T, Kishimoto T, Yang Y C. Exp Hematol. 1994;22:467–472. [PubMed] [Google Scholar]
- 17.Narazaki M, Witthuhn B A, Yoshida K, Silvennoinen O, Yasukawa K, Ihle J N, Kishimoto T, Taga T. Proc Natl Acad Sci USA. 1994;91:2285–2289. doi: 10.1073/pnas.91.6.2285. [DOI] [PMC free article] [PubMed] [Google Scholar]
- 18.Zhong Z, Wen Z, Darnell J E., Jr Science. 1994;264:95–98. doi: 10.1126/science.8140422. [DOI] [PubMed] [Google Scholar]
- 19.Akira S, Nishio Y, Inoue M, Wang X J, Wei S, Matsusaka T, Yoshida K, Sudo T, Naruto M, Kishimoto T. Cell. 1994;77:63–71. doi: 10.1016/0092-8674(94)90235-6. [DOI] [PubMed] [Google Scholar]
- 20.Benigni F, Fantuzzi G, Sacco S, Sironi M, Pozzi P, Dinarello C A, Sipe J D, Poli V, Cappelletti M, Paonessa G, et al. Blood. 1996;87:1851–1854. [PubMed] [Google Scholar]
- 21.Plata-Salamon C R. NeuroReport. 1996;7:841–844. doi: 10.1097/00001756-199602290-00038. [DOI] [PubMed] [Google Scholar]
- 22.Ulich T R, Del Castillo J, Shin S S, Yin S, Duryea D, Tarpley J, Samal B. Eur J Haematol. 1995;54:217–225. doi: 10.1111/j.1600-0609.1995.tb00675.x. [DOI] [PubMed] [Google Scholar]
- 23.Ishibashi T, Kimura H, Shikama Y, Uchida T, Kariyone S, Hirano T, Kishimoto T, Takatsuki F, Akiyama Y. Blood. 1989;74:1241–1244. [PubMed] [Google Scholar]
- 24.Hangoc G, Yin T, Cooper S, Schendel P, Yang Y C, Broxmeyer H E. Blood. 1993;81:965–972. [PubMed] [Google Scholar]
- 25.Metcalf D, Nicola N A, Gearing D P. Blood. 1990;76:50–56. [PubMed] [Google Scholar]
- 26.Wallace P M, MacMaster J F, Rillema J R, Peng J, Burstein S A, Shoyab M. Blood. 1995;86:1310–1315. [PubMed] [Google Scholar]
- 27.Akira S, Taga T, Kishimoto T. Adv Immunol. 1993;54:1–78. doi: 10.1016/s0065-2776(08)60532-5. [DOI] [PubMed] [Google Scholar]
- 28.Hirano T, Taga T, Nakano N, Yasukawa K, Kashiwamura S, Shimizu K, Nakajima K, Pyun K H, Kishimoto T. Proc Natl Acad Sci USA. 1985;82:5490–5494. doi: 10.1073/pnas.82.16.5490. [DOI] [PMC free article] [PubMed] [Google Scholar]
- 29.Hirano T, Yasukawa K, Harada H, Taga T, Watanabe Y, Matsuda T, Kashiwamura S, Nakajima K, Koyama K, Iwamatsu A, et al. Nature (London) 1986;324:73–76. doi: 10.1038/324073a0. [DOI] [PubMed] [Google Scholar]
- 30.Aarden L, DeGroot E, Schaap O L, Lansdorp P. Eur J Immunol. 1987;17:1411–1416. doi: 10.1002/eji.1830171004. [DOI] [PubMed] [Google Scholar]
- 31.Rabin E M, Ohara J, Paul W E. Proc Natl Acad Sci USA. 1985;82:2935–2939. doi: 10.1073/pnas.82.9.2935. [DOI] [PMC free article] [PubMed] [Google Scholar]
- 32.Adams M D, Kelley J M, Gocayne J D, Dubnick M, Polymeropoulos M H, Xiao H, Merril C R, Wu A, Olde B, Moreno R F, et al. Science. 1991;252:1651–1656. doi: 10.1126/science.2047873. [DOI] [PubMed] [Google Scholar]
- 33.Altschul S F, Gish W, Miller W, Myers E W, Lipman D J. J Mol Biol. 1990;215:403–410. doi: 10.1016/S0022-2836(05)80360-2. [DOI] [PubMed] [Google Scholar]
- 34.Salamov A A, Solovyev V V. J Mol Biol. 1995;247:11–15. doi: 10.1006/jmbi.1994.0116. [DOI] [PubMed] [Google Scholar]
- 35.Mosmann T. J Immunol Methods. 1983;65:55–63. doi: 10.1016/0022-1759(83)90303-4. [DOI] [PubMed] [Google Scholar]
- 36.Giovannini M, Djabali M, Evans G A. Cytogenet Cell Genet. 1993;63:62–63. doi: 10.1159/000133586. [DOI] [PubMed] [Google Scholar]
- 37.Giovannini M, Djabali M, McElligott D, Selleri L, Evans G A. Cytogenet Cell Genet. 1993;64:240–244. doi: 10.1159/000133586. [DOI] [PubMed] [Google Scholar]
- 38.Robledo O, Chevalier S, Froger J, Barthelaix-Pouplard A, Pennica D, Gascan H. Cytokine. 1997;9:666–671. doi: 10.1006/cyto.1997.0220. [DOI] [PubMed] [Google Scholar]
- 39.Shabo Y, Lotem J, Rubinstein M, Revel M, Clark S C, Wolf S F, Kamen R, Sachs L. Blood. 1988;72:2070–2073. [PubMed] [Google Scholar]
- 40.Gough N M, Gearing D P, King J A, Willson T A, Hilton D J, Nicola N A, Metcalf D. Proc Natl Acad Sci USA. 1988;85:2623–2627. doi: 10.1073/pnas.85.8.2623. [DOI] [PMC free article] [PubMed] [Google Scholar]
- 41.Wegenka U M, Buschmann J, Luetticken C, Heinrich P C, Horn F. Mol Cell Biol. 1993;13:276–288. doi: 10.1128/mcb.13.1.276. [DOI] [PMC free article] [PubMed] [Google Scholar]
- 42.Agnello D, Meazza C, Rowan C G, Villa P, Ghezzi P, Senaldi G. Am J Physiol. 1998;44:R913–R919. doi: 10.1152/ajpregu.1998.275.3.R913. [DOI] [PubMed] [Google Scholar]