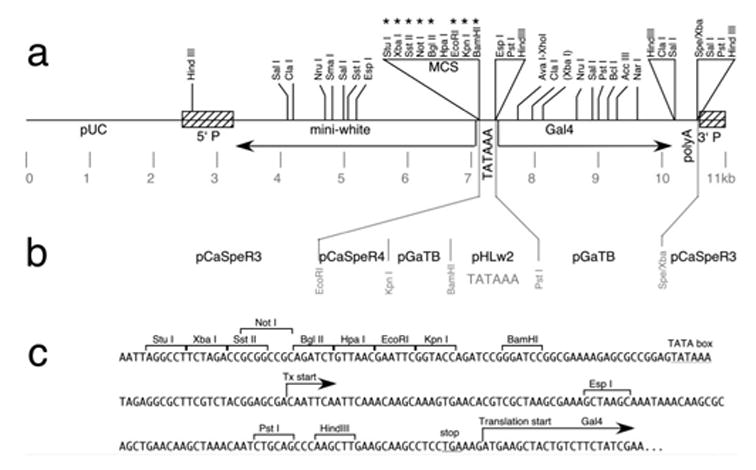
The Gal4-UAS system (Brand and Perrimon, 1993) for targeted expression of transgenes has become a valuable tool in Drosophila molecular genetics. The expression pattern is defined by the regulatory elements associated with the Gal4 driver. These regulatory elements are derived either randomly by the enhancer-trap approach or by construction with enhancer fragments. To simplify the latter approach, we generated a vector for convenient construction of defined enhancer-driven Gal4 transgenes. This vector, pPTGAL (see Fig. 1), contains the Gal4 coding sequences with a minimal promoter downstream of a multicloning site comprising unique restriction sites for the introduction of enhancer fragments of interest. The entire construct is already within a CaSpeR family P-element vector. This allows simple insertion of enhancer fragments and immediate injection to generate transgenic lines. Here we demonstrate the utility of this vector with two different enhancer fragments. Others have also used this vector successfully (Emery et al., 1998; Park et al., 2000; Takaesu et al., 2002).
FIG. 1.

Map and construction of the pPTGAL vector. a: The pPT-GAL vector, based on CaSpeR3, contains the Gal4 coding sequences driven by a minimal promoter downstream of a multicloning site (MCS) for insertion of enhancer-containing fragments. Unique restriction sites (asterisks) include StuI, XbaI, SstII, NotI, BglII, EcoRI, KpnI, and BamHI. b: Sources of fragments in construction of this vector are indicated. References for source plasmids are: pCaSpeR3 and pCaSpeR4 (Thummel and Pirrotta, 1992), pGaTB (Brand and Perrimon, 1993) and pHLw2 (Smith et al., 1993). c: DNA sequence around the multicloning site.
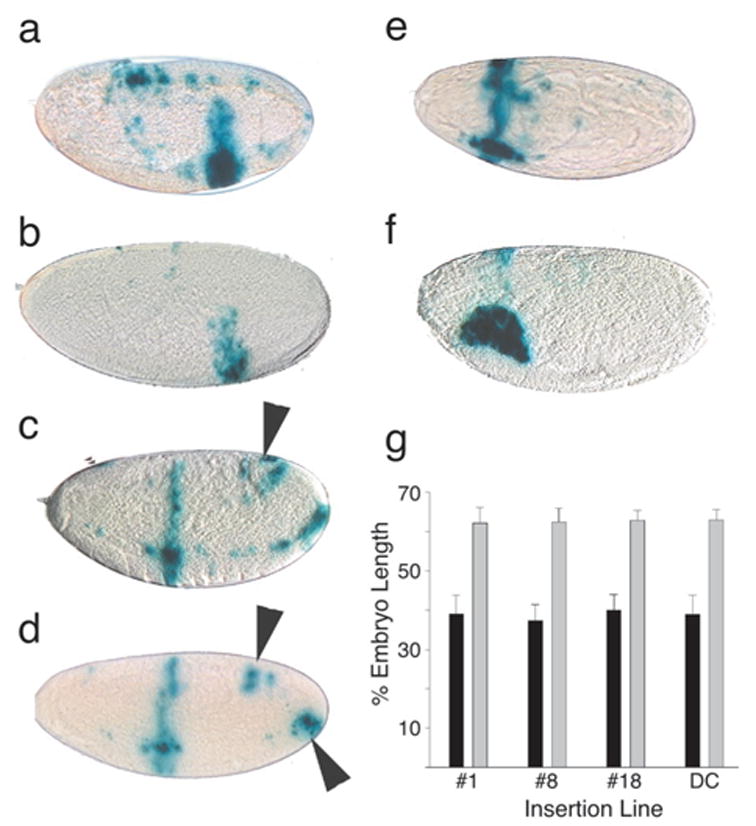
To test the vector, we wanted an enhancer fragment with a previously defined expression pattern and that would also be useful as a Gal4 line. We chose the stripe 3 enhancer from the even-skipped (eve) promoter (Small et al., 1993, 1996). Figure 2 details the staining patterns that result from driving UAS-lacZ with two of the lines, line 8, which consistently stains more intensely than the others, and line 18, which represents the remaining lines.
FIG. 2.

Expression patterns of Gal4 lines generated with the even-skipped stripe 3 enhancer. The stripe 3 enhancer was a 500 bp BamHI/SstI fragment derived from pPB-500st.3 and inserted into pGEM-3Zf(+) to acquire suitable restriction sites. The enhancer was then transferred as an XbaI/EcoR1 fragment to pPTGAL. Four transformant lines were recovered after injection (as described by Spradling, 1986) into early-stage embryos, three with insertions on the second chromosome (lines DC, 1 and 8) and one on the third (line 18). Shown are X-gal stained embryos of line 8 (a,c,e) and of line 18 (b,d,f) crossed to the second chromosome UAS-lacZ reporter strain (Brand and Perrimon, 1993). Eggs from 2-h collections were aged to give 4–6-h embryos (a,b), 8–10-h embryos (c,d), or 10–12-h embryos (e,f). g: Stripe position as a percentage of embryo length was determined from microscopic images with ImagePro software. Measurements were made from the anterior margin of the stripe to the anterior end of the embryo. The positions of anterior stripes (black bars, n = 15 embryos per line) are very consistent between insertion lines, as are the posterior stripes (gray bars, n = 16 embryos per line). Error bars indicate standard deviations.
Staining was first noted in the 4–6-h period in which a vertical posterior band appears ventrally at 62% embryo length (Fig. 2a,b,g). Previous work by Small et al. 1993, 1996 provides evidence that this 500 bp enhancer regulates the expression of both stripes 3 and 7. Whether the posterior staining we see corresponds to stripe 7 is unclear because the previous authors present only cellular blastoderm stage embryos with both stripes apparent. We do not see both stripes simultaneously, our expression being later, and the location of our posterior band at 62% egg length deviates slightly from the 75–77% that we measured for stripe 7 from the figures of Small et al. 1996. These differences could be imposed by peculiarities of the Gal4 system (see below). Alternatively, the stripe 3 enhancer may contribute to the early broad band of eve expression which appears in a band from 69–19% of the embryo length (from posterior) from nuclear cleavage stage 10–13 as described by Harding et al. 1986 and MacDonald et al. 1986 using cDNA probes. Changes in staining pattern were next found among the 8–10-h embryos (Fig. 2c,d,g), where a new band of staining at 40% embryo length is seen anterior to the band found at 4 –6 h. This band extends from dorsal to ventral and likely represents the third eve stripe, as suggested by its coincidence with the segmental pattern seen in Figure 1c. At this stage, strain 8 shows additional ventral staining slightly anterior to the vertical band and extending posteriorly. This could well be staining of the neural elements of the elongated germ band because the most intense staining occurs in clusters, as expected in the nervous system (Frasch et al., 1987). There is also a suggestion of a new region of staining in the posterior ventral and posterior dorsal regions (arrowheads Fig. 2c,d). Because these sites are found on all lines whether they stain germ band or not, we think this may represent regions of, or adjacent to, presumptive proctodeum staining described by others (Frasch et al., 1987) or the presumptive Malpighian tubule region described by Harding et al. 1986. After 10 h, the vertical stripes disappear and what appears to be dense staining of the salivary glands is prominent (Fig. 2e,f). More than 50% of Gal4 lines express in salivary glands (Brand et al., 1994). The strain 8 embryo in Figure 2e is shown from the dorsal view and shows extensive staining between the putative salivary glands. No staining was seen in imaginal discs or other larval tissues except for intense staining in salivary glands, which was first seen during embryogenesis, nor was there staining in adult testes or ovaries, except apparent vector driven patterns, as noted below.
All four strains were remarkably similar with respect to the positioning of the bands (Fig. 2g), suggesting stable regulation of the enhancer at a variety of chromosomal locations. Nevertheless, there were differences in staining intensity, with the most intensely staining line (no. 8) also providing a more complicated staining pattern in the elongating germ band, including possible expression in neural elements. It is not clear whether the additional pattern elements in this line are mediated solely by flanking regulatory elements or by interactions between elements in the flanking DNA with those in the vector or enhancer fragment.
Normal eve expression is usually seen first in syncytial blastoderm embryos (Harding et al., 1986; MacDonald et al., 1986) and its role in segmentation is finished at the peak of germ band elongation (about 4 h after fertilization). Our results suggest that the eve stripe 3 Gal4 expression is delayed by almost 3 h in producing the third stripe. Several explanations for the initial delay in staining expression are possible. One attractive hypothesis is that it may be due to inhibition of UAS response elements, as seems to be the case in the female germline (D. Godt, pers. commun.). Perhaps eggs contain inhibitors that gradually decline during the first stages of embryogenesis. This hypothesis is consistent with previous observations that Gal4-mediated expression does not appear before about 3 h of embryonic development (Brand et al., 1994); it is also consistent with the timeliness of later expression patterns because they would no longer be subject to inhibition. Newer UAS constructs, which are insensitive to germline inhibition, may also prove useful in generating expression from Gal4 drivers earlier in development (D. Godt, pers. commun.).
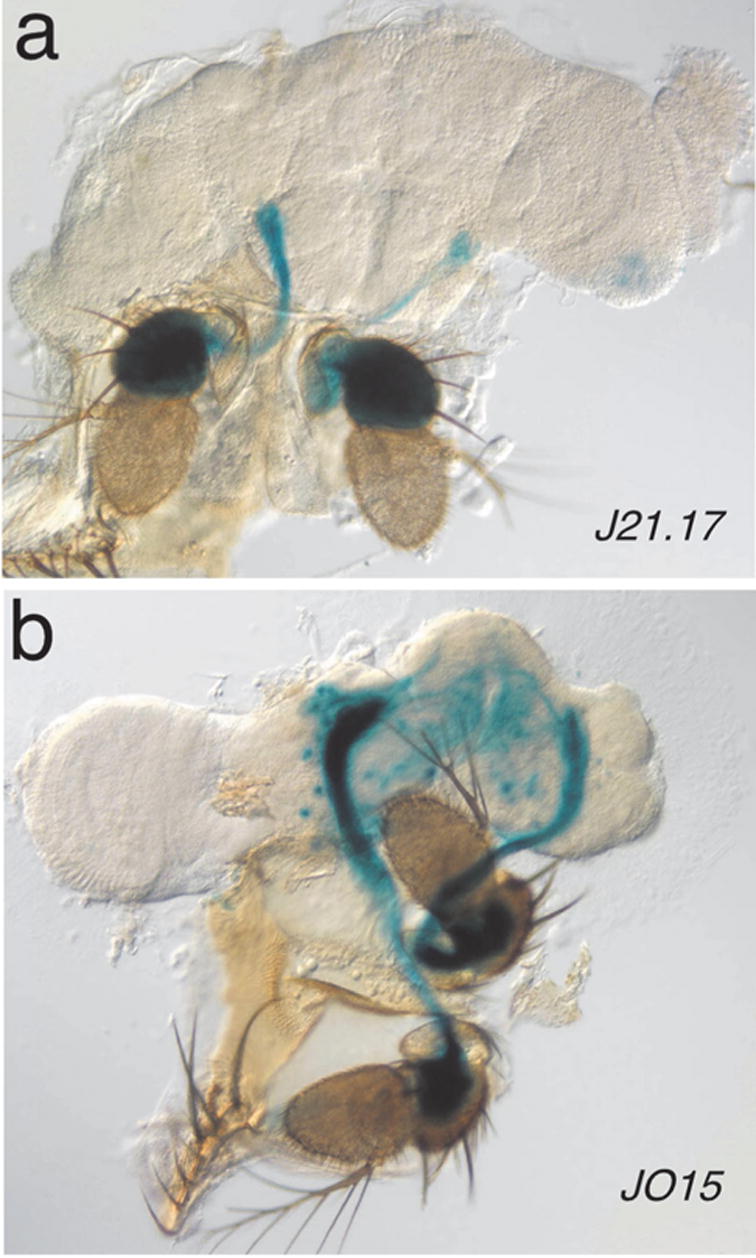
Additional Gal4 lines were generated with expression in chordotonal organs. We were particularly interested in lines that express specifically in Johnston’s organ (JO), the antennal chordotonal organ that mediates hearing (for review see Eberl, 1999). We screened many enhancer trap lines with various constructs (data not shown) and found one hobo enhancer trap line (Smith et al., 1993), J21.17, with very specific lacZ staining in JO neurons (Fig. 3a) but nowhere else in the fly. To generate a Gal4 line with this pattern, we cloned the enhancer fragment from the DNA flanking the insertion site and inserted it into the pPTGAL vector (Fig. 3). We recovered six independent transformed lines and found that all recapitulated the J21.17 expression pattern with some variations. Five lines had additional expression either in leg chordotonal organs or in specific muscles. The additional patterns in these lines were likely caused by chromosomal position effects and therefore no further characterization was carried out. The remaining line, JO15, was the most specific. It shows clear and strong expression in JO neurons (Fig. 3b). In addition, a small number of scolopidia in the leg chordotonal organs show sporadic expression (not shown). In the brain, we see variable expression in mushroom bodies. Thus, all transformed lines showed the expected pattern in JO, although some specificity was lost either through chromosomal position effects or through the effects of sequential transcription of the Gal4 and UAS transgenes imposed by the Gal4 system. Preliminary experiments with JO15 driving UAS-GFP suggest that JO15 is expressed only in a subset of JO neurons (data not shown); whether the original J21.17 enhancer trap line also expresses in only a subset is not clear. Despite these caveats, the JO15 Gal4 line remains a very powerful tool to answer a variety of important questions. For example, it can be used to drive various GFP constructs that will illuminate the dendritic structure, the central projections or the synaptic ultrastructure of JO neurons, not only to define the wild-type structures, but also to determine the effects of mutant genotypes. The JO15 line may also become an important reagent for distinguishing possible functional subtypes of chordotonal units in the JO by expressing deleterious constructs.
FIG. 3.

Expression pattern of the JO15 Gal4 line. The J21.17 hobo enhancer trap shows very specific staining in Johnston’s organ, the antennal chordotonal organ (a). To generate a Johnston’s organ-specific Gal4 line, we plasmid-rescued (HindIII) 12 kb of genomic DNA flanking the J21.17 insertion site (Smith et al., 1993) and used a 5.8 kb BamHI fragment about 0.4 kb from the hobo insertion site as our putative JO-specific enhancer fragment. Comparing partial sequence of this fragment with the genome sequence suggests that the hobo insertion caused a complex rearrangement in this region, so the exact nature of this fragment has not been determined. This fragment was ligated into pPTGAL digested with BamHI and BglII and colonies were selected that showed the correct orientation of the insert. After injection, six independent lines were recovered. The most specific line, JO15, is shown here (b).
In all the lines described above for both the eve stripe 3 construct and the JO construct, we find certain cells that always express the reporter. These are likely to be vector-driven patterns. First, a few cells (<10) stain in the sheath of the adult testis just before it transitions into the testicular duct and the seminal vesicle. Second, in the adult ovaries some staining appears in stage 9 egg chambers; these may be follicle cells near the anterior end of the oocyte. Third, most of the lines show some level of expression, sometimes variegated, in the salivary glands. Before using the pPTGAL vector to study these regions, we suggest that additional controls be performed to distinguish enhancer-driven from vector driven patterns.
In summary, the pPTGAL vector is a convenient tool for the analysis of unknown enhancer fragments or the generation of Gal4 lines with defined enhancers through one-step cloning.
Acknowledgments
We thank Brian McNeer and Rich Binari for generating some of the transformed lines, Bill Gelbart for providing hobo enhancer trap lines, and Steven Hou for the pBS-500st.3 plasmid generated by Steve Small, which contains the even-skipped stripe 3 enhancer.
References
- Brand AH, Perrimon N. Targeted gene expression as a means of altering cell fates and generating dominant phenotypes. Development. 1993;118:401–415. doi: 10.1242/dev.118.2.401. [DOI] [PubMed] [Google Scholar]
- Brand AH, Manoukian AS, Perrimon N. Ectopic expression in Drosophila. Meth Cell Biol. 1994;44:635–654. doi: 10.1016/s0091-679x(08)60936-x. [DOI] [PubMed] [Google Scholar]
- Eberl DF. Feeling the vibes: chordotonal mechanisms in insect hearing. Curr Opin Neurobiol. 1999;9:389 –393. doi: 10.1016/S0959-4388(99)80058-0. [DOI] [PubMed] [Google Scholar]
- Emery P, So WV, Kaneko M, Hall JC, Rosbash M. CRY, a Drosophila clock and light-regulated cryptochrome, is a major contributor to circadian rhythm resetting and photosensitivity. Cell. 1998;95:669 –679. doi: 10.1016/s0092-8674(00)81637-2. [DOI] [PubMed] [Google Scholar]
- Frasch M, Hoey T, Rushlow C, Doyle H, Levine M. Characterization and localization of the even-skipped protein of Drosophila. EMBO J. 1987;6:749 –759. doi: 10.1002/j.1460-2075.1987.tb04817.x. [DOI] [PMC free article] [PubMed] [Google Scholar]
- Harding K, Rushlow C, Doyle H, Hoey T, Levine M. Cross-regulatory interactions among pair-rule genes in Drosophila. Science. 1986;233:953–959. doi: 10.1126/science.3755551. [DOI] [PubMed] [Google Scholar]
- MacDonald PM, Ingham P, Struhl G. Isolation, structure, and expression pattern of even-skipped: a second pari-rule gene of Drosophila containing a homeo box. Cell. 1986;47:721–734. doi: 10.1016/0092-8674(86)90515-5. [DOI] [PubMed] [Google Scholar]
- Park JH, Helfrich-Förster C, Lee G, Liu L, Rosbash M, Hall JC. Differential regulation of circadian pacemaker output by separate clock genes in Drosophila. Proc Natl Acad Sci USA. 2000;97:3608 –3613. doi: 10.1073/pnas.070036197. [DOI] [PMC free article] [PubMed] [Google Scholar]
- Small S, Arnosti DN, Levine M. Spacing ensures autonomous expression of different stripe enhancers in the even-skipped pro-motor. Development. 1993;119:767–772. [PubMed] [Google Scholar]
- Small S, Blair A, Levine M. Regulation of two pair-rule stripes by a single enhancer in the Drosophila embryo. Dev Biol. 1996;175:314 –324. doi: 10.1006/dbio.1996.0117. [DOI] [PubMed] [Google Scholar]
- Smith D, Wohlgemuth J, Calvi BR, Franklin I, Gelbart WM. hobo enhancer trapping mutagenesis in Drosophila reveals an insertion specificity different from P elements. Genetics. 1993;135:1063–1076. doi: 10.1093/genetics/135.4.1063. [DOI] [PMC free article] [PubMed] [Google Scholar]
- Spradling AC. P element-mediated transformation. In: Roberts DB, editor. Drosophila: a practical approach. Oxford: IRL Press; 1986. pp. 175–197. [Google Scholar]
- Takaesu NT, Johnson AN, Newfeld SJ. Posterior spiracle specific Gal4 lines: new reagents for developmental biology and physiology. genesis. 2002;34:16 –18. doi: 10.1002/gene.10109. [DOI] [PubMed] [Google Scholar]
- Thummel CS, Pirrotta V. Technical notes: new pCaSpeR P-element vectors. Drosophila Information Service. 1992;71:150. [Google Scholar]


