

Abstract
Intracellular recordings were made from the circular layer of the intact muscular wall of the guinea-pig gastric antrum in preparations where much of the corpus remained attached. When two electrodes were positioned parallel to and near to the greater curvature, slow waves were first detected at the oral site and subsequently at the anal site: the oro-anal conduction velocity was found to be 2.5 mm s−1. When one electrode was positioned near the greater curvature and the other at a circumferential location, slow waves were first detected near the greater curvature and subsequently at the circumferential site: the circumferential conduction velocity was 13.9 mm s−1. When recordings were made from preparations in which the circular muscle layer had been removed, the oro-anal and the circumferential conduction velocities were both about 3.5 mm s−1. When slow waves were recorded from preparations in which much of the myenteric network of antral interstitial cells (ICCMY) had been dissected away, slow waves were first detected near the region of intact ICCMY and subsequently at a circumferential location: the circumferential conduction velocity of slow waves in regions devoid of ICCMY was 14.7 mm s−1. When the electrical properties of isolated single bundles of circular muscle were determined, their length constants were about 3 mm and their time constant about 230 ms, giving an asymptotic electrotonic propagation velocity of 25 mm s−1. Oro-anal electrical coupling between adjacent bundles of circular muscle was found to vary widely: some bundles were well connected to neighbouring bundles whereas others were not. Together the observations suggest that the slow oro-anal progression of slow waves results from a slow conduction velocity of pacemaker potentials in the myenteric network of interstitial cells. The rapid circumferential conduction of slow waves results from the electrical properties of the circular muscle layer which allow intramuscular ICC (ICCIM) to support the radial spread of slow waves: regions of high resistance between bundles prevent the anally directed spread of slow waves within the circular layer.
The stomach is divided into four regions. The uppermost region, the fundus, is electrically quiescent. The body of the stomach, the corpus, lies in the middle region of the stomach; rhythmical electrical activity, made up of successive slow waves, originates in this region (Tomita, 1981; Szurszewski, 1981; Komori & Suzuki, 1986; Sanders & Publicover, 1989; Hashitani et al. 2005). Slow waves propagate, with low conduction velocities, in an oro-anal direction along the antrum to the pylorus (Sanders & Publicover, 1989). As each slow wave propagates slowly down the stomach it conducts rapidly in the circumferential direction triggering rings of contraction which grind and move the stomach contents towards the gastro-duodenal junction (Sanders & Publicover, 1989). However, no explanation for this organized pattern of motility has been presented (Sanders & Publicover, 1989). Recently it has become apparent that in the stomach, slow waves are initiated by interstitial cells of Cajal (ICC; Sanders, 1996). The distribution of ICC in the stomach shows regional variation. The fundus and the corpus contain intramuscular ICC (ICCIM) which are distributed amongst the smooth muscle cells of both the circular and longitudinal layers (Burns et al. 1997). A myenteric network of ICC (ICCMY) appears at the anal end of the corpus and spreads into the antrum and pylorus (Burns et al. 1997). In the mouse and guinea-pig antrum, the density of ICCMY is highest near the greater curvature and falls markedly towards the lesser curvature (Hirst et al. 2002a; Mazet & Raynier, 2004). ICCIM in the upper fundus, unlike other gastric ICCIM, are normally unable to generate rhythmical electrical activity (Beckett et al. 2004). Gastric slow waves are initiated in the corpus, with this region generating the highest frequency discharge of slow waves (Hashitani et al. 2005). In the isolated antrum, ICCMY generate pacemaker potentials at low frequencies; these passively depolarize the circular muscle layer (Dickens et al. 1999; Hirst & Edwards, 2001; Hirst et al. 2002a; Hirst & Ward, 2003; Cousins et al. 2003). However, in preparations that contain both the corpus and the antrum the dominant frequency of slow waves is determined by that of the corpus (Hashitani et al. 2005). In the circular layer of the antrum each attenuated wave of depolarization, originating in ICCMY, triggers the secondary regenerative component of the slow wave (Ohba et al. 1975). The secondary component of the slow wave is initiated by antral ICCIM, which respond to depolarization to produce the secondary component of the slow wave (Burns et al. 1997; Suzuki & Hirst, 1999; Dickens et al. 2001; Hirst et al. 2002a). Despite the uneven distribution of ICCMY, slow waves of similar amplitude are detected throughout the mouse antrum, provided ICCIM are present (Hirst et al. 2002a).
The aim of this study was to characterize the pattern of slow wave propagation in the guinea-pig antrum and to explore what parameters might give rise to the slow oro-anal and more rapid circumferential conduction velocities of slow waves in this tissue.
Methods
Electrophysiological methods
All procedures used for the acquisition of physiological data from isolated tissues were approved by the Animal Experimentation Ethics Committee at the Australian National University. Guinea-pigs of either sex were stunned, exsanguinated and the stomach removed. In the initial experiments the stomach was first cut along the greater curvature and then along the lesser curvature; one hemi-stomach was immersed in oxygenated physiological saline (composition, mm): NaCl, 120; NaHCO3, 25; NaH2PO4, 1.0; KCl, 5; MgCl2, 2; CaCl2, 2.5; and glucose, 11; bubbled with 95% O2–5% CO2. The fundus and lower pylorus were discarded; the mucosa, followed by the serosa, was dissected away from the remaining tissue. Preparations were pinned, serosal surface uppermost, in a recording chamber with a base consisting of a microscope cover-slip coated with Sylgard silicone resin (Dow Corning Corp., Midland, MI, USA) and viewed with an inverted compound microscope. The antrum was impaled with two independently mounted sharp electrodes, with resistances of 100–140 MΩ, filled with 0.5 m KCl. The orientation and separation between electrodes were noted. Membrane potential changes (and when appropriate membrane currents) were amplified using an Axoclamp-2B amplifier (Axon Instruments), low-pass filtered (cut-off frequency, 1000 Hz), digitized and stored on computer for later analysis. In some experiments, similar preparations were made but the longitudinal and adhering ICCMY layers were dissected away from most of the preparation, leaving a 3 mm wide band of longitudinal muscle, with the ICCMY network intact, along the greater curvature: regions of tissue devoid of ICCMY were impaled with two independently mounted sharp electrodes, care being taken to impale the same bundle of circular muscle. The separation between electrodes was again determined.
The conduction velocities of pacemaker potentials in the anal and circumferential directions were determined using preparations of longitudinal muscle, with ICCMY attached (see Hirst & Edwards, 2001). Preparations were pinned over a bar stimulating electrode, let into the base of the chamber; a second parallel bar electrode was placed above the tissue (Hirst et al. 2002b). The preparations were orientated so that conduction from the plane of stimulation, with a pulse width of 5 ms and with a stimulus strength adjusted to 110% threshold value, was either in an anal or in a circumferential direction. Intracellular recordings were made using two electrodes, with the separation between recording electrodes being determined. The arrival times of a pacemaker potential at the two points in the ICCMY network was determined from measurements of the 10% rise point of the potential change produced in the longitudinal muscle layer by a pacemaker potential. The conduction velocity was determined by dividing the separation between electrodes by the difference in arrival times. Atropine (1 µm) was added to the physiological saline to abolish the effects of concurrent stimulation of excitatory nerves (see Hirst & Edwards, 2001).
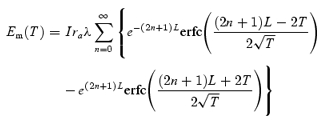
The electrical properties of the circular layer were determined using individual bundles of circular muscle (diameter 60–150 µm, length 2.0–3.5 mm; see Suzuki & Hirst, 1999 for details). Preparations were again impaled with two independently mounted sharp electrodes: one was positioned at each end of the single bundle of circular muscle. Current pulses were passed through one electrode and the other was used to measure the resulting electrotonic potentials. The electrotonic potentials could be simulated when the bundle was modelled as an electrically short cable with sealed ends. Jack & Redman (1971) have derived the Laplace transform of the voltage response at the centre of such a cable (length 2 L) to a step of current injected at distance X from the recording electrode (see eqn (A20) (Jack & Redman)). Multiplying this expression by 2 and setting X to L gives the Laplace transform for the voltage response at one end of a cable (length L) to current injection at the other end. Applying substitutions that were used to solve the case for an infinite cable (eqn 3.24 in Jack et al. 1975) and taking the inverse Laplace transform yields the following equation:
 |
(1) |
where Em(T) represents membrane potential, I injected current, ra axial resistance, λ length constant, L cable length measured in length constants and T time measured in time constants. This expression was verified by the method of reflections (see p. 69 in Jack et al. 1975). To fit this expression to a physiologically acquired response, values of equivalent membrane resistance, axial resistance and membrane time constant were varied according to a Simplex algorithm until the best least-squares fit was obtained (Matlab 6.5.1 Release 13; The MathWorks, Natick, MA, USA). During each optimization step, the series of infinite cable responses was summed to account for only the first 20 reflections, as adding further reflection components did not affect the solution. For each bundle the electrical length constant was determined from the values of membrane resistance and axial resistance (eqn 3.10 of Jack et al. 1975), and the asymptotic value of electrotonic conduction velocity in the analogous infinite cable was calculated (p. 34 of Jack et al. 1975). The membrane time constant, electrical length constant and electrotonic conduction velocity of each bundle was determined.
In the experiments where the connectivity between nearby bundles of smooth muscle was characterized, segments of circular layer, with the longitudinal and ICCMY layers removed, were isolated. The segments had lengths of 1–1.2 mm and were four or five bundles wide. A bundle at one edge of the preparation was first impaled with two electrodes. Current pulses were passed through one electrode and the resulting electrotonic potentials were recorded using the second electrode: the time course and amplitude was determined from an average of 20 successive electrotonic potentials. Subsequently the recording electrode was withdrawn and the adjacent bundle was impaled: current pulses of the same amplitude were passed through the current-passing electrode and electrotonic potentials were recorded from the adjacent bundle with the second electrode. The process was repeated with the recording electrode being inserted in the next more distant bundle. The connectivity between bundles, termed transfer ratio, was quantified by determining the ratio of steady state amplitudes of electrotonic potentials, produced by injecting constant intensity current pulses into the same and the adjacent muscle bundle.
During each experiment, preparations were constantly superfused with physiological saline solution warmed to 37°C; nifedipine (1 µm) was added to the physiological saline to reduce the amplitudes of the contractions associated with each slow wave or regenerative potential. When the electrical properties of single bundles of smooth muscle and the coupling between nearby bundles of smooth muscle were being determined, caffeine (1 mm) was added to the physiological saline to inhibit the occurrence of unitary potentials and regenerative potentials (Edwards et al. 1999), to ensure only passive cable properties were measured. After caffeine wash-out the frequency of regenerative potentials was increased for up to 30 min; no attempt was made to allow a complete return to control conditions as this meant that the impalements had to be maintained for excessive times. Thus, some of the recordings made from paired bundles of circular muscle give a misleading impression of the natural frequency of generation of regenerative potentials (Fig. 5).
Figure 5. Electrical coupling between adjacent bundles circular muscle in the guinea-pig antrum.

The upper pair of traces (Aa and Ab) shows simultaneous recordings from the same bundle of circular muscle. Note that recorded membrane potential changes were very similar. When a current pulse was passed through one electrode it produced an electronic potential with a steady state amplitude of about 11 mV (C). The lower pair of traces (Ba and Bb) shows simultaneous recordings from adjacent muscle bundles; although the regenerative potentials occurred synchronously, their shapes differed in detail. Current passed through one electrode evoked an electrotonic potential in the second bundle with a steady state amplitude of about 5 mV (C). The peak negative membrane potential of both muscle bundles, recorded in the presence of caffeine (1 mm), was −65 mV; each electrotonic potential is an average of 20 successive responses. The upper time and voltage calibration bars apply to the upper four traces. The lower time calibration bar applies to the lower voltage and current traces.
Immunohistochemical methods
To determine the distribution of ICCMY in living preparations, preparations were first washed with warmed physiological saline for 30 min. The preparations were then incubated for 15 min with an antibody to CD 117 (rat anti-mouse CD 117 C-kit, Cymbus Biotechnology, Chadlers Ford, UK), diluted 1 in 500 in physiological saline. Subsequently the preparations were washed in warmed physiological saline for 15 min and then incubated in Alexa Fluor 488 (goat-anti-rat; Molecular Probe, Eugene, OR, USA), again diluted 1 in 500 in physiological saline, for 15 min. Preparations were washed with warmed solution and viewed with a confocal microscope, illumination wavelength 488 nm, emission wavelength above 505 nm. The serosal surface of the preparation was first viewed and the microscope focus moved down until ICC were visualized. In control preparations, ICCMY were first detected; subsequently ICCIM were detected in a lower plane of focus. When the longitudinal layer was removed, ICCMY were not detected but ICCIM were apparent.
Statistical methods
All data are expressed as means ±s.e.m. Student's t test was used to determine if data sets differed, with a P value < 0.05 taken to indicate a significant difference. Caffeine, atropine sulphate and nifedipine (obtained from Sigma Chemical Co.) were used in these experiments.
Results
Conduction velocities of slow waves in oro-anal and circumferential directions
When intracellular recordings were made from the circular layer of antrum, anal to the corpus, regular discharges of slow waves were recorded. Those recorded close to the greater curvature had dominant initial components whereas these were less apparent with more distal recordings (Fig. 1Ac and Bc). Slow waves had amplitudes in the range 27.8–42.3 mV (mean ±s.e.m., 37.3 ± 1.9 mV, n = 7), where each n value represents a measurement from a separate preparation. Slow waves occurred at frequencies in the range 3.7–5.0 waves min−1 (4.5 ± 0.2 waves min−1, n = 7): cells had peak negative potentials in the range −59 to −74 mV (−71.1 ± 1.2 mV, n = 7). When paired recordings were made from the antrum, with the two electrodes both positioned near the greater curvature, slow waves of similar amplitude were detected at each point (Fig. 1Aa and b). On each occasion a slow wave was first detected by the electrode nearer the corpus, indicating that the dominant pacemaker region lay in the corpus (Hashitani et al. 2005). When the conduction velocity of the slow waves in the oro-anal direction was determined, from measurements of electrode separation and the time difference between times to 50% peak amplitude of the slow waves (Fig. 1Ac), it lay in the range 1.6–3.1 mm s−1 (2.5 ± 0.3 mm s−1, n = 7). When paired recordings were made from the antrum, with one electrode positioned near the greater curvature and the other towards the lesser curvature, slow waves of similar amplitude were again detected at each point. On each occasion a slow wave was first detected at the electrode nearer the greater curvature. When the conduction velocity of the spread of slow waves in a circumferential direction was calculated (Fig. 1Bc), it lay in the range 4.4–35.1 mm s−1 (13.9 ± 4.3 mm s−1, n = 7). Using a paired t test, the values of conduction velocity in the anal and circumferential directions were found to be significantly different. Thus, as has been found in other species (Sanders & Publicover, 1989), the circumferential conduction velocity of slow waves in the guinea-pig antrum was faster than that in the anal direction.
Figure 1. Comparison between conduction velocities of slow waves in anal and circumferential directions in the circular muscle layer of the guinea-pig gastric antrum.

The upper left hand pair of traces (Aa and Ab) show simultaneous recordings of slow waves, made parallel and close to the greater curvature; the separation between electrodes was 2 mm. It can be seen that both slow waves recorded had similar amplitudes and occurred at the same frequency: the resting potential in Aa was −74 mV and in Ab was −73 mV. In the expansion of region in Ab shown by the bar, it can be seen that there was an appreciable delay between the onsets of the slow waves (Ac): from the delay and separation the conduction velocity in the anal was calculated to be 3.1 mm s−1. The upper right hand pair of traces (Ba and Bb) show simultaneous recordings of slow waves, made with one electrode close to the greater curvature and the other placed 2 mm away in a circumferential direction. Again slow waves recorded at both points had similar amplitudes and occurred at the same frequency: the resting potentials in Ba and in Bb were −74 mV. However, in the expanded region of Bb, the delay between the onsets of the slow waves (Bc) is seen to be briefer than that detected in the anal direction (Ac): from the delay and separation the conduction velocity in the circumferential direction was found to be 15.3 mm s−1. The voltage calibration bar applies to all traces. The upper time calibration bar applies to the upper pairs of traces; the lower time calibration bar applies to lower pairs of overlaid traces.
Anal and circumferential conduction velocities of pacemaker potentials in preparations lacking the circular layer
One explanation for the difference between the anal and circumferential conductions velocities of slow waves could be that pacemaker potentials, generated in the ICCMY network, have different intrinsic conduction velocities in the two directions. This possibility was tested by determining the conduction velocity of pacemaker potentials in preparations where the circular layer had been removed. The network of ICCMY was excited along a line and the arrival of the evoked pacemaker potential at two separate distances determined; measuring the length of conduction and conduction time allowed a determination of conduction velocity. Because of the difficulty in recording pacemaker potentials at two separate locations, the depolarizations generated by pacemaker potentials in the longitudinal layer, termed follower potentials (Dickens et al. 1999), were recorded from the longitudinal muscle layer. In these preparations, follower potentials, generated at a point in the longitudinal layer have very similar onset times to that of the pacemaker potentials which generate them (Fig. 2A and B; see also Hirst & Edwards, 2001). When recordings were made at two separate points, the relative onset times of individual spontaneous pairs of follower potentials varied from wave to wave. An example is shown in the lower part of Fig. 2C–F. It can be seen that during the first spontaneous follower potential, the onset of depolarization recorded by the electrode closer to the stimulating bar, illustrated with the continuous line, preceded that of the follower potential recorded with the more distant electrode, illustrated with a dashed line (Fig. 2C and D). Conversely during the second spontaneous follower potential, the depolarization was first detected by the more distant electrode (Fig. 2C and E). When the network of interstitial cells was stimulated electrically along a line, invariably the follower potential was first detected at the recording electrode nearer the stimulating electrode (Fig. 2C and F). These observations suggest that pacemaker potentials originate spontaneously at various points in an isolated patch of ICCMY network and then propagate through the network (Hirst & Edwards, 2001; Hennig et al. 2004; Ward et al. 2004). However, when the ICCMY network is excited, pacemaker potentials originate at the line of stimulation and conduct in a reproducible manner through the network (see also Fig. 3).
Figure 2. Properties of follower potentials generated in the longitudinal muscle layer by pacemaker potentials.

The upper pair of superimposed traces (A) show simultaneous recordings of pacemaker potentials (continuous line) and follower potentials (dashed line) recorded from an ICCMY and a longitudinal muscle cell: the separation between electrodes was less than 20 µm. Spontaneously occurring pacemaker potentials and follower potentials occurred synchronously. In the expanded region (B), it can be seen that the onset of depolarization occurred in both cells at similar times: the resting potential of the ICCMY was −72 mV and that of the longitudinal muscle cell was −71 mV. The lower pair of superimposed traces (C) shows simultaneous recordings of follower potentials recorded 1 mm (continuous line) and 2 mm (dashed line) from the stimulating bar. In the first expansion (D), it can be seen that the spontaneously occurring follower potential was first detected at the electrode closer to the stimulating bar (continuous line). In the second expansion (E), it can be seen that the spontaneously occurring follower potential was first detected at the electrode more distant from the stimulating bar (dashed line). When the ICCMY network was stimulated (F), the ‘driven’ follower potential was first detected at the closer recording point and subsequently at the more distant recording point. The resting potentials in C were −72 mV (continuous line) and −74 mV (dashed line). The voltage calibration bar applies to all traces. The lower time calibration bar applies to traces D, E and F.
Figure 3. Comparison between conduction velocities of follower potentials in anal and circumferential directions in the longitudinal muscle layer of the guinea-pig gastric antrum after removal of the circular layer.

The upper set of three pairs of superimposed traces (A) show simultaneous recordings of follower potentials recorded from a preparation with the longitudinal muscle layer orientated so that the evoked follower potentials conducted in an anal direction: one recording electrode was approximately 1 mm from the stimulating bar and the separation between it and the second electrode was exactly 1 mm. Follower potentials arrived at each site with a fixed latency: the arrival times were separated by 240 ms, giving an anal conduction velocity of 4.1 mm s−1. The resting membrane potential of both cells was −69 mV. The lower set of three pairs of superimposed traces (B) show simultaneous recordings of follower potentials recorded from a different preparation where the longitudinal muscle layer was orientated so that the evoked follower potentials conducted in a circumferential direction: one recording electrode was just less than 1 mm from the stimulating bar and the separation between it and the second electrode was exactly 1 mm. Again, follower potentials arrived at each site with fixed latencies: the arrival times were separated by 340 ms, giving a circumferential conduction velocity of 2.9 mm s−1. The resting membrane potential of the cell nearest the stimulating electrode was −71 mV; that of the other was −73 mV. The time and voltage calibration bars apply to all traces.
When the preparations were orientated so that evoked pacemaker potentials conducted in an anal direction (Fig. 3A), the calculated conduction velocities lay in the range 2.7–4.7 mm s−1 with a mean value of 3.7 ± 0.7 mm s−1 (n = 5): this value was not significantly different to the oro-anal conduction velocity of slow waves determined in intact preparations (i.e. 2.5 ± 0.3 mm s−1). When the preparations were orientated so that evoked pacemaker potentials conducted in a circumferential direction (Fig. 3B), the calculated conduction velocities lay in the range 3.1–3.4 mm s−1 with a mean value of 3.2 ± 0.1 mm s−1 (n = 5). This value differed significantly from the circumferential conduction velocity of slow waves determined in intact preparations (i.e. 13.9 ± 4.3 mm s−1) but was not significantly different from the anal conduction velocity determined using evoked pacemaker potentials (i.e. 3.7 ± 0.7 mm s−1). Thus pacemaker potentials have similar intrinsic conduction velocities whatever their direction of propagation within the ICCMY network and attached longitudinal muscle layer. Although no attempts were made to formally define the passive electrical properties of the antral longitudinal muscle layer, with ICCMY attached, it was noted that when current pulses were passed through one electrode, with electrode separations of about 1 mm, an electrotonic potential could only be detected when the two electrodes were placed in an oro-anal orientation. This suggests that in the longitudinal layer of the antrum, as in the longitudinal layer of ileum (Cousins et al. 1993), the passive electrical length constant is shorter in the transverse direction than in the longitudinal direction.
Passive electrical properties of the circular muscle layer
The previous observations suggest that the rapid circumferential conduction of slow waves, detected in intact antral preparations, reflects some aspect of the properties of the circular muscle layer of the antrum. The subsequent experiments were designed to examine these properties. Single isolated bundle of muscles, dissected from the circular layer, were impaled with two electrodes, one placed at each end of the bundle. When the recordings of membrane potential were inspected, they displayed similar discharges of noise although individual unitary potentials would often have larger amplitudes at one or other of the recording electrodes. Current pulses, passed through one electrode, invariably evoked electrotonic potentials that were detected by the electrode at the other end of the bundle. After suppressing the discharge of membrane noise by adding caffeine (1 mm) to the physiological fluid, the time course and amplitude of the electrotonic potential was determined from the average of 20 successive sweeps (Fig. 4). In preliminary experiments the relationship between amplitudes of electrotonic potentials and intensity of injected current was examined. It was found that the relationship was linear provided the membrane potential did not become more negative than −80 mV. The membrane time constant and electrical length constant of each bundle were determined by computation (see Methods). The result from an experiment is shown in Fig. 4. In this example the preparation had a length of 2.1 mm. The two electrodes were inserted, one at either end of the preparation (Fig. 4A); a current, 5 nA, was passed for 1 s through one electrode (Fig. 4C). The electrotonic potential, recorded with the other electrode, could be best described if it was assumed that the bundle had a membrane time constant of 260 ms and an electrical length constant of 3.4 mm (Fig. 4B). From this experimental series, circular muscle bundles were found to have resting membrane potentials in the range −57 to −67 mV (−62.2 ± 1.0 mV, n = 10), their membrane time constants were in the range 190–280 ms (235 ± 10 ms, n = 10) and their electrical length constants were in the range 2.1–4.2 mm (3.0 ± 0.2 mm, n = 10). When their passive conduction velocities were calculated (Jack et al. 1975), they were found to lie in the range 19.5–31.9 mm s−1 (25.2 ± 1.4 mm s−1, n = 10). These experiments show that the electrical properties of bundles of circular muscle are such that in the intact stomach they will readily allow the circumferential transfer of electrical activity.
Figure 4. Cable properties of a single bundle of circular muscle isolated from guinea-pig antrum.

The upper part of the figure illustrates schematically the experimental design (A). The bundle was impaled with two electrodes, one at each end of the bundle. One was used to inject constant current pulses and the other was used to record the resulting electrotonic potential. A pulse of current (C) evoked an electrotonic potential (B). The time course of the electrotonic potential, determined from an average of 20 successive responses, is shown as dots: the theoretical curve derived to fit the data, with length constant of 3.4 mm and time constant of 260 ms, is shown as a continuous line (B). The length of the preparation was 2.1 mm and the resting membrane potential, determined in the presence of caffeine (1 mm), was −60 mV. The time calibration bar applies to the current and voltage traces.
Electrical connectivity between adjacent bundles of circular muscle
In the next set of experiments the connectivity between adjacent bundles of circular muscle was examined. Short sections of the circular layer, containing some four or five adjacent bundles of muscle, were impaled with two electrodes. When both electrodes were placed in the same bundle, an irregular discharge of regenerative potentials, with very similar time courses and amplitudes, was detected by both electrodes (Fig. 5Aa and b). The discharge of regenerative potentials was suppressed by caffeine (1 mm) and the input resistance of the impaled bundle determined by passing current pulses (Fig. 5D) through one electrode and measuring the change in membrane potential with the other electrode (Fig. 5C). Subsequently caffeine was washed away, the recording electrode was removed and the adjacent muscle bundle was impaled. In many of the preparations, 10 of 17, even though the shapes of regenerative potentials in the adjacent bundles differed somewhat, both bundles discharged regenerative potentials synchronously (Fig. 5Ba and b). When the discharge of regenerative potentials was again suppressed by caffeine (1 mm) current pulses injected into one bundle produced electrotonic potentials in the other bundle with amplitudes 20–70% of those detected when both electrodes were in the same bundle (Figs 5C and 7C).
Figure 7. Variation in coupling between bundles in the circular muscle layer of guinea-pig antrum.

The upper left part of the figure schematically illustrates the experimental design (A). A preparation, consisting of 4 short adjacent circular muscle bundles was impaled with two electrodes. The electrodes were placed in one bundle, current was injected through the current-passing electrode and the electrotonic potential measured (V1). The recording electrode was successively positioned in the second and third bundles; the same current was injected into the first bundle, and V2 and V3 were determined successively. In B, three adjacent bundles were coupled together. In C, the first two bundles were coupled together but coupling between the second and third bundle could not be detected. The results from all experiments are summarized in D, where individual transfer ratios, V2/V1, were calculated from the experimental series. The column marked *, illustrates an experiment where a clearly defined anastomosis between adjacent bundles was detected visually. All recordings were made in the presence of caffeine (1 mm). The time, voltage and current calibration bars apply to all traces.
In the remaining seven preparations electrical coupling between bundles was less secure or absent. When both electrodes were used to impale the same bundle, again the discharge of regenerative potentials and the patterns of membrane noise were very similar (Fig. 6Aa and b); again current injected into one electrode evoked an electrotonic potential that was detected by the second electrode (Fig. 6C). However, when the electrodes were used to impale adjacent bundles the patterns of rhythmic activity differed; regenerative potentials in one bundle occurred independently from those in the other bundle (Fig. 6Ba and b). When current was injected into one bundle often no electrotonic potential was detected in the other bundle (4 of 17 observations; Fig. 6C). In the remaining three experiments, the electrotonic potentials detected in adjacent bundles had amplitudes less than 10% of those detected when both the electrodes were placed in the same bundle.
Figure 6. Lack of electrical coupling between adjacent bundles circular muscle in the guinea-pig antrum.

The upper pair of traces (Aa and Ab) shows simultaneous recordings from the same bundle of circular muscle. When a current pulse was passed through one electrode, it produced an electronic potential with a steady state amplitude of about 10 mV (C). The lower pair of traces (Ba and Bb) shows simultaneous recordings from adjacent muscle bundles. In this example, regenerative potentials did not occur synchronously and their shapes differed. When current was passed through one electrode an electrotonic potential was not detected in the second bundle (C). The peak negative membrane potentials of the muscle bundles were −63 mV and −61 mV; each electrotonic potential is an average of 20 successive responses recorded in the presence of caffeine (1 mm). The upper time and voltage calibration bars apply to the upper four traces. The lower time calibration bar applies to the lower voltage and current traces.
These discontinuities in connectivity between bundles were unlikely to have resulted from damage during the dissection. In five preparations, recordings were made from three successive bundles and discontinuities were still detected abruptly in the preparations (Fig. 7A). Two examples are shown in Fig. 7. In one preparation three successive bundles were coupled to each other (Fig. 7Ba). In the other experiment the first two bundles were electrically interconnected but the third bundle was not connected to them (Fig. 7Ca).
The grouped results from this series of experiments are shown in (Fig. 7D). Together they show that although many bundles were electrically connected to their neighbours, invariably signals were attenuated between bundles. Moreover, at several points in the circular layer, areas of electrical discontinuity existed which prevent transmission of electrical activity in an oro-anal direction in the circular layer. Thus, whilst supporting the circumferential transfer of electrical activity, the poor connections between neighbouring bundles will hinder or prevent the oro-anal conduction of slow waves.
Circumferential conduction velocity of slow waves in regions of antrum devoid of ICCMY
One explanation for the rapid circumferential conduction of slow waves is that slow waves are initiated in each circular muscle bundle by the slowly travelling descending wave of pacemaker potentials in the ICCMY network. The passive electrical properties of the circular layer then readily allow the circumferential transfer of depolarization. If ICCIM alone could sustain the rapid circumferential propagation of slow waves, the circumferential conduction velocity would then depend on the electrical properties of the circular layer and the activation kinetics of ICCIM but might not be influenced by the conduction of pacemaker potentials within the ICCMY network. To test this idea, slow waves were recorded from regions of antrum that lacked ICCMY (see Methods). Briefly, most of the longitudinal layer was removed with a band, 3 mm wide, adjacent to the greater curvature being left intact. Preparations were labelled with an antibody to CD 117 and inspected to check whether the ICCMY network had been retained near the greater curvature and had been removed circumferentially (Fig. 8A and C); this was found to be the case in each of the preparations examined (n = 6). In this set of experiments, slow waves, recorded from the region of tissue with ICCMY intact (Fig. 8B), had amplitudes in the range 30.3–39.8 mV (33.7 ± 1.4 mV, n = 6) and occurred at frequencies in the range 3.4–4.5 waves min−1 (4.0 ± 0.2 waves min−1, n = 6): cells had peak negative potentials in the range −64 to −69 mV (−66.3 ± 0.8 mV, n = 6). When recordings were made from regions of the circular layer where the longitudinal layer and ICCMY network had been removed, slow waves were invariably detected (Fig. 8D). Slow waves, recorded from regions devoid of ICCMY, had amplitudes in the range 32.0–36.3 mV (33.6 ± 1.0 mV, n = 6) and occurred at frequencies in the range 3.5–4.4 waves min−1 (4.0 ± 0.2 waves min−1, n = 6): cells had peak negative potentials in the range −64 to −70 mV (−67.2 ± 0.9 mV, n = 6). Using paired t tests, the amplitudes, frequencies and peak negative potentials of slow waves recorded from regions where ICCMY were absent were found not to differ significantly from those recorded from tissues with ICCMY present.
Figure 8. Slow waves recorded in regions of antrum with and without intact networks of ICCMY.

The upper pair of micrographs shows the distribution of ICC near the greater curvature (A) and in a region of the same preparation further from the greater curvature where the longitudinal layer and ICCMY network had been dissected away (C). At the greater curvature as the microscope was focused down from the serosal surface of the preparation, ICCMY were first detected (A). In the region where the longitudinal layer had been removed, as the microscope was focused down, ICCMY were not detected but ICCIM were observed (C): the calibration scale bar in C also applies to micrograph A. The lower pairs of traces show slow waves recorded from the region where ICCMY were present (B) and from the region where ICCMY had been removed (D); the resting membrane potential of both cells was −68 mV. The time and voltage calibration bars apply to both traces.
Subsequently, slow waves were recorded from the same bundle of circular muscle using two electrodes both placed in the region from which ICCMY had been dissected away. Slow waves were detected at both recording points; invariably each slow wave was first detected at the electrode nearer the band of tissue where the ICCMY network had been left intact (Fig. 9A). When the conduction velocity of the spread of slow waves in a circumferential direction was determined in the regions of tissue which lacked ICCMY (Fig. 9B), it was found to lie in the range 3.8–36.4 mm s−1 (14.7 ± 5.2 mm s−1, n = 6), a value similar to that determined in the pylorus (van Helden & Imtiaz, 2003) and in the canine antrum (Ward et al. 2004). Using a t test the circumferential conduction velocity of slow waves in tissues devoid of ICCMY was found not to differ significantly from that determined in preparations with an intact ICCMY network (i.e. 13.9 ± 4.3 mm s−1, n = 7).
Figure 9. Conduction velocity of circumferentially directed slow waves in the circular muscle layer of the guinea-pig gastric antrum in regions where ICCMY had been removed.

The upper pair of traces (Aa and Ab) show simultaneous circumferential recordings of slow waves, both made from the same circular muscle bundle in a region devoid of ICCMY. The separation between electrodes was 2 mm: the recording shown as a continuous line illustrates the slow waves recorded at the point closer to the greater curvature. It can be seen that the slow waves had similar amplitudes and occurred at the same frequency: the resting potential in Aa was −69 mV and in Ab was −70 mV. In the expansion (B), it can be seen that there was a delay of about 165 ms between the rising phases of the slow wave recorded at two separate points: from the delay and electrode separation the conduction velocity was calculated to be 12.1 mm s−1. The voltage calibration bar applies to all traces. The upper time calibration bar applies to the upper pair of traces; the lower time calibration bar applies to the overlaid traces.
Discussion
These experiments show that in the gastric antrum slow waves propagate more rapidly in the circumferential than in the anal direction. The different conduction velocities did not arise from asymmetrical rates of conduction of pacemaker potentials in the ICCMY network. Furthermore the more rapid circumferential speed of conduction of slow waves in the circular layer persists after removing the ICCMY network. The differences in conduction velocities can be explained if separate sets of ICC support the propagation of slow waves in the two different directions. Thus, the anal conduction velocity is determined by conduction velocity of pacemaker potentials within the ICCMY network: this will reflect the properties of the electrical connections between neighbouring ICCMY and the kinetics of the conductance changes associated with each pacemaker potential. Conversely the circumferential conduction velocity is determined by the electrical properties of the circular muscle layer and the kinetics of the conductance changes associated with the regenerative responses generated by ICCIM.
After removing the circular layer, pacemaker potentials propagate slowly through the ICCMY network whatever the direction of spread. Thus, when the conduction velocity of evoked pacemaker potentials was measured, the conduction velocity in either the anal or circumferential direction was about 3 mm s−1 (Fig. 3). This value of conduction velocity is the same as that determined using calcium imaging techniques to monitor the progression of spontaneous pacemaker potentials through the ICCMY network; again, the conduction velocity in different directions was found to be the same (Hennig et al. 2004). Why pacemaker potentials propagate so slowly in the ICCMY network is not understood. It seems unlikely that this results from poor electrical coupling between neighbouring ICCMY. Neurobiotin readily spreads from an impaled myenteric interstitial cell to neighbouring ICCMY (Dickens et al. 1999). Abundant deposits of connexion-43 are located within the ICCMY network (Cousins et al. 2003) and electron micrographs indicate the presence of numerous gap junctions between nearby ICCMY (Jimenez et al. 1999; Horiguchi et al. 2001). Given that the conduction velocities of pacemaker potentials in the oro-anal and circumferential directions are similar in preparations consisting only of the longitudinal layer and the ICCMY network (Fig. 3), it seems unlikely that the conduction velocity depends critically on current flow through the longitudinal layer since the electrical length constants of the longitudinal muscle layer differ markedly in the oro-anal and circumferential directions (Cousins et al. 1993). This problem is explored in the accompanying paper (Edwards & Hirst, 2006).
Each pacemaker potential passively depolarizes adjacent circular muscle bundles (Cousins et al. 2003); when depolarized, each bundle of circular muscle initiates a regenerative response (Suzuki & Hirst, 1999). The passive electrical properties of the layer are such that they support the rapid circumferential spread of depolarization (Fig. 4). In most excitable cells, where voltage-dependent ion-selective channels are activated, the active conduction velocity is much faster than the electrotonic conduction velocity (Jack et al. 1975). However, the regenerative component of the slow wave involves release of calcium ions from internal stores and has slow activation kinetics (Suzuki & Hirst, 1999; Edwards & Hirst, 2003; Edwards & Hirst, 2005). Under these circumstances the active conduction velocity of regenerative responses will approach the electrotonic conduction velocity, in this case about 25 mm s−1. Furthermore, since circular muscle bundles are organized into ‘muscle units’, with regions of poor coupling between bundles being frequent (Figs 6 and 7), excitation will not spread over large distances in the oro-anal direction. The finding that slow waves of normal amplitude readily conduct in a circumferential direction in antral regions of tissue where the ICCMY network has been removed (Figs 8 and 9) indicates that the circular muscle layer alone is capable of sustaining the propagation of slow waves. Similar observations have been made in the pyloric region of guinea-pig stomach (van Helden & Imtiaz, 2003). In the dog antrum, slow waves propagate with similar conduction velocities and there the process is voltage dependent and depends on calcium entry (Ward et al. 2004). Presumably a similar mechanism underlies the conduction of slow waves in the guinea-pig antrum but this point has not been addressed in this study. Since smooth muscle cells do not contain sets of ion channels capable of generating slow waves (Farrugia, 1999), the propagation of slow waves must be sustained by ICCIM. In the antrum of mutant mice that lack ICCIM, waves of rhythmical depolarization are only detected in areas of tissue near to the ICCMY network: at the lesser curvature, where ICCMY are absent, little electrical activity is detected (Hirst et al. 2002a). However, when ICCIM are present, slow waves of normal amplitude are detected in all regions, even when the density of ICCMY is very low (Hirst et al. 2002a). These observations indicate that ICCIM normally sustain the propagation of slow waves in the mouse antrum in the region near the lesser curvature. In several species, histological studies indicate that two separate groups of ICC are associated with smooth muscle cells in the circular layer. In the dog antrum, ICCIM and ICC with a septal location (ICCSEP) have been described (Horiguchi et al. 2001). ICCIM are present in guinea-pig antrum (Burns et al. 1997) and they alone could be responsible for the conduction of slow waves along the circular layer. Alternatively, if both ICCIM and ICCSEP are present in guinea-pig antrum, both could contribute to the circumferential spread of slow waves.
The conduction velocity of slow waves in the circumferential direction is the same whether the ICCMY network is present or absent (Figs 1 and 9), suggesting that ICCMY are only involved in the initiation of slow waves rather than in their conduction. If this view is correct, the role of ICCMY, located away from the region of greater curvature, may be to detect any changes in the frequency of regenerative responses in the circular layer and coordinate activity if the dominant pacemaker is shifted to the circular layer, as can happen during excitatory nerve activity (Hirst et al. 2002b).
In summary, our observations suggest that the rapid circumferential conduction of slow waves can be explained largely on the basis of the electrical properties of the circular muscle layer. Each wave of pacemaker depolarization is initiated at the interface between the corpus and the antrum (Hashitani et al. 2005); it then conducts slowly in an anal direction through the ICCMY network (Fig. 10). As the pacemaker potential passes over successive circular muscle units, it passively depolarizes each muscle unit. The passive wave of pacemaker depolarization activates ICCIM and they initiate the regenerative component of the slow wave. A wave of depolarization spreads more rapidly in a circumferential direction, so activating successive ICCIM: these in turn generate a rapidly propagating circumferentially directed slow wave (Fig. 10). Thus, together the two sets of ICC generate a slowly descending ring of contraction in the intact stomach.
Figure 10. Propagation of slow waves in gastric antrum.

The figure schematically illustrates the functional organization of the antrum which would allow coordinated circumferential rings of contraction to slowly migrate down the stomach. Pacemaker potentials, first initiated at the interface between the corpus and the antrum, slowly conduct in an oro-anal direction through the ICCMY network. Each pacemaker potential depolarizes successive circular muscle bundles. The depolarization activates ICCIM and, because of the rapid electronic conduction velocity of the circular layer, slow waves readily propagate circumferentially. Regions of electrical continuity between muscle bundles are illustrated as closed rectangles. The occasional absence of such a connection means that the layer is made of several muscle units and oro-anal conduction of slow waves in the circular layer does not occur.
Acknowledgments
This project was supported by a grant from the National Health and Medical Research Council of Australia.
References
- Beckett EA, Bayguinov YR, Sanders KM, Ward SM, Hirst GDS. Properties of unitary potentials generated by intramuscular interstitial cells of Cajal in the murine and guinea-pig gastric fundus. J Physiol. 2004;559:259–269. doi: 10.1113/jphysiol.2004.063016. [DOI] [PMC free article] [PubMed] [Google Scholar]
- Burns AJ, Herbert TM, Ward SM, Sanders KM. Interstitial cells of Cajal in the guinea-pig gastrointestinal tract as revealed by c-Kit. Cell Tissue Res. 1997;290:11–20. doi: 10.1007/s004410050902. [DOI] [PubMed] [Google Scholar]
- Cousins HM, Edwards FR, Hickey H, Hill CE, Hirst GDS. Electrical coupling between the myenteric interstitial cells of Cajal and adjacent muscle layers in the guinea-pig gastric antrum. J Physiol. 2003;550:829–844. doi: 10.1113/jphysiol.2003.042176. [DOI] [PMC free article] [PubMed] [Google Scholar]
- Cousins HM, Edwards FR, Hirst GDS, Wendt IR. Cholinergic neuromuscular transmission in the longitudinal muscle of the guinea-pig ileum. J Physiol. 1993;471:61–86. doi: 10.1113/jphysiol.1993.sp019891. [DOI] [PMC free article] [PubMed] [Google Scholar]
- Dickens EJ, Edwards FR, Hirst GDS. Selective knockout of intramuscular interstitial cells reveals their role in the generation of slow waves in mouse stomach. J Physiol. 2001;531:827–833. doi: 10.1111/j.1469-7793.2001.0827h.x. [DOI] [PMC free article] [PubMed] [Google Scholar]
- Dickens EJ, Hirst GDS, Tomita T. Identification of rhythmically active cells in guinea-pig stomach. J Physiol. 1999;514:515–531. doi: 10.1111/j.1469-7793.1999.515ae.x. [DOI] [PMC free article] [PubMed] [Google Scholar]
- Edwards FR, Hirst GDS. Mathematical description of regenerative potentials recorded from circular smooth muscle of guinea pig antrum. Am J Physiol. 2003;285:G661–G670. doi: 10.1152/ajpgi.00145.2003. [DOI] [PubMed] [Google Scholar]
- Edwards FR, Hirst GDS. An electrical description of the generation of slow waves in the antrum of the guinea pig. J Physiol. 2005;564:213–232. doi: 10.1113/jphysiol.2004.077123. [DOI] [PMC free article] [PubMed] [Google Scholar]
- Edwards FR, Hirst GDS. An electrical analysis of slow wave propagation in the guinea-pig gastric antrum. J Physiol. 2006;571:179–189. doi: 10.1113/jphysiol.2005.100743. [DOI] [PMC free article] [PubMed] [Google Scholar]
- Edwards FR, Hirst GDS, Suzuki H. Unitary nature of regenerative potentials recorded from circular smooth muscle of guinea-pig antrum. J Physiol. 1999;519:235–250. doi: 10.1111/j.1469-7793.1999.0235o.x. [DOI] [PMC free article] [PubMed] [Google Scholar]
- Farrugia G. Ionic conductances in gastrointestinal smooth muscles and interstitial cells of Cajal. Ann Rev Physiol. 1999;61:45–84. doi: 10.1146/annurev.physiol.61.1.45. [DOI] [PubMed] [Google Scholar]
- Hashitani H, Garcia-Londoño AP, Hirst GDS, Edwards FR. Atypical slow waves generated in gastric corpus provide dominant pacemaker activity in guinea pig stomach. J Physiol. 2005;569:459–465. doi: 10.1113/jphysiol.2005.097907. [DOI] [PMC free article] [PubMed] [Google Scholar]
- Hennig GW, Hirst GDS, Park KJ, Smith CB, Sanders KM, Ward SM, Smith TK. Propagation of pacemaker activity in the guinea-pig antrum. J Physiol. 2004;556:585–599. doi: 10.1113/jphysiol.2003.059055. [DOI] [PMC free article] [PubMed] [Google Scholar]
- Hirst GDS, Beckett EAH, Sanders KM, Ward SM. Regional variation in contribution of myenteric and intramuscular interstitial cells of Cajal to generation of slow waves in mouse gastric antrum. J Physiol. 2002a;540:1003–1012. doi: 10.1113/jphysiol.2001.013672. [DOI] [PMC free article] [PubMed] [Google Scholar]
- Hirst GDS, Dickens EJ, Edwards FR. Pacemaker shift in the gastric antrum of guinea-pigs produced by excitatory vagal stimulation involves intramuscular interstitial cells. J Physiol. 2002b;541:917–928. doi: 10.1113/jphysiol.2002.018614. [DOI] [PMC free article] [PubMed] [Google Scholar]
- Hirst GDS, Edwards FR. Generation of slow waves in the antral region of guinea-pig stomach – a stochastic process. J Physiol. 2001;535:165–180. doi: 10.1111/j.1469-7793.2001.00165.x. [DOI] [PMC free article] [PubMed] [Google Scholar]
- Hirst GDS, Ward SM. Interstitial cells: involvement in rhythmicity and neural control of gut smooth muscle. J Physiol. 2003;550:337–346. doi: 10.1113/jphysiol.2003.043299. [DOI] [PMC free article] [PubMed] [Google Scholar]
- Horiguchi K, Semple GS, Sanders KM, Ward SM. Distribution of pacemaker function through the tunica muscularis of the canine gastric antrum. J Physiol. 2001;537:237–250. doi: 10.1111/j.1469-7793.2001.0237k.x. [DOI] [PMC free article] [PubMed] [Google Scholar]
- Jack JJB, Noble D, Tsien RW. Electric Current Flow in Excitable Cells. Oxford, UK: Clarendon Press; 1975. [Google Scholar]
- Jack JJB, Redman SJ. The propagation of transient potentials in some linear cable structures. J Physiol. 1971;215:283–320. doi: 10.1113/jphysiol.1971.sp009472. [DOI] [PMC free article] [PubMed] [Google Scholar]
- Jimenez M, Borderies JR, Vergara P, Wang Y-F, Daniels EE. Slow waves in circular muscle of porcine ileum: structural and electrophysiological studies. Am J Physiol. 1999;276:G393–G406. doi: 10.1152/ajpgi.1999.276.2.G393. [DOI] [PubMed] [Google Scholar]
- Komori K, Suzuki H. Distribution and properties of excitatory and inhibitory junction potentials in circular muscle of the guinea-pig stomach. J Physiol. 1986;370:339–355. doi: 10.1113/jphysiol.1986.sp015938. [DOI] [PMC free article] [PubMed] [Google Scholar]
- Mazet B, Raynier C. Interstitial cells of Cajal in the guinea pig gastric antrum: distribution and regional density. Cell Tissue Res. 2004;316:23–34. doi: 10.1007/s00441-003-0835-9. [DOI] [PubMed] [Google Scholar]
- Ohba M, Sakamoto Y, Tomita T. The slow wave in the circular muscle of the guinea-pig stomach. J Physiol. 1975;253:505–516. doi: 10.1113/jphysiol.1975.sp011203. [DOI] [PMC free article] [PubMed] [Google Scholar]
- Sanders KM. A case for interstitial cells of Cajal as pacemakers and mediators of neurotransmission in the gastrointestinal tract. Gastroenterology. 1996;111:492–515. doi: 10.1053/gast.1996.v111.pm8690216. [DOI] [PubMed] [Google Scholar]
- Sanders KN, Publicover NG. Handbook of Physiology, Section 6, Gastrointestinal System. Part 1. Bethesda: American Physiological Society; 1989. Electrophysiology of the gastric musculature; pp. 187–216. [Google Scholar]
- Suzuki H, Hirst GDS. Regenerative potentials evoked in circular smooth muscle of the antral region of guinea-pig stomach. J Physiol. 1999;517:563–573. doi: 10.1111/j.1469-7793.1999.0563t.x. [DOI] [PMC free article] [PubMed] [Google Scholar]
- Szurszewski JH. Electrical basis for gastrointestinal motility. In: Johnson R, editor. Physiology of the Gastrointestinal Tract. New York: Raven; 1981. pp. 1435–1465. [Google Scholar]
- Tomita T. Electrical activity (spikes and slow waves) in gastrointestinal smooth muscles. In: Bulbring E, Brading AF, Jones AW, Tomita T, editors. Smooth Muscle: an Assessment of Current Knowledge. London: Edward Arnold; 1981. pp. 127–156. [Google Scholar]
- van Helden DF, Imtiaz MS. Ca2+ phase waves: a basis for cellular pacemaking and long-range synchronicity in the guinea-pig gastric pylorus. J Physiol. 2003;548:271–296. doi: 10.1113/jphysiol.2002.033720. [DOI] [PMC free article] [PubMed] [Google Scholar]
- Ward SM, Dixon RE, de Foite A, Sanders KM. Voltage-dependent calcium entry underlies propagation of slow waves in canine gastric antrum. J Physiol. 2004;561:793–810. doi: 10.1113/jphysiol.2004.076067. [DOI] [PMC free article] [PubMed] [Google Scholar]