Abstract
The vibrissal movements known as whisking are generated in a pulsatile, or non-continuous, fashion and comprise sequences of brief regularly spaced movements. These rhythmic timing sequences imply the existence of periodically issued motor commands. As inferior olivary (IO) neurones generate periodic synchronous discharges that could provide the underlying timing signal, this possibility was tested by determining whether the olivocerebellar system modulates motor cortex (MCtx)-triggered whisker movements in rats. Trains of current pulses were applied to MCtx, and the resulting whisker movements were recorded using a high speed video camera. The evoked movement patterns demonstrated properties consistent with the existence of an oscillatory motor driving rhythm. In particular, movement amplitude showed a bell-shaped dependence on stimulus frequency, with a peak at 11.5 ± 2.3 Hz. Moreover, movement trajectories showed harmonic and subharmonic entrainment patterns within specific stimulus frequency ranges. By contrast, movements evoked by facial nerve stimulation showed no such frequency-dependent properties. To test whether the IO was the oscillator in question, IO neuronal properties were modified in vivo by intra-IO picrotoxin injection, which enhances synchronous oscillatory IO activity and reduces its natural frequency. The ensuing changes in the evoked whisker patterns were consistent with these pharmacological effects. Furthermore, in cerebellectomized rats, oscillatory modulation of MCtx-evoked movements was greatly reduced, and intra-IO picrotoxin injections did not affect the evoked movement patterns. Additionally, multielectrode recording of Purkinje cell complex spikes showed a temporal correlation of olivocerebellar activity during MCtx stimulus trains to evoked movement patterns. In sum, the results indicate that MCtx's ability to generate movements is modulated by an oscillatory signal arising in the olivocerebellar system.
Conventionally, the final stages of voluntary motor planning and execution are thought to occur in the frontal lobe motor areas, particularly the MCtx. Activity from the MCtx proceeds, via descending pathways, to the spinal cord, where it results in the activation of motor neurones. Indeed, the MCtx is the single largest contributor to the corticospinal tract, and electrical stimulation of the MCtx evokes short-latency movements at low stimulus intensities (see review by Porter & Lemon, 1993). Moreover, since the pioneering studies of Evarts, changes in MCtx single unit activity are known to precede movement onset, and are correlated with force and other movement parameters indicative of a direct role in motor execution (Evarts, 1966, 1968, 1974).
Yet, early single unit studies also demonstrated that the control of MCtx activity over movement execution is not absolute. During imposed delay periods, MCtx activity can change dramatically, long before the onset of a movement (Evarts & Tanji, 1974; Tanji & Evarts, 1976). Such ‘set-related’ activity has been amply confirmed by subsequent investigators (e.g. Georgopoulos et al. 1989; Alexander & Crutcher, 1990a, 1990b). Even more strikingly, multiple unit recording from MCtx has shown that population activity that is essentially identical to that which occurs during a movement may occur in the absence of movement (Chapin et al. 1999). These results raise the possibility that the ability of MCtx activity to produce movements is modulated by subcortical brain systems, whose temporal coherence with the cortical signal may be significant during motor execution.
Periodic synchronous discharge of the olivocerebellar system has been suggested to be one such timing signal in the dynamic organization of motor commands (Llinás, 1974, 1991). In this regard, it is particularly interesting that Horsley and Schaeffer originally reported that stimulation of the MCtx or cerebral peduncles produced 10 Hz movements regardless of stimulus frequency (Horsley & Schäfer, 1886). Moreover, during voluntary movements, motor commands to the muscles are issued as a series of pulses at ∼10 Hz, independent of movement speed (Vallbo & Wessberg, 1993; Doeringer & Hogan, 1998; Kakuda et al. 1999; McAuley et al. 1999a; Marsden et al. 2001; Jaberzadeh et al. 2003).
If this motor olivocerebellar timing hypothesis is correct, then a reasonable corollary is that synchronous discharges from the olivocerebellar system should affect the movements generated by the cortical motor areas (Lang, 1995). We sought to test this idea by investigating whether the ability of MCtx activity to generate movements is modulated by the olivocerebellar system. In part, inspired by von Holst's work on the interaction of spinal cord oscillators in fish (von Holst, 1973), we decided to use repetitive stimulation of the MCtx to evoke whisker movements and investigate whether the characteristics of these movements were modulated by rhythmic olivocerebellar activity. The results support the hypothesis that the olivocerebellar system is a key brain system for motor coordination whose function is to provide a timing signal for the proper execution of movement sequences.
Methods
Experiments were carried out in accordance with the National Institutes of Health guidelines for the care and use of laboratory animals. Experimental protocols were approved by the IACUC of New York University School of Medicine.
Surgical preparation
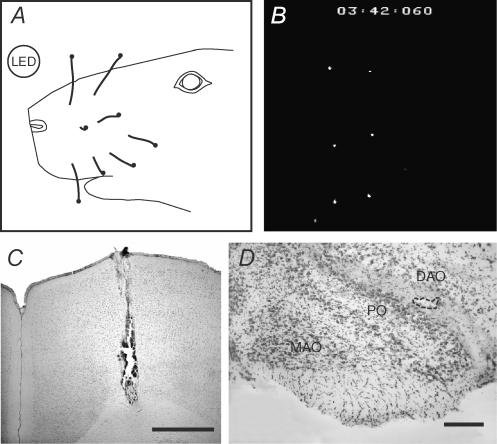
Adult Sprague-Dawley rats (225–300 g) were anaesthetized with an initial intraperitoneal injection of ketamine (100 mg kg−1) and xylazine (8 mg kg−1). Supplemental anaesthesia (ketamine, ∼260 μg kg−1 min−1; xylazine, ∼16 μg kg−1 min−1) was delivered continuously through a femoral vein catheter or as 0.1 ml injections of ketamine (∼6 mg kg−1) and xylazine (∼0.4 mg kg−1) dissolved in 0.9% saline solution. Rectal temperature was monitored and maintained at 36–37°C by use of an electric heating pad. Animals were placed in a stereotaxic frame, and the skin and bone overlying the right MCtx were removed. A small retaining screw was inserted into the superolateral portion of the parietal bone in order to provide an attachment point for the dental cement bridge that was used to fix the head to the stereotaxic frame. Following head fixation, one stereotaxic arm was removed to allow unimpeded visualization of the left side of the face. The mystacial vibrissae were then trimmed to a length of ∼2 cm, such that their tips formed a vertical planar surface. The facial fur and shafts of the vibrissae were painted black using a permanent ink marker. The tips of the vibrissae were left unpainted and coated with a small amount of high gloss nail polish. Next, a bipolar stimulation electrode (a pair of Teflon-coated tungsten wires; A-M Systems, Carlsborg, WA, USA) was inserted to a depth of 1.5–2.0 mm into the vibrissal MCtx (Fig. 1C). The exposed brain surface was then covered with Ringer solution-soaked pieces of Gelfoam.
Figure 1. Experimental setup for video recording of vibrissal movements and histological controls.
A, schematic diagram of the video image of the rat face under normal illumination. The focal plane was adjusted to the one formed by the coated tips of the whiskers (black dots at distal ends of whiskers), and an LED was positioned such that it did not interfere with the whisker movements. Note, only those whiskers that were visible in the recording condition (B) are shown in the schematic diagram. B, video image of whisker tips under recording conditions (illumination from above by a fibre optic light source). The coated whisker tips appear as white dots. A time code (min: s: ms) is printed at the top of each image. LED was not lit at the time of this frame, and so is not visible. C, cresyl violet-stained coronal section through MCtx showing track of stimulation electrode. Tip of electrode was inserted to the deep layers of the cortex to evoke whisker movements. Scale bar equals 1 mm. D, cresyl violet-stained section showing injection pipette tip location in the IO (indicated by dashed line). Slight greying of white matter between DAO and PO is due to alcian blue dye injected after recording sessions. Scale bar equals 200 μm. Abbreviations: DAO, dorsal accessory olive; MAO, medial accessory olive; PO, principal olive.
Multiple electrode recording surgery and electrode implantation
In two experiments, multiple electrode recordings of crus 2a Purkinje cell complex spike activity were obtained while simultaneously recording MCtx-evoked whisker movements. In these experiments, the surgical preparation was identical to that described above with the following additions. The bone and dura overlying the cerebellum were removed and a recording platform was cemented in place over lobule crus 2a. The recording platform consisted of an electron microscope grid that was embedded in silicon rubber and to which tungsten rods were epoxied. Using a joystick-controlled, three-axis micromanipulator, glass microelectrodes were driven though the silicone rubber-filled holes in the grid into the molecular layer of the cerebellar cortex until complex spike activity was isolated, usually at a depth of ∼100 μm. Electrodes (∼1 MΩ impedance) were placed to form a rectangular array with an interelectrode spacing of 250 μm. A more detailed description of the implantation procedure has been reported previously (Sasaki et al. 1989; Sugihara et al. 1993).
Stimulation protocol
Stimulus trains, delivered via a bipolar electrode, were 4–5 s long and consisted of 100–200 μs duration current pulses (50–700 μA) delivered at a frequency between 5 and 27 Hz by an isolated pulse generator (Model 2100, A-M Systems). Stimulus intensity was set such that most stimuli during the 10 Hz trains reliably evoked movements. The intertrain interval was typically 30 s.
Intraolivary injections
In some experiments intra-IO injection of picrotoxin (Sigma, St Louis, MO or Tocris, Ellisville, MO, USA) was used to modify the oscillatory properties of IO neurones. An injection micropipette (tip diameter 10–20 μm) was lowered from the dorsal surface of the medulla to the IO. The placement of the pipette was guided by stereotaxic coordinates (Paxinos & Watson, 1998), and verified by the recording of multiunit activity characteristic of the IO through the same micropipette. The injection solution contained picrotoxin (1 or 2 mg ml−1) dissolved in Ringer solution, and was injected at rates of 0.1–0.2 μl min−1. In most experiments the injection was stopped when a volume of ∼1 μl was reached. The exception to this rule was one experiment in a cerebellectomized animal in which the injection was continued until ∼4 μl had been injected. At the conclusion of the experiment, the pipette solution was exchanged for one containing Alcian Blue dye while the pipette was left in position, and a small amount of dye was then injected to confirm that the pipette tip was positioned within the IO (Fig. 1D).
Facial nerve stimulation
In experiments in which whisker movements were evoked by stimulating the facial nerve, the nerve was accessed by making a small incision in the skin caudal to the vibrissal pad. The nerve was then dissected free and transected. A bipolar stimulation electrode was applied to the surface of the peripheral portion of the nerve.
Cerebellectomy procedures
For acute cerebellectomy experiments, the initial surgical preparation was as described above. In addition, the bone overlying the cerebellum was removed and the exposed dura was covered with Ringer-soaked Gelfoam. The stimulation electrode was then inserted into the MCtx and evoked whisker movements were recorded. Next, the dura overlying the cerebellum was cut, and the entire cerebellum removed, excepting the flocculus, paraflocculus, and the lateralmost edge of the hemispheric cortex. The exposed floor of the exposed fourth ventricle was covered with Gelfoam soaked in Ringer solution.
In the chronic experiments, the cerebellectomies were performed during an initial surgery under ketamine–xylazine anaesthesia. The bone overlying the cerebellum was removed, the cerebellum removed, and the space packed with Gelfoam. The surgical incision was then sutured closed. Recordings were made 3 days post-cerebellectomy in one case and over a year post-cerebellectomy in the other. On the day of the recording, the MCtx was exposed, and a stimulation electrode was implanted for evoking whisker movements, as described above.
Histology
Histological sections were obtained to verify the locations of both the MCtx stimulation electrode and the IO injection pipette. At the conclusion of the recordings, animals were perfused intracardially with 0.9% saline followed by 10% formalin solution. The brains were removed and placed in 10% formalin overnight followed by 30% sucrose formalin until the brain sank. Coronal slices (60 μm thick) were cut on a freezing microtome and counter stained with cresyl violet.
Data acquisition
Video imaging
Evoked whisker movements were tracked using a high speed video recording system (HSV-500c3, NAC, Simi Valley, CA, USA). Recordings were made onto sVHS tapes, typically at 200 or 250 fields per second (fps) with a shutter speed of 1/1000 s. The camera was fitted with a macro lens (V-HQ Super Macro 90 mm, Elicar, Japan) and positioned lateral to the head of the animal, such that the whisker tips could be visualized en face (Fig. 1A). The room lighting was extinguished and a fibre optic light source was used to illuminate the whisker tips from above. With this lighting arrangement, each whisker tip appeared as a point of light on a dark background (Fig. 1B). A light-emitting diode (LED) placed in the recording field was used to mark the times of the MCtx stimuli. A transistor-transistor logic (TTL) signal from the pulse generator was used to illuminate the LED at the onset of each stimulus.
Video acquisition and analysis
The video records were captured onto an Apple Macintosh G4 computer using an analog to digital video converter box (DVMC-DA1, Sony Corporation of America, New York) and video editing software (Premiere 6.0, Adobe Systems, San Jose, CA, USA or Final Cut Pro HD 4.5, Apple Computer). Once captured, the video was contrast enhanced and then exported as a QuickTime file. All subsequent video processing and data analysis were done within Igor Pro 4.0 (WaveMetrics, Lake Oswego, OR, USA). Using routines written within IGOR, the QuickTime movie was deinterlaced and analysed field by field using automated and manual tracking routines. To create a full-frame image from each field, the ‘missing’ lines of each field were generated by averaging the corresponding pixels of the neighbouring lines. The tracking routines produced a series of x–y coordinate pairs from which the individual whisker trajectories could be reconstructed. These trajectories were then used for measuring the various movement parameters.
The evoked whisker movements investigated here, like spontaneously occurring movements (Bermejo et al. 2002), proceed along both an anteroposterior (protraction–retraction) axis and a dorsoventrally orientated axis. In order to isolate these components, the camera was rotated such that movement parallel to the x-axis of the video frame corresponded to protraction–retraction movements, and movement along the y-axis of the video frame corresponded to dorsoventrally directed movements. Observation of the video records made it clear that by far the largest component of MCtx-evoked movement trajectories was along the protraction–retraction axis. Furthermore, the amplitude component directed along the y-axis of the frame, when not zero, usually showed a similar pattern of deviations as the x-axis component. Moreover, similar deviation patterns could also be observed using the magnitude of the vectorial sum of the two amplitude components. Thus, for simplicity, only the trajectory along the x-axis was analysed in detail.
The en face video recording arrangement allowed recording of both anteroposterior and dorsoventral movements of multiple whiskers simultaneously. However, the actual whisker trajectory is an arc, but only the projection of the arc onto the focal plane is recorded, resulting in an underestimate of the true distance travelled by the whisker tip. However, for the present experiments this error was not significant for several reasons. First, because the analysed whiskers had rest positions such that they were nearly parallel to the axis running from the base of the whisker to the camera, and because the amplitudes of the evoked movements were relatively small (generally 1–10 mm), the difference between the true arc length and its projection onto the focal plane was small (= 1%). Second, the experiments were primarily concerned with determining the patterns of evoked movements under different conditions, and to accomplish this, the relative, not the absolute, amplitudes of the movements are critical.
While movement amplitudes are primarily reported in millimeters in this study, to allow comparison with some prior studies, movement amplitudes are sometimes also converted to angular displacement using the following formula: θ= ArcTan (x/20), where θ is the angle through which the whisker rotates, x is the displacement of the whisker tip during a movement in millimeters, and 20 mm is the whisker length.
Multiple unit recording
Multiple electrode recordings of complex spike activity were obtained using a 96 channel amplifier system (see Lang et al. 1996 for details of the amplifier system). Each channel had a 20 kHz sampling rate, 1000× gain, and low cut filter with a cutoff frequency of 200 Hz. Analog signals were viewed on an oscilloscope, and a single level voltage threshold was used to detect spikes. Spike times were thus defined as the initial deflection of the complex spike and were binned with a 1 ms resolution and recorded using a Dell personal computer and a National Instruments data acquisition card. TTL signals from the pulse generator, which marked the times of the MCtx stimuli, were recorded by the computer system and were also used to illuminate an LED, which was recorded by the video camera, enabling the spike and video records to be synchronized.
Statistical analyses and quantification of movement patterns
In the text, mean values are given with their associated standard deviation, unless otherwise stated. Student's t test was used for testing statistical significance, except when testing whether a correlation coefficient (Pearson's r) was statistically different from zero because r is not normally distributed. r was first converted to Fisher's z′, which is normally distributed with a standard error of the mean (s.e.m.z′) of 1/(n− 3)1/2 (Snedecor & Cochran, 1989). A z-score was then computed as (z′− 0)/s.e.m.z′ and used to obtain the two-tailed P-value.
Movement patterns evoked by different frequency stimulus trains showed distinct variations in the amplitudes of neighbouring movements. Quantification of these variations was performed using periodograms with a Hamming window, Wigner plots (Bartelt et al. 1980), and the MAD/MA ratio, defined as the mean absolute difference (MAD) in amplitude between movements evoked by successive stimuli during a single train divided by the mean amplitude (MA) of all movements evoked during the same train. This ratio is defined as long as some movement is generated (i.e. MA ≠ 0), and has lower and upper bounds. Zero is the theoretical lower bound, and occurs when all movements have the same amplitude. In practice, system noise will result in a positive lower bound. In the limit of large n, the upper bound approaches 2, which indicates a maximum modulation depth (see Appendix for proof).
Results
Repetitive stimulation of the MCtx creates a situation in which periodic activity originating there can interact with other neuronal oscillatory systems involved in the generation of movement. The output (in this case, whisker movements) of such a system of interacting oscillators should exhibit specific patterns that reflect the characteristics of the oscillators. In particular, the amplitude of the response should be frequency dependent, and distinct entrainment patterns should be observed for different stimulus frequencies. Below we first give a general description of the evoked movements followed by a detailed analysis of their frequency-dependent characteristics. Then we describe results that indicate that the olivocerebellar system is one of the oscillators that comprise this system.
General characteristics of MCtx-evoked whisker movements
Whisker responses to MCtx stimulus trains (train duration, 4–5 s; pulse duration, 100 μs; pulse frequency, 5–27 Hz) consisted of rapid movements evoked by individual pulses that were sometimes superimposed on two slowly developing movement trends. The first trend was a gradual increase in amplitude as the train progressed (see Figs 8C and 10). In some cases, after an initial increase in movement size, the average amplitude could plateau or decrease (see Fig. 4). Second, a gradual shift in the rest position of the whisker could occur during the stimulus train (see Fig. 3A). This shift could be in either the protraction or retraction direction, and usually occurred in most or all whiskers simultaneously, and thus probably relates to a progressive movement or deformation of the vibrissal pad as a whole by the extrinsic vibrissal muscles (Wineski, 1985). Because of their long time courses (on the order of seconds), neither of these slow movements interfered with the analysis of the rapid movements, which are the main focus of the paper.
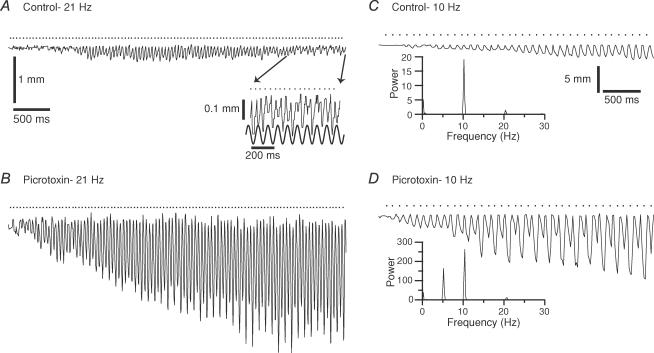
Figure 8. Intra-IO picrotoxin injections alter movement trajectory patterns.
A, trajectory of a whisker during 21 Hz MCtx stimulation before the injection of picrotoxin. The movements are small, and no sustained alternation pattern is observed until the last second of the stimulus train (inset). Scale bars in A are also for B. B, trajectory of same whisker as shown in A during an identical 21 Hz MCtx stimulus train following the intra-IO injection of picrotoxin. C–D, movement trajectories during 10 Hz MCtx stimulation from a different experiment in control (C) and following intra-IO injection of picrotoxin (D). Periodograms of the trajectories are shown as insets. Note the appearance of a peak at 5 Hz in the picrotoxin condition. Calibration bars in C are also for D.
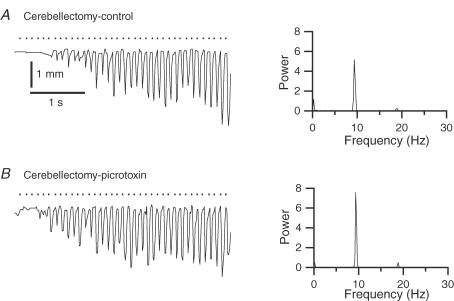
Figure 10. Intra-IO injections have no effect on MCtx-evoked whisker movements in chronically cerebellectomized animals.
A, response of a whisker to 10 Hz stimulation in control (retraction downward). The periodogram on the right reflects the 1: 1 response to MCtx stimulation. B, response of same whisker as in A to an identical 10 Hz stimulus train after intra-IO injection of picrotoxin. Scale bars in A are for A and B.
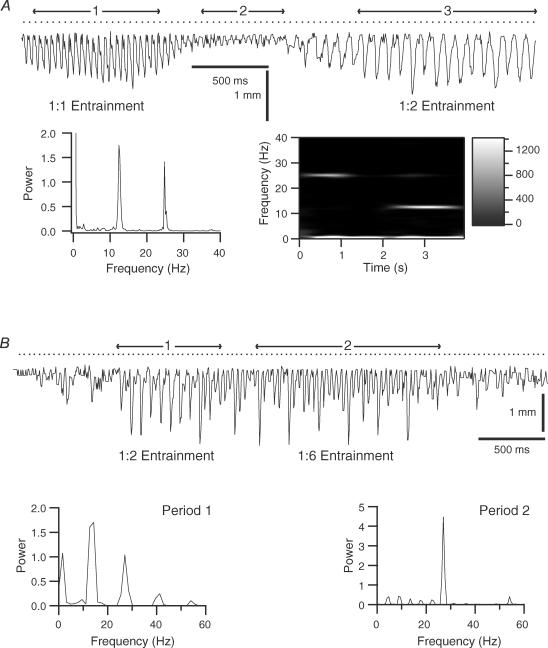
Figure 4. Alternative movement patterns evoked by high frequency MCtx stimulation.
A, response to 25.4 Hz train. The trajectory is divided into three epochs: (1) an initial period in which each stimulus evoked a movement, (2) a period in which the stimuli are largely ineffective, and (3) a period in which every other stimulus evokes a movement. The periodogram shows peaks at the stimulus frequency and the first subharmonic. The Wigner plot shows that these peaks result from the different response patterns during periods 1 and 3. Note the near absence of power at the subharmonic and stimulus frequencies in the Wigner plot between 1.25 and 2.0 s, which corresponds to period 2. B, response to a 26.6 Hz stimulus train. Two distinct response patterns appear in this trajectory. In period 1, large movements are evoked by every other stimulus. In period 2 large movements are evoked by every sixth stimulus. Periodograms from periods 1 and 2 reflect the differing response patterns.
Figure 3. Whisker movements evoked by MCtx stimulation at various frequencies.
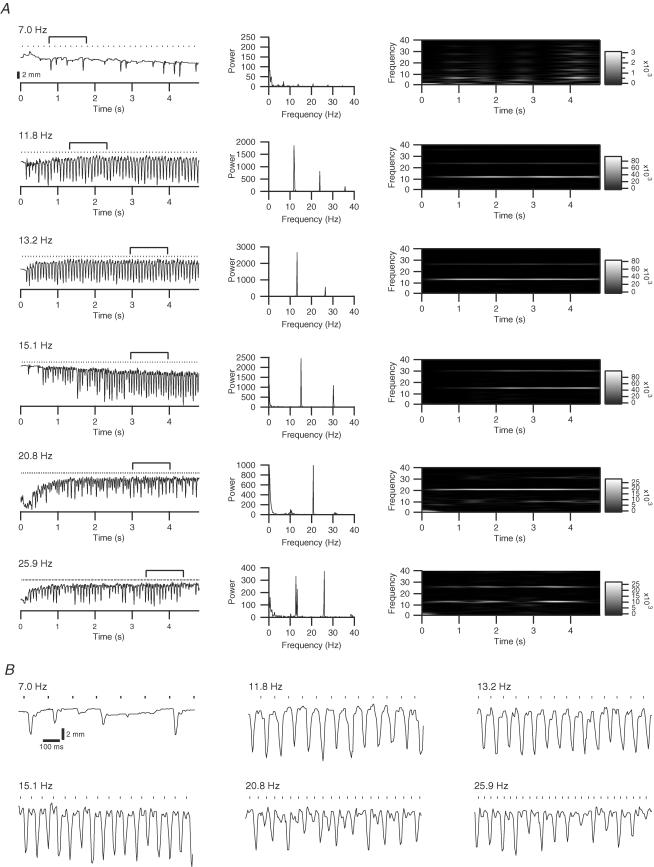
A, left column: trajectories of a whisker during 5-s long stimulus trains at frequencies ranging from 7 to 25.9 Hz. Numbers above each trace indicate stimulus frequency. In this, and all subsequent, figures dots above a trajectory indicate times of stimuli during a train. Amplitude calibration bar under the 7.0 Hz trace is for all trajectories in the column. Trajectories reflect raw data without baseline subtraction. Middle and right columns: periodograms and Wigner plots of the trajectories, respectively. B, portion of each trajectory in A (indicated by bracket) at an expanded scale to show the response patterns more clearly.
Rapid movements, in most cases (13 of 15 experiments), consisted of an initial protraction or retraction followed by a return to the whisker's approximate starting position. A third pattern (2 of 15 animals), not included in the analysis because of its complex trajectory, comprised an initial deflection followed by movement in the reverse direction to a point significantly past its starting position followed by a second reversal and an eventual return to the start position. Rapid movements of a given whisker occurred at a relatively constant latency from the preceding stimulus, but could vary between whiskers or animals. Video records (temporal resolution 4 ms) showed a clear deflection from rest occurred between 16 and 24 ms (6 different animals). Similar latencies were also obtained using a photo-emitter/sensor device (temporal resolution 1 ms) placed just rostral to a whisker (24.6 ± 4.2 ms; n = 858 movements; 3 animals), and correspond to values obtained using EMG recordings (Berg & Kleinfeld, 2003). The similarity of these values indicates that preparation of the whisker for videotaping did not significantly alter the onset of its response to MCtx stimulation.
MCtx-evoked movements have similar kinematics to those of spontaneous whisks
Rapid, stimulus-locked movements evoked by MCtx stimuli resembled spontaneous whisks, consistent with previous EMG results (Berg & Kleinfeld, 2003). Their duration ranged between 25 and 60 ms (n = 28 whiskers; 8 animals), with most of the variability reflecting interanimal differences. However, for most whiskers (70%), duration did depend weakly on stimulus frequency. Overall, movement duration and stimulus frequency showed a small negative correlation (−0.83 ms Hz−1, r =−0.33, P = 0.0038). No systematic variation of duration during the progression of an individual stimulus train was observed.
Evoked movement amplitudes and velocities were measured from peristimulus trajectories (n =∼11 200 movements, 25 whiskers, 4 rats). Average amplitude (measured as the whisker's position at the time of the stimulus to the peak of the deflection) varied with stimulus frequency (see next section); however, the maximum average movement amplitude for any stimulus frequency was 8.9 mm (23.9 deg). The single largest movement in the data set was 22.0 mm (47.7 deg). These values fall well within the normal range of whisking in behaving animals (Carvell & Simons, 1990; Gao et al. 2001).
The velocity profiles of the evoked whisker movements were also similar to those for spontaneous movements reported previously (Carvell & Simons, 1990; Gao et al. 2001; Sachdev et al. 2002). For example, the mean protraction and retraction velocities were 697.5 ± 638.1 deg s−1 and 776.4 ± 612.0 deg s−1 (n = 1660 whisks, 10 whiskers, 3 rats), respectively, with maximal velocity occurring near the midpoint of the movement in both cases; and retraction velocity was significantly greater than protraction velocity (P < 0.0001). Although these average velocities are somewhat lower than those reported for spontaneous movements, this difference primarily reflects the combined facts that (1) movement velocity is correlated with amplitude for evoked and spontaneous movements, and (2) the evoked movements that were analysed were smaller on average than spontaneous movements.
In sum, the evoked whisker movements were similar to small whisks made by rats, and are thus well within the design capabilities of the vibrissal apparatus and the neuronal systems that control its activation.
Movement amplitude shows a bell-shaped variation with stimulus frequency
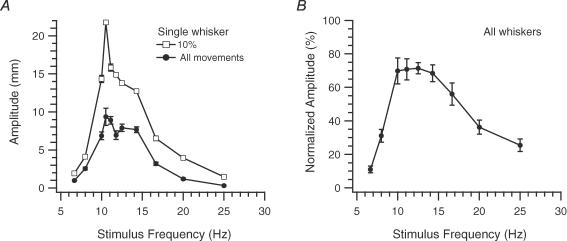
MCtx stimulus trains with frequencies ranging from 5 to 27 Hz were delivered, and the average amplitude of the rapid movements during each train was measured from peristimulus trajectories (n = 40 whiskers, 7 rats). Plots of average whisker amplitude as a function of stimulus frequency produced bell-shaped curves in 90% of cases (36/40), with the resonance peak at 11.5 ± 2.3 Hz (n = 36). Figure 2 shows a bell-shaped frequency response curve from a single whisker (Fig. 2A, filled circles) and the averaged, normalized population response from whiskers showing bell-shaped curves (Fig. 2B). For three of the remaining whiskers, stimulus frequencies below 14 Hz evoked little to no movements, but with higher frequencies (14–27 Hz) average movement amplitude first increased with stimulus frequency and then plateaued. The last whisker had a bimodal response curve.
Figure 2. Amplitude of MCtx-evoked movements varies with stimulation frequency.
A, plot of average movement amplitude as a function of stimulation frequency for a single whisker. Averages taken from all movements (All, •), and the top 10% (□) at each frequency. B, plot of normalized average movement amplitude as a function of stimulus frequency for all whiskers (n = 36). Normalized amplitudes for each whisker were obtained by expressing the average amplitude at each frequency as a percentage of the average amplitude at the stimulus frequency that evoked the largest average movement. Error bars indicate s.e.m.
Examination of the whisker trajectories during individual stimulus trains showed that the drop in average movement amplitude for high (> 16 Hz) and low (< 10 Hz) frequency stimulus trains reflected two factors: increases in the failure rate (i.e. the percentage of stimuli that failed to evoke movements or evoked only small movements– see next section) and a general decrease in movement amplitude. The importance of the second factor was shown by excluding the failures by comparing the largest movements (top 10th percentile) evoked at each stimulus frequency. Frequency response curves from these movements were still bell-shaped (Fig. 2A, open squares).
Whisker trajectories exhibit harmonic and subharmonic entrainment patterns
The trajectories of 27 whiskers (n = 6 rats) during MCtx stimulation were examined for interstimulus variations in the rapid movements indicative of specific entrainment patterns. Three main frequency ranges were distinguished based on the patterns observed in the trajectories: < 10 Hz, 10–15 Hz, and > 15 Hz.
Cortical stimuli below 10 Hz tended to be relatively ineffective. The stimuli of these trains often failed to entrain the whisker movements consistently, as shown by the sporadic responses to 7 Hz stimulation (Fig. 3A: 7.0 Hz, left column), and by the lack of dominant peaks in the periodogram (middle column). Brief periods of entrainment could occur, as reflected by the transient increases in 7 Hz power in the Wigner plot (right column); however, even in these periods, the absolute power is quite small in comparison to that obtained with higher frequencies.
In contrast, stimulus frequencies from 10 to 15 Hz produced 1: 1 entrained whisker movements, with neighbouring stimuli generally evoking movements of similar amplitude (Fig. 3: 11.8, 13.2 and 15.1 Hz). Some fluctuation of movement amplitude, and even occasional failures (or near failures) could occur during a stimulus train. However, there was no regularity to these fluctuations because the corresponding periodograms had dominant peaks only at the stimulus frequency and its higher harmonics, and the Wigner plots showed high power levels only at these same frequencies.
Still higher stimulus frequencies (> 15 Hz) also entrained whisker movements, but often did so both with harmonic (1: 1) and subharmonic patterns. Most commonly 1: 2 entrainment occurred, consisting of alternating large and small amplitude movements (Fig. 3A and B: 20.8 and 25.9 Hz), which resulted in significant power at one-half the stimulus frequency in addition to the stimulus frequency (Fig. 3A, right column, 20.8 Hz and 25.9 Hz).
All whiskers (n = 27) showed evidence of 1: 2 entrainment at frequencies in this higher range in the forms of a peak in their periodograms at the first subharmonic of the stimulus frequency and periods of high power at the subharmonic in the Wigner plots. However, the strength of this entrainment varied considerably. The height of the subharmonic peak as a percentage of the harmonic ranged from ∼1% to ∼155% (average, 34.5 ± 40.7%, n = 27). The 34.5% average percentage in large part reflects the fact that 1: 2 entrainment usually was prominent for only part of the stimulus train. Indeed, a common response pattern to the high frequency trains (observed in 11/27 whiskers to at least one stimulus frequency) was an initial period of 1: 1 entrainment followed by a period of relatively weak responding followed by a period of 1: 2 entrainment (Fig. 4A).
Thus, entrainment at higher frequencies was not stable. Nevertheless, during a period of 1: 2 entrainment, the modulation depth was strong enough that the power at the subharmonic frequency was usually greater than that at the harmonic (16 of 27). Such periods of strong 1: 2 entrainment could appear at any point during the train, and typically lasted between 1 and 2 s.
Although 1: 2 subharmonic entrainment was the most common response pattern observed with higher stimulus frequencies, other ratios were also observed. One example is shown in Fig. 4B, where an ∼27 Hz train produced both a period of 1: 2 entrainment (Fig. 4B, period 1) and a subsequent period of 1: 6 entrainment in which large movements were separated by five small amplitude responses (Fig. 4B, period 2). Comparison of the periodograms from these two periods show a peak at the first subharmonic of stimulus frequency during period 1 and peaks at lower subharmonics during period 2. Trajectories showing 1: 3 and 1: 4 entrainment patterns were also observed (data not shown). In general, entrainment ratios higher than 1: 2 with 20–27 Hz stimulation were relatively rare and were observed in only a few whiskers in each case.
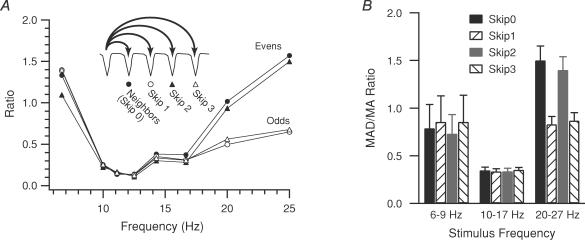
MAD/MA ratios (see Methods for definition) were used to further quantify the different response patterns. This ratio essentially measures the relative amplitude variation of successive movements evoked by stimuli separated by a fixed number of intervening stimuli. The pattern of MAD/MA ratios can be used to distinguish different entrainment patterns. For example, when 1: 1 harmonic entrainment is the predominant pattern, the absolute differences in movement amplitude are small, and the MAD/MA ratio will tend toward zero. In contrast, when a 1: 2 subharmonic pattern is present, with a modulation depth of 100%, the absolute amplitude differences of movements evoked by successive stimuli, or of those separated by even numbers of intervening stimuli, should be large compared to the average movement amplitude, and result in a MAD/MA ratio that approaches 2 (see Appendix for proof), whereas amplitude differences for movements evoked by stimuli separated by odd numbers of stimuli should be small, and lead to a smaller ratio. Lastly, when the variability in movement is large, but does not follow a regular pattern, the MAD/MA ratio should be similarly large regardless of the number of intervening stimuli.
For the whisker trajectories shown in Fig. 3, the MAD/MA ratios are plotted as a function of stimulus frequency in Fig. 5A. As can be seen the patterns of MAD/MA ratios distinguish the three response patterns: random at low frequencies (all ratios high), 1: 1 entrainment at intermediate frequencies (all ratios low), and 1: 2 entrainment at high frequencies (only even ratios high).
Figure 5. Measurement of movement amplitude variability as a function of stimulus frequency.
A, MAD/MA ratio plotted as a function of stimulus frequency for the whisker shown in Fig. 3. The ratio was calculated for movements evoked by successive (skip 0) stimuli, and for those evoked by stimuli separated by 1, 2, or 3 intervening stimuli (skip1–3). Filled symbols indicate ratios where an even number of intervening stimuli were skipped (0 or 2) and open symbols indicate ratios where an odd number of stimuli were skipped (1, 3). B, average MAD/MA ratios calculated from 20 whiskers. Stimulus trains were divided into three groups according to stimulus frequency (6–9, 10–17, and 20–27 Hz). Number of stimulus trains in each frequency group are: low, 7; intermediate, 104; high, 30. Error bars indicate s.e.m.
MAD/MA ratios for neighbouring movements, and for those in which 1, 2, or 3 intervening stimuli were skipped, were calculated for 20 whiskers for stimulus trains of 6–25 Hz and then grouped into low (6–8 Hz), intermediate (10–17 Hz), and high (20–25 Hz) frequency ranges. The distinct ratio patterns for each frequency range are shown in Fig. 5B. In the intermediate range all ratios are low (1: 1 entrainment). At low frequencies all ratios are elevated, suggestive of a random pattern; however, the low frequency ratios were not significantly higher than those of the intermediate range (P > 0.05). In contrast, for high frequencies, the even ratios (black and grey bars, skip 0, 2) were significantly higher than the odd ratios (striped bars, skip 1, 3), indicating a dominant 1: 2 entrainment pattern (P < 0.003 for all comparisons).
Localizing the source of the oscillatory modulation
Whereas the amplitude modulation characteristics of MCtx-evoked whisker movements are consistent with the modulation being due to the action of the olivocerebellar system, other possibilities must be considered: for example, variations in excitability in other whisker-related brain regions (including the MCtx itself), limitations of the neuromuscular apparatus, and mechanical resonance properties of the vibrissae. The experiments described below test these possibilities, and provide evidence for the olivocerebellar system's participation in the modulatory phenomena described earlier.
Absence of resonance and subharmonic entrainment with facial nerve stimulation
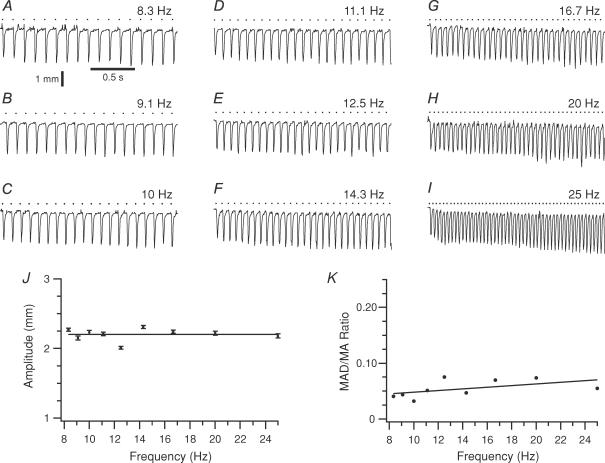
Because of the similarity of the evoked movements to spontaneous movements it is unlikely that limitations of the vibrissal apparatus are the cause of the frequency-dependent phenomena described above. Nevertheless, this possibility was directly tested by evoking whisker movements with facial nerve stimulation (8.3–25 Hz trains) following transection of the nerve to remove CNS influences. In all cases (n = 16 whiskers; 2 rats), the whiskers faithfully responded in a one-to-one manner to the stimuli with a latency of ∼4 ms, regardless of the frequency of the train.
In contrast to the trajectories generated by MCtx stimulus trains, those generated by facial nerve stimulation showed no frequency-dependent changes in movement amplitude (Fig. 6A–I). Similar, virtually flat frequency response curves were obtained for all 16 whiskers (Fig. 6J). For 13 of 16 whiskers there was no statistically significant correlation (P > 0.05) between movement amplitude and stimulus frequency. For the three remaining whiskers, the strength of the relationship was weak: the largest regression line slope was only 0.03 ± 0.003 mm Hz−1. For the population, the regression line slope averaged 0.010 ± 0.011 mm Hz−1 (n = 16).
Figure 6. Movements evoked by facial nerve stimulation do not display an ∼10 Hz amplitude modulation.
A–I, movement trajectories of a whisker during facial nerve stimulation at frequencies from 8.3 to 25 Hz. Downward deflections indicate protractions. Calibration bars in A are for A–I. J, plot of average movement amplitude as a function of stimulus frequency. The regression line slope (8.4 × 10⁻⁵± 5.8 × 10⁻³ mm Hz−1) was statistically indistinguishable from zero. Error bars indicate s.e.m.K, plot of MAD/MA ratio for successive movements as a function of stimulus frequency.
The absence of any subharmonic entrainment patterns regardless of stimulus train frequency is also apparent from Fig. 6A–I. The MAD/MA ratio for neighbouring movements confirmed this observation with its low values (< 0.10) that did not vary significantly with stimulus frequency (Fig. 6K). For all whiskers, the MAD/MA ratios for the low, intermediate, and high frequency ranges were 0.072 ± 0.023 (n = 14 trains), 0.116 ± 0.064 (n = 55 trains), and 0.118 ± 0.064 (n = 32 trains), respectively. Neither the high nor low frequency range was statistically greater than the intermediate range, in contrast to what was found for MCtx-evoked movements.
MCtx- and facial nerve-evoked vibrissal movements were compared for the same whiskers in one animal by recording the responses to MCtx stimulation prior to transection of the facial nerve. MCtx-evoked movements showed significantly more variation during each stimulus train and frequency-dependent entrainment patterns, whereas the facial nerve-evoked movements were highly uniform regardless of stimulus frequency (data not shown).
Intra-olivary injection of picrotoxin modifies evoked movement patterns
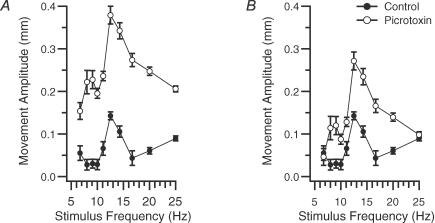
Intra-IO picrotoxin injections were used to test whether the olivocerebellar system underlies the oscillatory modulation of the MCtx-evoked movements. Such injections increase the firing rate, synchronization, and rhythmicity of olivocerebellar activity (Lang et al. 1996). Thus, they should also alter the evoked whisker movements, if the olivocerebellar system is the source of their frequency dependence. Intra-IO picrotoxin injections were made in five normal rats (n = 30 whiskers). In 29 of 30 whiskers the injection led to a large, statistically significant increase in the amplitude of the evoked movements (P < 0.006 for each of the 29 whiskers measured at 10 Hz, 20 Hz, or at the peak of the frequency response curve). Overall, the picrotoxin injections produced a 2- to 4-fold increase in movement amplitude. That increases were observed at all tested frequencies is consistent with the increase in IO excitability and synchrony caused by picrotoxin injection. Reflecting the increase in movement amplitude, the baselines of the picrotoxin frequency response curves were shifted upward (Fig. 7A).
Figure 7. Intra-IO picrotoxin alters frequency response curves of MCtx-evoked whisker movements.
A, frequency response curve in control (•) and during IO picrotoxin injection (s). Error bars are s.e.m. Note the change in curve shape (unimodal versus bimodal) caused by picrotoxin in addition to its effect to increase the overall height of the curve. B, same curves as in A except that the picrotoxin curve has been shifted to the same baseline as the control curve.
However, as importantly, picrotoxin also altered the shape of the frequency curve (n = 8 whiskers, 2 rats) beyond simply increasing the baseline. This is shown in Fig. 7B, where the picrotoxin curve has been shifted to the same baseline as the control curve. Comparison of these curves shows that picrotoxin produced a higher resonance peak. On average picrotoxin approximately doubled the height of the primary (original) resonance peak relative to the curve baseline (P = 0.02, n = 8). Another common change (63% of curves) was the appearance of a second peak at lower frequencies in the response curve (Fig. 7).
In addition to altering the resonance peak structure, intra-IO injection of picrotoxin enhanced and stabilized the subharmonic entrainment patterns observed during high frequency stimulus trains (20 whiskers, 3 animals). For each animal, periodograms from the individual whisker trajectories were generated for the control and picrotoxin conditions for 20 and 25 Hz stimulation. In every case, the average power at the subharmonic of the stimulus frequency increased significantly with picrotoxin (20 Hz stimulation, P = 0.004, n = 20; 25 Hz stimulation, P = 0.011, n = 20). An example of the change is shown in Fig. 8A and B. In control, the evoked movements did not exhibit a prominent alternating pattern during most of the train (Fig. 8A), although a low amplitude but well sustained modulation occurred during the last second of the train (Fig. 8A, inset). In contrast, following picrotoxin, a clearly visible alternation pattern was present throughout most of the train (Fig. 8B).
Intra-IO injection of picrotoxin can also slow the oscillation frequency of IO neurones (Lang et al. 1996). Following picrotoxin injection, whisker movements evoked by 10 Hz MCtx stimulation sometimes showed periods of 5 Hz modulation (n = 2 of 5 rats). An example is shown in Fig. 8C and D. Here, a 10 Hz stimulus train applied before the injection produced a typical trajectory in which neighbouring movements had similar amplitudes, with a slow trend toward larger amplitudes (Fig. 8C). In contrast, after intra-IO injection of picrotoxin, an identical train produced a trajectory consisting of alternating large and small movements, indicating a 5 Hz modulation (Fig. 8D). The change in movement patterns is reflected in the periodograms by the appearance of a peak at 5 Hz with picrotoxin (Fig. 8C and D, insets).
Cerebellectomies alter the frequency dependence of MCtx-evoked whisker movements
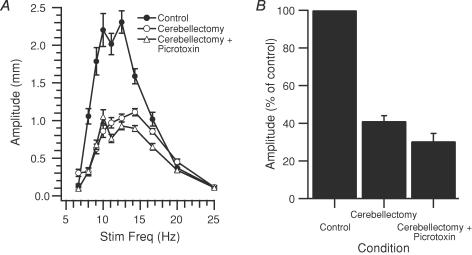
As a second approach to localizing the source of the modulation, the patterns of MCtx-evoked movements were investigated following cerebellectomy (34 whiskers, 4 rats). In two animals (12 whiskers) the amplitudes of MCtx-evoked movements were compared before and shortly (∼30 min) after cerebellectomy. Prior to cerebellectomy the frequency response curves were bell-shaped, as already described. Following cerebellectomy, MCtx stimulation evoked movements that were significantly reduced in amplitude, and while the frequency response curves remained bell-shaped, they were flatter than in control in all 12 cases. An example of the change in the frequency response curve is shown in Fig. 9A (compare filled and open circles). For the population, the amplitude of the normalized frequency response curve peak post-cerebellectomy was, on average, only ∼40% of the pre-cerebellectomy amplitude (41 ± 10.8% P = 1.0 × 10⁻⁹; Fig. 9B).
Figure 9. Acute cerebellectomy reduces frequency dependence of movement amplitude.
A, plot of average movement amplitude for one whisker as a function of stimulation frequency. MCtx-evoked movements were measured before (Control, •) and after cerebellectomy (Cerebellectomy, ○), and after cerebellectomy and the injection of picrotoxin into the IO (Cerebellectomy + Picrotoxin, ▵). B, amplitude of movements evoked at peak of frequency response curve in each condition. Movement amplitudes for each whisker in each condition expressed as a percentage of the control condition value. Columns are the averages of 12 whiskers. Error bars indicate s.e.m.
To test whether the effects of the picrotoxin injections in normal animals described earlier were due to spread of the drug to regions outside the IO, injections were made in cerebellectomized rats. Movements were elicited by MCtx stimulation ∼15 min after the start of the injection at which time 1–1.5 μl had been injected. In contrast to normal animals, in cerebellectomized ones picrotoxin injection had little to no effect on MCtx-evoked movements. Specifically, frequency response curves following picrotoxin injection were almost unchanged from the initial post-cerebellectomy curves (Fig. 9A, compare open circles and triangles). The average peak amplitude (n = 12 whiskers) of the picrotoxin curves was not significantly different from that of the cerebellectomy condition (P > 0.05; Fig. 9B). In one animal the injection was continued for ∼40 min until ∼4 μl had been injected, and in this case movement amplitudes did finally increase from post-cerebellectomy levels; however, they still remained at or below control levels, and the increases occurred only for low frequency (5–11 Hz) stimulus trains.
As it is possible that the lack of effect of picrotoxin in the acutely cerebellectomized animals reflected some sort of shock state that rendered the circuits involved in whisker movements relatively insensitive (yet MCtx stimuli did evoke movements), intra-IO picrotoxin injections were made in two chronically cerebellectomized rats. The whisker trajectories evoked by 10 Hz stimulus trains in these animals were compared before and after injection (n = 22 whiskers, 2 rats), and picrotoxin was found to have no effect on movement amplitude (average difference =−0.04 ± 0.36 mm (control–picrotoxin); P = 0.606). The trajectories of one whisker are shown to illustrate this lack of effect in Fig. 10A and B. Note also that a ∼5 Hz oscillation did not appear following picrotoxin in these animals.
Complex spike activity patterns match evoked whisker movement trajectories
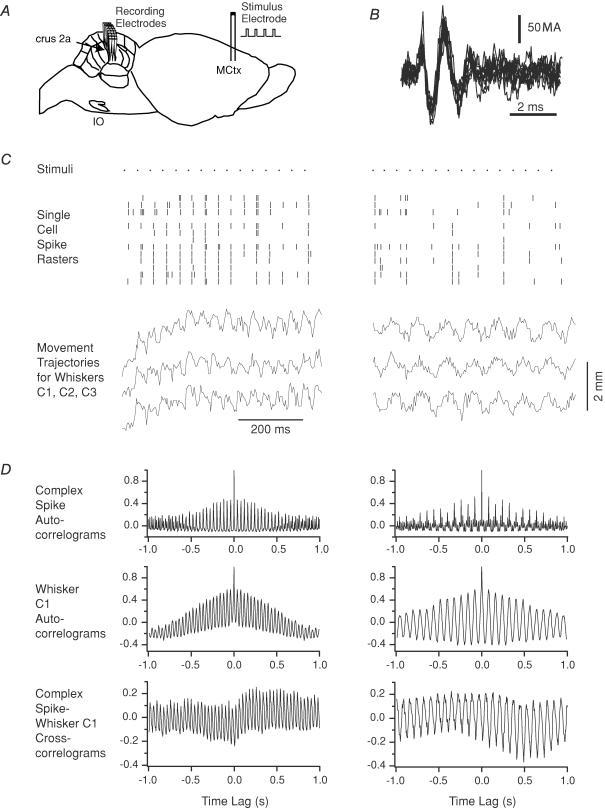
Multiple electrode recordings were obtained of complex spike activity during MCtx-evoked whisker movements in two animals (n = 24 Purkinje cells, 12 whiskers; Fig. 11A), to determine whether complex spike and evoked whisker movement patterns are temporally related. Virtually identical results were obtained in both experiments. Each complex spike (Fig. 11B) was treated as a single event whose time of occurrence was defined by the time of its initial deflection. Complex spike and evoked whisker movement patterns were tested at several frequencies (10, 20 and 25 Hz); however, the most illustrative examples of the tight correlation between olivocerebellar activity and whisker movements come from higher stimulus frequency trains. Two portions from a 25 Hz stimulus train are shown in Fig. 11C. Here, the stimuli are indicated by the top row of dots and the complex spikes are marked by the vertical lines in the rasters. Below the rasters are shown the trajectories from three whiskers. During the initial portion of the train (left raster and set of trajectories), whisker movements and complex spikes were evoked by each stimulus (1: 1 entrainment); however, later in the same train, movements and complex spikes were evoked by only every other stimulus (1: 2 entrainment; right raster and set of trajectories). The consistent relationship, in each portion of the stimulus train, of the stimuli to the complex spikes and whisker movements is shown by the autocorrelograms (Fig. 11D). The autocorrelograms on the left side of Fig. 11D are from the period in which there was 1: 1 entrainment and have peaks every 40 ms, whereas the autocorrelograms on the right side of the figure are from the 1: 2 entrainment period and have peaks at 80 ms intervals. Moreover, crosscorrelograms between the summed evoked complex spike activity and the whisker trajectories show a strong relationship between the two (Fig. 11D, bottom row).
Figure 11. Complex spike activity during MCtx stimulation parallels evoked movement patterns.
A, schematic diagram of a rat brain showing the experimental arrangement: bipolar stimulation electrode in MCtx and microelectrodes in crus 2a for recording complex spike activity. B, extracellular recording of complex spikes from one electrode. Ten traces overlapped. C, complex spike responses and whisker trajectories evoked by MCtx stimulation at 25 Hz. The responses to two separate periods during the same stimulus train are shown. The dots on the top row (Stimuli) indicate the times of the stimuli. Immediately below the stimuli are rasters showing the times of the evoked complex spikes. Each row in the raster displays the complex spike times (vertical tick marks) from a single Purkinje cell. In this experiment, complex spikes were recorded from 12 Purkinje cells simultaneously. Below the rasters, the trajectories for three whiskers (C1, C2 and C3) are shown. The time scale under the whisker trajectories also applies to the rasters. D, autocorrelograms of the population complex spike activity and of the trajectory of whisker C1 and the crosscorrelogram of the trajectory and spike activity are shown for the two periods.
Discussion
The present results provide evidence for two major conclusions. First, there is a central ∼10 Hz oscillatory mechanism that gates the ability of MCtx to produce movements. Second, the olivocerebellar system is an important component of this gating mechanism. These points are discussed in detail below.
Oscillatory modulation of MCtx evoked whisker movements
Long duration, voluntary movements have been shown to be composed of submovements that reoccur in a periodic fashion at ∼10 Hz (Vallbo & Wessberg, 1993; Doeringer & Hogan, 1998; Kakuda et al. 1999; McAuley et al. 1999a; Marsden et al. 2001; Jaberzadeh et al. 2003). Moreover, both normal physiological tremor, and abnormal tremors are common, and, at least in part, are caused by rhythmic activity originating within the CNS (Elble & Koller, 1990). Such phenomena suggest that there are CNS regions that generate intrinsic oscillatory activity that aids in the timing of muscle activation.
To investigate whether the MCtx interacts with CNS oscillators in generating movements, repetitive stimulation was used to generate a rhythmic outflow from the MCtx that would both evoke movements and drive these hypothetical oscillators. If the activity of the latter contributed to the motor command, the resulting movement patterns should have certain characteristics indicative of a system in which one oscillator drives a second: in particular, a resonance peak in the frequency response curve, and entrainment or ‘beat’ patterns.
Both phenomena were observed for MCtx-evoked whisker movements in the present study, and thus provide evidence for the involvement of an oscillator in modulating MCtx evoked movements. Indeed, the depth of modulation observed in the entrainment patterns during higher frequency stimulation was often quite large, and sometimes there was a complete loss of alternate movements such that movements were occurring only at ∼10–12 Hz despite a stimulus frequency of 20–25 Hz (e.g. Fig. 4A, period 3 and Fig. 11B). Note that this abolition, and many other cases of near abolition, occurred despite the synchronous and powerful excitation of MCtx provided by the stimuli. Thus, in a sense, the oscillator is acting like a gate that helps determine the times at which MCtx activity can readily produce movements.
The results also provide evidence regarding the characteristics of the oscillator. For example, the resonance peak in the frequency response curves suggests that the oscillator has a natural frequency in the 10–15 Hz range. Further, the fact that a particular entrainment pattern was dominant over a range of frequencies, rather than different patterns existing for each stimulus frequency, points to the non-linear nature of the underlying oscillator, as linear oscillators show frequency-specific beat patterns when driven by an external source (French, 1971). The temporal ordering of the entrainment patterns during the stimulus trains also is indicative of a non-linear oscillator, and provides information about its stability. For example, linear oscillators initially respond to external driving forces at their natural frequency, but ultimately produce output at the driving frequency (French, 1971). In contrast, the whisker trajectories often showed the reverse pattern during high frequency stimulation, i.e. an initial 1: 1 entrainment followed by a switch to a subharmonic entrainment pattern. Moreover, the commonness of transitions between entrainment patterns, and the disappearance and reappearance of patterns during a train indicate that the oscillator is not stable.
The olivocerebellar system contributes to the oscillatory modulation
The question then arises as to the location or structures responsible for the observed oscillatory modulation of MCtx-evoked movements. A peripheral location is ruled out by the absence of subharmonic entrainment patterns and flat frequency response curves for facial nerve evoked movements. Thus, the modulation most likely results from a central oscillator. However, many CNS regions display rhythmic activity, and in particular, a brainstem CPG has been suggested to underlie rhythmic whisker movements (Carvell et al. 1991; Miyashita et al. 1994; Miyashita & Mori, 1995; Kleinfeld et al. 1999; Gao et al. 2001; Hattox et al. 2003, 2002). Nevertheless, the neocortex and cerebellum also appear to have important roles in generating whisker rhythmicity because local field potentials in MCtx can be phase-locked with vibrissal EMG (Ahrens & Kleinfeld, 2004), and lesions of MCtx, cerebellum, or IO alter the rhythmicity of whisking movements (Semba & Komisaruk, 1984; Gao et al. 2003).
The present results provide further evidence of the importance of the cerebellum, and the olivocerebellar system in particular, in the generation of whisker movements. Identification of the IO as a major contributor to the oscillatory modulation of MCtx-evoked movements rests on several lines of evidence obtained here. First, a close correlation was observed between the evoked movement patterns and complex spike activity in crus 2a. MCtx-evoked complex spike activity has frequency response curves and entrainment patterns similar to those observed here for whisker movements (Marshall & Lang, 2004). Moreover, during high frequency (∼25 Hz) trains, complex spike entrainment patterns were shown directly to mirror those observed in the whisker movements.
The characteristics of MCtx-evoked complex spike patterns are due to the properties of the IO neurones themselves, rather than reflecting sensory feedback, because these same patterns occur in paralysed animals, and because intra-IO injections of drugs that alter IO rhythmicity produce congruous changes in the patterns (Marshall & Lang, 2004). Latency considerations also seem to preclude a sensory feedback explanation: MCtx-evoked complex spikes typically occur at a latency of ∼15 ms, whereas whisker movements have longer latencies and complex spikes evoked by tactile stimulation of the face have a latency of 20–35 ms. Another possible explanation, namely that the evoked complex spike activity represents an efference copy, cannot be ruled out, but leaves unexplained the effects of the intra-IO injections and cerebellectomies on the evoked whisker movements. In sum, taken together the present and previous results demonstrate a strong correlation between MCtx-evoked whisker movements and complex spike patterns.
The results of the cerebellectomy and IO injection experiments provide two additional lines of evidence that the olivocerebellar system contributes to the oscillatory gating of MCtx-evoked movements. First, the shape of the frequency response curves for the evoked movements were significantly flattened by cerebellectomy. Thus, most, but not all, of the resonance peak was related to cerebellar mediated activity. That some of the peak remained suggests other oscillatory systems also contribute to the resonance phenomenon observed here. Second, intra-IO injection of picrotoxin increased the amplitude of the resonance peak between 10 and 15 Hz in absolute and relative terms; caused the appearance of a second peak at lower frequencies; and altered the entrainment patterns. All of which are consistent with picrotoxin's known effects on coupling between IO neurones and the oscillatory behaviour of these cells (Lang et al. 1996). In sum, changing the activity patterns of IO neurones appears to produce corresponding changes in the MCtx-evoked movement patterns, suggestive of a causal relationship.
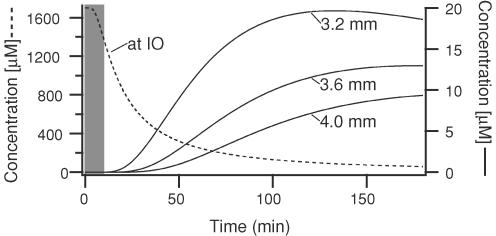
An important question is whether the effects on whisker movements of the picrotoxin injections can really be ascribed to changes in olivocerebellar activity. Histological controls showed that the injections were centred in the IO; thus, the major issue is whether there was sufficient spread of the drug to other brainstem sites (in particular, the facial nucleus) involved in whisker control to explain the effects of the injections. Several arguments can be made against this possibility. First, picrotoxin injections in acutely or chronically cerebellectomized animals did not produce the effects seen in normal animals, suggesting that the effects of the injection were mediated via cerebellar projecting structures, the most obvious candidate being the olivocerebellar system. Furthermore, the concentration profile of picrotoxin following pressure injection of 1 μl, calculated on the basis of eqn (11) of Nicholson (1985), is inconsistent with a direct action on the facial nucleus. The time courses of the concentration rise for three distances corresponding to the caudal border, centre and rostral border of the facial nucleus are shown in Fig. 12, and indicate that concentrations of picrotoxin in that nucleus are well below the IC50 for picrotoxin with respect to GABA-mediated currents (1–40 μm; Bowery & Brown, 1974; Sigel & Baur, 1988; Newland & Cull-Candy, 1992) at the times when whisker movements were measured (grey column). Moreover, these curves are likely to overestimate the true picrotoxin concentrations as they do not factor in the reduction due to binding to GABAA receptors. Finally, it is worth noting that in one experiment whisker movements in a cerebellectomized animal were also measured at ∼40 min post-injection, a point at which the theoretical curves suggest there should be significant block of GABAA receptors in the facial nucleus, and indeed, changes in MCtx-evoked movements were observed; however, these changes were limited to an increase in movement amplitude to low frequency stimulus trains, and thus did not mimic the changes found in normal animals.
Figure 12. Time course of picrotoxin diffusion from injection site.
Plot shows the expected concentration as a function of time after injection at the injection site (dashed line) and at three distances from the injection site (continuous lines). These distances correspond to the radial distance from the injection site to the caudal border (3.2 mm), centre (3.6 mm) and rostral border (4.0 mm) of the contralateral facial nucleus. Distances calculated from a stereotaxic atlas (Paxinos & Watson, 1998). Time zero indicates the completion of the injection. Gray area indicates times at which evoked movements were measured. Curves were obtained using eqn (11) of Nicholson (1985) with the following parameter values: a free diffusion coefficient = 5 × 10⁻⁶ cm2 s−1 (chosen on the basis of picrotoxin's molecular weight), tortuosity = 1.6, extracellular volume fraction = 0.2, injected volume = 1 μl, and concentration = 1 mg ml−1.
Thus, we conclude that picrotoxin's effects on whisker movements were not the result of a direct effect on the facial nucleus or on brainstem nuclei that project directly to the facial nucleus, but rather were due to its effect on IO activity.
The IO as a timing structure for motor coordination
In closing it may be relevant to address more generally the issue of temporal binding in the organization of motor acts and the role played by the olivocerebellar system. Given the number of alternatives that the motor system has available for the generation of movement, and the necessity of controlling large numbers of motor neurones to generate even the simplest of movements, the coherent issuance of motor commands at regular (∼100 ms) time intervals greatly reduces the solution space. This is of particular importance for multijoint movements, where movement about each joint bears on, and is influenced by, actions occurring at other joints. Here, the possibility of binding in time large muscle masses becomes central to coordination. It seems evident that a timing mechanism is needed. Indeed, as mentioned earlier, considerable experimental evidence has been obtained supporting the existence of periodic or intermittent motor commands that generate the submovements that comprise a complex limb movement (Vallbo & Wessberg, 1993; Doeringer & Hogan, 1998; Kakuda et al. 1999; McAuley et al. 1999b; Marsden et al. 2001; Jaberzadeh et al. 2003). We would suggest that a bout of whisking is analogous to a single complex movement of a limb, and therefore the individual whisks studied here correspond to the submovements.
The oscillatory behaviour of IO neurones has led to the suggestion that this system plays a role in securing temporally coherent activation in motor circuits (Llinás, 1991). Moreover, oscillatory olivocerebellar activity has been linked to motor acts by its presence during voluntary movements (Welsh et al. 1995; Smith, 1998), and during harmaline-induced tremor (de Montigny & Lamarre, 1973; Llinás & Volkind, 1973). The present results tying the ability of MCtx stimuli to evoke whisker movements to activation of the olivocerebellar system provide further evidence for this view. Finally, if one combines the oscillatory capabilities of IO neurones with their ability to dynamically form synchronously oscillating ensembles as a result of gap junctional coupling and neurotransmitter release within the IO (Llinás & Sasaki, 1989; Lang et al. 1996; Lang, 2001, 2002), there emerges a flexible system for transiently linking muscle groups into functional entities that underlie movement.
Acknowledgments
The authors wish to thank R. Bing for help with the video analysis. Funding was provided by grants from the NIH/NINDS (NS37028 and NS13742).
Appendix
Proof that the upper bound of the MAD/MA ratio approaches 2 as the number of evoked movements goes to infinity. First, we note that for any real numbers A and B,
| (1) |
Next, let Xj be the amplitude of the jth movement and dXj the difference between the amplitudes of the jth and (j– 1)th movements, where j = 1, …, n. Then, according to the definition of the MAD,
| (2) |
| (3a) |
| (3b) |
The sum of eqn (3b) for j = 1, …, n is,
| (4) |
Rearranging and adding and subtracting |Xn| to the left side,
| (5) |
Dividing by n gives,
| (6) |
Rearranging gives,
| (7) |
As n goes to infinity, the second term on the right side of eqn (7) goes to zero, which completes the proof.
References
- Ahrens KF, Kleinfeld D. Current flow in vibrissa motor cortex can phase-lock with exploratory rhythmic whisking in rat. J Neurophysiol. 2004;92:1700–1707. doi: 10.1152/jn.00020.2004. [DOI] [PubMed] [Google Scholar]
- Alexander GE, Crutcher MD. Preparation for movement: neural representations of intended direction in three motor areas of the monkey. J Neurophysiol. 1990a;64:133–150. doi: 10.1152/jn.1990.64.1.133. [DOI] [PubMed] [Google Scholar]
- Alexander GE, Crutcher MD. Neural representations of the target (goal) of visually guided arm movements in three motor areas of the monkey. J Neurophysiol. 1990b;64:164–178. doi: 10.1152/jn.1990.64.1.164. [DOI] [PubMed] [Google Scholar]
- Bartelt HO, Brenner K-H, Lohmann AW. The Wigner distribution and its optical production. Optics Comms. 1980;32:32–38. [Google Scholar]
- Berg RW, Kleinfeld D. Vibrissa movement elicited by rhythmic electrical microstimulation to motor cortex in the aroused rat mimics exploratory whisking. J Neurophysiol. 2003;90:2950–2963. doi: 10.1152/jn.00511.2003. [DOI] [PubMed] [Google Scholar]
- Bermejo R, Vyas A, Zeigler HP. Topography of rodent whisking. I. Two-dimensional monitoring of whisker movements. Somatosens Mot Res. 2002;19:341–346. doi: 10.1080/0899022021000037809. [DOI] [PubMed] [Google Scholar]
- Bowery NG, Brown DA. Depolarizing actions of γ-aminobutyric acid and related compounds on rat superior cervical ganglia in vitro. Br J Pharmacol. 1974;50:205–218. doi: 10.1111/j.1476-5381.1974.tb08563.x. [DOI] [PMC free article] [PubMed] [Google Scholar]
- Carvell GE, Simons DJ. Biometric analysis of vibrissal tactile discrimination in the rat. J Neurosci. 1990;10:2638–2648. doi: 10.1523/JNEUROSCI.10-08-02638.1990. [DOI] [PMC free article] [PubMed] [Google Scholar]
- Carvell GE, Simons DJ, Lichtenstein SH, Bryant P. Electromyographic activity of mystacial pad musculature during whisking behavior in the rat. Somatosens Mot Res. 1991;8:159–164. doi: 10.3109/08990229109144740. [DOI] [PubMed] [Google Scholar]
- Chapin JK, Moxon KA, Markowitz RS, Nicolelis MAL. Real-time control of a robot arm using simultaneously recorded neurons in the motor cortex. Nature Neurosci. 1999;2:664–670. doi: 10.1038/10223. [DOI] [PubMed] [Google Scholar]
- de Montigny C, Lamarre Y. Rhythmic activity induced by harmaline in the olivo-cerebello-bulbar system of the cat. Brain Res. 1973;53:81–95. doi: 10.1016/0006-8993(73)90768-3. [DOI] [PubMed] [Google Scholar]
- Doeringer JA, Hogan N. Intermittency in preplanned elbow movements persists in the absence of visual feedback. J Neurophysiol. 1998;80:1787–1799. doi: 10.1152/jn.1998.80.4.1787. [DOI] [PubMed] [Google Scholar]
- Elble RJ, Koller WC. Tremor. Baltimore: Johns Hopkins University Press; 1990. [Google Scholar]
- Evarts EV. Pyramidal tract activity associated with a conditioned hand movement in the monkey. J Neurophysiol. 1966;29:1011–1027. doi: 10.1152/jn.1966.29.6.1011. [DOI] [PubMed] [Google Scholar]
- Evarts EV. Relation of pyramidal tract activity to force exerted during voluntary movement. J Neurophysiol. 1968;31:14–27. doi: 10.1152/jn.1968.31.1.14. [DOI] [PubMed] [Google Scholar]
- Evarts EV. Precentral and postcentral cortical activity in association with visually triggered movement. J Neurophysiol. 1974;37:373–381. doi: 10.1152/jn.1974.37.2.373. [DOI] [PubMed] [Google Scholar]
- Evarts EV, Tanji J. Gating of motor cortex reflexes by prior instruction. Brain Res. 1974;71:479–494. doi: 10.1016/0006-8993(74)90992-5. [DOI] [PubMed] [Google Scholar]
- French AP. Vibrations and Waves. New York: W. W. Norton; 1971. [Google Scholar]
- Gao P, Bermejo R, Zeigler HP. Whisker deafferentation and rodent whisking patterns: behavioral evidence for a central pattern generator. J Neurosci. 2001;21:5374–5380. doi: 10.1523/JNEUROSCI.21-14-05374.2001. [DOI] [PMC free article] [PubMed] [Google Scholar]
- Gao P, Hattox AM, Jones LM, Keller A, Zeigler HP. Whisker motor cortex ablation and whisker movement patterns. Somatosens Mot Res. 2003;20:191–198. doi: 10.1080/08990220310001622924. [DOI] [PubMed] [Google Scholar]
- Georgopoulos AP, Crutcher MD, Schwartz AB. Cognitive spatial-motor processes. 3. Motor cortical prediction of movement direction during an instructed delay period. Exp Brain Res. 1989;75:183–194. doi: 10.1007/BF00248541. [DOI] [PubMed] [Google Scholar]
- Hattox AM, Li Y, Keller A. Serotonin regulates rhythmic whisking. Neuron. 2003;39:343–352. doi: 10.1016/s0896-6273(03)00391-x. [DOI] [PubMed] [Google Scholar]
- Hattox AM, Priest CA, Keller A. Functional circuitry involved in the regulation of whisker movements. J Comp Neurol. 2002;442:266–276. doi: 10.1002/cne.10089. [DOI] [PMC free article] [PubMed] [Google Scholar]
- Horsley V, Schäfer FRS. Experiments on the character of the muscular contractions which are evoked by excitation of the various parts of the motor tract. J Physiol. 1886;7:96–110. doi: 10.1113/jphysiol.1886.sp000209. [DOI] [PMC free article] [PubMed] [Google Scholar]
- Jaberzadeh S, Brodin P, Flavel SC, O'Dwyer NJ, Nordstrom MA, Miles TS. Pulsatile control of the human masticatory muscles. J Physiol. 2003;547:613–620. doi: 10.1113/jphysiol.2003.030221. [DOI] [PMC free article] [PubMed] [Google Scholar]
- Kakuda N, Nagaoka M, Wessberg J. Common modulation of motor unit pairs during slow wrist movement in man. J Physiol. 1999;520:929–940. doi: 10.1111/j.1469-7793.1999.00929.x. [DOI] [PMC free article] [PubMed] [Google Scholar]
- Kleinfeld D, Berg RW, O'Connor SM. Anatomical loops and their electrical dynamics in relation to whisking by rat. Somatosens Mot Res. 1999;16:69–88. doi: 10.1080/08990229970528. [DOI] [PubMed] [Google Scholar]
- Lang EJ. Synchronicity, Rhythmicity and Movement: The Role of the Olivocerebellar System in Movement. New York: New York University, School of Medicine; 1995. [Google Scholar]
- Lang EJ. Organization of olivocerebellar activity in the absence of excitatory glutamatergic input. J Neurosci. 2001;21:1663–1675. doi: 10.1523/JNEUROSCI.21-05-01663.2001. [DOI] [PMC free article] [PubMed] [Google Scholar]
- Lang EJ. GABAergic and glutamatergic modulation of spontaneous and motor-cortex-evoked complex spike activity. J Neurophysiol. 2002;87:1993–2008. doi: 10.1152/jn.00477.2001. [DOI] [PubMed] [Google Scholar]
- Lang EJ, Sugihara I, Llinás R. GABAergic modulation of complex spike activity by the cerebellar nucleoolivary pathway in rat. J Neurophysiol. 1996;76:255–275. doi: 10.1152/jn.1996.76.1.255. [DOI] [PubMed] [Google Scholar]
- Llinás R. Eighteenth Bowditch lecture. Motor aspects of cerebellar control. Physiologist. 1974;17:19–46. [PubMed] [Google Scholar]
- Llinás R. The noncontinuous nature of movement execution. In: Humphrey DR, Freund H-J, editors. Motor Control: Concepts and Issues. New York: John Wiley & Sons; 1991. pp. 223–242. [Google Scholar]
- Llinás R, Sasaki K. The functional organization of the olivo-cerebellar system as examined by multiple Purkinje cell recordings. Eur J Neurosci. 1989;1:587–602. doi: 10.1111/j.1460-9568.1989.tb00365.x. [DOI] [PubMed] [Google Scholar]
- Llinás R, Volkind RA. The olivo-cerebellar system: functional properties as revealed by harmaline-induced tremor. Exp Brain Res. 1973;18:69–87. doi: 10.1007/BF00236557. [DOI] [PubMed] [Google Scholar]
- McAuley JH, Farmer SF, Rothwell JC, Marsden CD. Common 3 and 10 Hz oscillations modulate human eye and finger movements while they simultaneously track a visual target. J Physiol. 1999a;515:905–917. doi: 10.1111/j.1469-7793.1999.905ab.x. [DOI] [PMC free article] [PubMed] [Google Scholar]
- McAuley JH, Rothwell JC, Marsden CD. Human anticipatory eye movements may reflect rhythmic central nervous activity. Neuroscience. 1999b;94:339–350. doi: 10.1016/s0306-4522(99)00337-1. [DOI] [PubMed] [Google Scholar]
- Marsden JF, Brown P, Salenius S. Involvement of the sensorimotor cortex in physiological force and action tremor. Neuroreport. 2001;12:1937–1941. doi: 10.1097/00001756-200107030-00033. [DOI] [PubMed] [Google Scholar]
- Marshall SP, Lang EJ. Inferior olive oscillations gate transmission of motor cortical activity to the cerebellum. J Neurosci. 2004;24:11356–11367. doi: 10.1523/JNEUROSCI.3907-04.2004. [DOI] [PMC free article] [PubMed] [Google Scholar]
- Miyashita E, Keller A, Asanuma H. Input-output organization of the rat vibrissal motor cortex. Exp Brain Res. 1994;99:223–232. doi: 10.1007/BF00239589. [DOI] [PubMed] [Google Scholar]
- Miyashita E, Mori S. The superior colliculus relays signals descending from the vibrissal motor cortex to the facial nerve nucleus in the rat. Neurosci Lett. 1995;195:69–71. doi: 10.1016/0304-3940(95)11782-r. [DOI] [PubMed] [Google Scholar]
- Newland CF, Cull-Candy SG. On the mechanism of action of picrotoxin on GABA receptor channels in dissociated sympathetic neurones of the rat. J Physiol. 1992;447:191–213. doi: 10.1113/jphysiol.1992.sp018998. [DOI] [PMC free article] [PubMed] [Google Scholar]
- Nicholson C. Diffusion from an injected volume of a substance in brain tissue with arbitrary volume fraction and tortuosity. Brain Res. 1985;333:325–329. doi: 10.1016/0006-8993(85)91586-0. [DOI] [PubMed] [Google Scholar]
- Paxinos G, Watson C. The Rat Brain in Stereotaxic Coordinates. 4. Sydney: Academic Press; 1998. [Google Scholar]
- Porter R, Lemon R. Corticospinal Function and Voluntary Movement. Oxford: Oxford University Press; 1993. [Google Scholar]
- Sachdev RN, Sato T, Ebner FF. Divergent movement of adjacent whiskers. J Neurophysiol. 2002;87:1440–1448. doi: 10.1152/jn.00539.2001. [DOI] [PubMed] [Google Scholar]
- Sasaki K, Bower JM, Llinás R. Multiple Purkinje cell recording in rodent cerebellar cortex. Eur J Neurosci. 1989;1:572–586. doi: 10.1111/j.1460-9568.1989.tb00364.x. [DOI] [PubMed] [Google Scholar]
- Semba K, Komisaruk BR. Neural substrates of two different rhythmical vibrissal movements in the rat. Neuroscience. 1984;12:761–774. doi: 10.1016/0306-4522(84)90168-4. [DOI] [PubMed] [Google Scholar]
- Sigel E, Baur R. Allosteric modulation by benzodiazepine receptor ligands of the GABAA receptor channel expressed in Xenopus oocytes. J Neurosci. 1988;8:289–295. doi: 10.1523/JNEUROSCI.08-01-00289.1988. [DOI] [PMC free article] [PubMed] [Google Scholar]
- Smith SS. Step cycle-related oscillatory properties of inferior olivary neurons recorded in ensembles. Neuroscience. 1998;82:69–81. doi: 10.1016/s0306-4522(97)00213-3. [DOI] [PubMed] [Google Scholar]
- Snedecor GW, Cochran WG. Statistical Methods. 8. Ames, IA, USA: Iowa State University Press; 1989. [Google Scholar]
- Sugihara I, Lang EJ, Llinás R. Uniform olivocerebellar conduction time underlies Purkinje cell complex spike synchronicity in the rat cerebellum. J Physiol. 1993;470:243–271. doi: 10.1113/jphysiol.1993.sp019857. [DOI] [PMC free article] [PubMed] [Google Scholar]
- Tanji J, Evarts EV. Anticipatory activity of motor cortex neurons in relation to direction of an intended movement. J Neurophysiol. 1976;39:1062–1068. doi: 10.1152/jn.1976.39.5.1062. [DOI] [PubMed] [Google Scholar]
- Vallbo ÅB, Wessberg J. Organization of motor output in slow finger movements in man. J Physiol. 1993;469:673–691. doi: 10.1113/jphysiol.1993.sp019837. [DOI] [PMC free article] [PubMed] [Google Scholar]
- von Holst E. The Behavioral Physiology of Animals and Man. London: Methuen; 1973. [Google Scholar]
- Welsh JP, Lang EJ, Sugihara I, Llinás R. Dynamic organization of motor control within the olivocerebellar system. Nature. 1995;374:453–457. doi: 10.1038/374453a0. [DOI] [PubMed] [Google Scholar]
- Wineski LE. Facial morphology and vibrissal movement in the golden hamster. J Morphol. 1985;183:199–217. doi: 10.1002/jmor.1051830208. [DOI] [PubMed] [Google Scholar]


