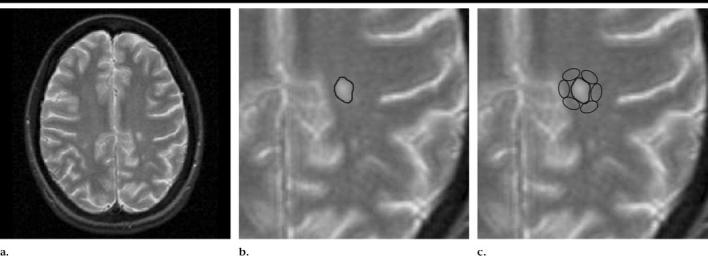
Conventional and diffusion-tensor MR images show the process used to compare regions of abnormal WM. (a) Transverse T2-weighted MR image (2800/100, 5-mm section thickness) with a focus of hyperintensity representing a plaque of demyelination in the left centrum semiovale. (b) Magnified image of a shows an ROI that has been placed to encompass the MS plaque. (c) On another magnified image of a, the area of abnormal WM, as indicated by FA values, is mapped by placing small ROIs around the MS plaque in predefined sites, as shown. The ROIs in this figure have been placed on the T2-weighted image for the purpose of clarity.
