Abstract
The application of direct time-locked subsampling (TLSS) to Fourier transform electron paramagnetic resonance (FT-EPR) spectroscopy at radio frequencies (rf) is described. With conventional FT-EPR spectroscopy, the high Larmor frequencies (Lf) often necessitate the use of intermediate frequency (IF) stages to down convert the received free induction decay (FID) signal to a frequency that can be acquired with common data acquisition technology. However, our research focuses on in vivo studies, and consequently utilizes a FT-EPR system with a Lf of 300 MHz. This relatively low frequency Lf, in conjunction with the advent of bandpass sampling analog–to–digital conversion and signal processing technologies, has enabled us to omit the IF stage in our FT-EPR system. With this in mind, TLSS techniques have been developed to directly sample the 300 MHz FID signal at a sampling rate of 80 MHz providing a signal bandwidth of 20 MHz. The required modifications to the data acquisition and processing system specific to this application are described. Custom software developed to control the EPR system setup, acquire the signals, and post process the data, is outlined. Data was acquired applying both coherent averaging and stochastic excitation sequences. The results of these experiments demonstrate digital down conversion of the 300 MHz FID signal to quadrature baseband. Direct FID TLSS eliminates many noise sources common in EPR systems employing traditional analog receiver techniques, such as the IF mixer stage in single channel systems, and the quadrature baseband mixer stage in dual channel systems.
INTRODUCTION
We are developing both continuous wave (CW) and pulsed electron paramagnetic resonance (EPR) imaging spectrometers for functional imaging of small animals.1 With the availability of narrow-line, nontoxic spin probes which are suitable for EPR imaging, we have developed, in vivo, noninvasive oximetric methods based on the oxygen dependent line width and relaxation time of the paramagnetic spin probes.2–7 In the small-animal Fourier transform-EPR (FT-EPR) imaging spectrometer we use rf pulses of ~100 ns duration at a nominal peak transmit power of 80 W. These pulses are applied at a frequency of 50 kHz (every 20 μs), corresponding to a duty cycle of 1/200. We are in the process of exploring the implementation of modern digital signal processing (DSP) techniques in CW and time-domain EPR imaging. Many of the current data acquisition systems allow integration of relatively low frequency analog-to-digital (A/D) converters with DSP firmware. Because of this, we are examining the feasibility of direct detection of EPR at 300 MHz utilizing bandpass sampling techniques, as opposed to directly sampling the free induction decay (FID) signal at rates (e.g., >1 Gs/s) that meet the Nyquist criteria for the rf signal. The results of direct detection with subsampling in EPR imaging at rf frequencies are presented.
Subsampling
An implementation of the so-called time-locked subsampling (TLSS) in CW EPR at X-band was carried out by Hyde et al.8 Using single channel detection, the down converted intermediate frequency (IF) EPR signal is sampled four times in (2n+1) IF cycles (e.g., acquiring four samples in three or five IF cycles). After processing the data, phase sensitive detection was clearly demonstrated in a nitroxide spin label that yielded multiple in- and out-of-phase harmonics (up to the fourth harmonic of the response to field modulation for both the dispersion and absorption EPR signals) in a single sweep. Subsequently, Froncisz et al.9 demonstrated the application of TLSS detection in three forms of pulse EPR spectroscopy at X band, namely, in FID, saturation recovery, and pulsed electron-electron double resonance.
Bandpass sampling can be used in a variety of applications over a broad range of disciplines, and has roots in communications theory.10,11 In this special case of bandpass sampling (TLSS), the frequency of the sampled signal is shifted down to quadrature baseband when the following requirements are met:12
| (1) |
where fc = center frequency, fBW = bandwidth of signal, and fs = sampling frequency.
Since our applications are focused on in vivo studies (i.e., low frequency EPR), the current state of A/D converter technology allows the rf FID response to be sampled directly. This eliminates the need for analog hardware that has been traditionally used to shift the FID signal down to an IF, or to quadrature baseband, before signal acquisition. In specific, our 300 MHz centered FID signal is directly (i.e., no IF stage) sampled at a rate of 80 MHz.
For in vivo imaging of small animals (e.g., mice), the current FT-EPR system has an imaging bandwidth of ~20 MHz. Bandpass sampling the 300 MHz carrier with fs =80 MHz provides a signal acquisition system bandwidth of 20 MHz [Eq. (1)]. Therefore, the system bandwidth is more than adequate for our ~10 MHz 3-dB bandwidth FID signal. The actual FID signal bandwidth is a result of the physical size of the test sample and the gradient magnitude. In addition to the implementation with standard coherent averaging methods, the direct FID TLSS technique has been applied to studies involving stochastic excitation methods.13
The TLSS algorithm, as shown in Fig. 1 and described by Hyde et al.,8 for quadrature bandpass sampling begins by resampling the acquired data by fs/2 into a set of even points and a set of odd points. It should be noted that since one set consists of even points and the other odd points, the sampling time of each point in one set is skewed relative to the corresponding point in the other set by 1/fs. The next step is to negate the value of every other point in each of the two sets, resulting in two modified arrays of data sampled at fs/2. The two data arrays can then be interpolated back to the original sampling rate to compensate for the 1/fs sampling time skew between the even and odd arrays of data which resulted from the resampling step of the algorithm.
FIG. 1.
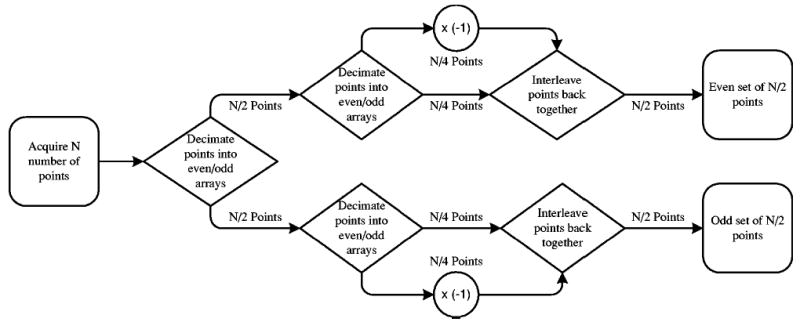
Simplified schematic of the time-locked subsampling (TLSS) algorithm.
The simplicity of the algorithm stems from the restrictions imposed by this case of bandpass sampling. Assume a band limited signal [Fig. 2(a)] described in Eq. (2).
FIG. 2.
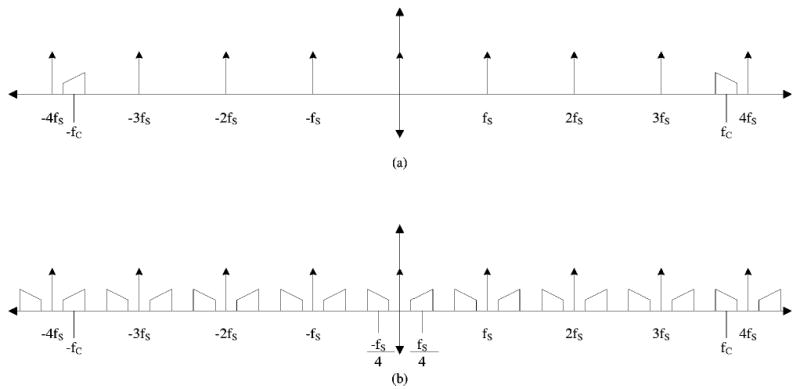
Frequency domain plot showing (a) the original band-limited signal and subsampling signal fs and (b) convolution of the band-limited signal and the subsampling function fs, resulting in a repeating pattern of the original signal with reflection symmetry around zero Hertz.
| (2) |
If the selected sampling frequency (fs) meets the requirements in Eq. (1), then f(t) can be described by Eq. (3), where T=1/fs.
| (3) |
This signal is effectively shifted down to a center frequency of fs/4 as shown in Fig. 2(b). The next step is to quadrature down convert the shifted signal by multiplying it by cos(2πkTfs/4) to get the even component (I) and sin(2πkTfs/4) to get the odd component (Q). This is equivalent to the step in the TLSS algorithm of negating every other point of each decimated array. The two components are then represented by Eq. (4).
| (4) |
Using trigonometric identities, Eq. (4) simplifies to I and Q terms comprised of a signal at baseband and one at half the sampling frequency shown in Eq. (5).
| (5) |
The higher frequency fs/2 component is then filtered out leaving only the baseband signal. In the TLSS algorithm, the higher frequency term is not present in the final results because of the reduction of the sampling rate in the decimation step.
MATERIALS AND METHODS
Direct FID TLSS (i.e., quadrature bandpass sampling) was accomplished by replacing several EPR system hardware components, and developing custom software for the downstream signal processing. The acquisition is independent of the type of system excitation selected (i.e., coherent averaging or stochastic excitation).
System configuration
An existing 300 MHz FT-EPR spectrometer was modified for these experiments. The system is similar to our previously published system configurations.7,14 The hardware configuration is shown in Fig. 3. The current system simplifies the transmit section by replacing most of the analog hardware with an AWG610 arbitrary wave form generator (AWG) (Tektronix, Richardson, TX). The AWG digitally generates a pair of rf pulse wave forms that are 180° out–of–phase. These wave forms are synthesized at a rate of 2.4 GS/s. Use of the AWG is an improvement over our previous methods which utilized a signal source, phase shifter, and rf switches to generate the 180° out–of–phase rf pulses. Omitting these traditional analog rf components helps to minimize assorted amplitude and phase errors. A standard function generator is used to trigger each AWG rf pulse, and it synchronizes all of the system hardware with the 10 MHz reference signal. The phase of the output rf pulse is selected by a digital signal that is input to the AWG. This phase control signal is either a standard square wave to alternate the phase for the coherent averaging sequence, or a pseudo-random sequence to select the phase for the stochastic excitation sequence.
FIG. 3.
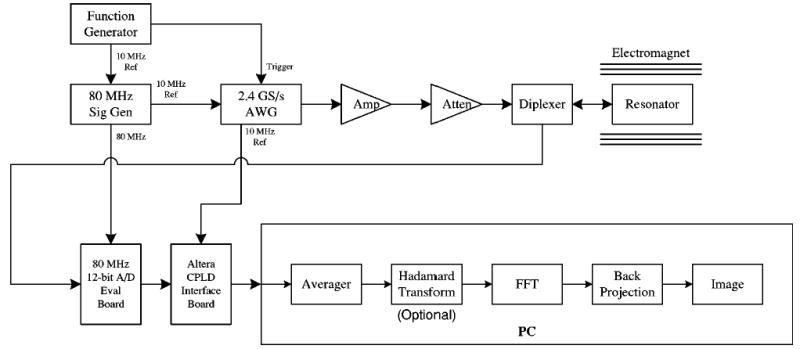
Block diagram of the 300 MHz FT-EPR system. The spectrometer can be configured for both coherent pulsed excitation and stochastic excitation.
The receive section consists of the A/D board, a digital logic board, and a PC-based digital input–output ports (I/O) board. The A/D converter was on an AD9432 evaluation board (Analog Devices, Norwood, MA). The AD9432 has a 500 MHz analog input bandwidth, 12-bit resolution, and a maximum sampling rate of 105 MHz. The A/D converter sample data is output as a 12-bit word along with the clock signal. An 8648D frequency synthesizer (Agilent, Palo Alto, CA), synchronized with the AWG via the 10 MHz reference signal, generates the 80 MHz sampling clock used for these experiments. This sampling frequency and subsequent processing (i.e., resampling) enable the acquisition of a FID signal having up to 20 MHz bandwidth [see Eq. (1)]. The A/D converter sample output rate exceeds the input data rate of the PCI-6534 digital I/O board (National Instruments, Austin, TX). Consequently, a digital logic board was developed to reduce the 12-bit data to 8-bit data, and combine four samples into a 32-bit word. This combining of samples was accomplished with a EPM7128SLC84-6 programmable logic device (PLD) (Altera, San Jose, CA) (see Fig. 4). In this format, the 32-bit sample data packets are input to the digital I/O board at a 20 MHz rate. The digital I/O board has 32 MB of onboard memory to store the incoming data.
FIG. 4.
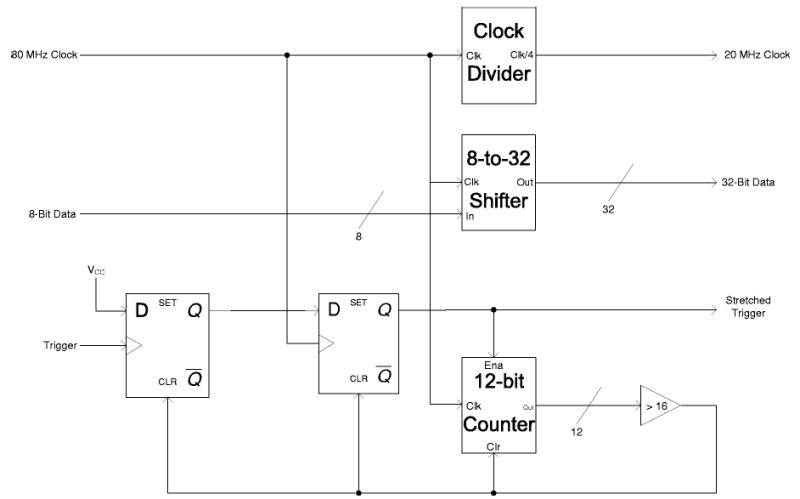
Block diagram of the firmware programmed into the Altera CPLD to transfer four data bytes from the A/D converter as one 32-bit word into the data acquisition card.
Customized signal processing and graphical user interface software was written using labview (National Instruments, Austin, TX) and matlab (Mathworks, Natick, MA). A flow diagram of the software-based signal processing is shown as part of Fig. 3. The software initializes the magnetic fields with the primary field fixed at 10.6 mT, and the gradient fields set to create a linear gradient of 2.5 G/cm. Once the fields are initialized, the software begins a two-dimensional (2D) acquisition. For a chosen plane, the gradient vector is rotated in equal angle intervals (i.e., 37 intervals), and at each angle 131 072 FID wave forms are averaged. If operating in stochastic excitation mode, a Hadamard transform is performed on the averaged wave form to correlate it with the pseudorandom sequence used to control the phase of the excitation rf pulses. A fast Fourier transform is computed on each averaged wave form to generate the projections needed to reconstruct an image. The 2D image is then reconstructed via filtered back projection.
Spin probes
The spin probe is a sample of powdered NMP-TCNQ (N-methylpyridinium tetracyanoquinodimethane) which is a paramagnetic charge-transform complex exhibiting a narrow EPR line at g=2. The spin content in the sample was quantified by comparing with a known sample and was found to be approximately 2×10¹⁸.
Resonator
The resonator is of the parallel coil type15 that has an inner diameter of 12.5 mm, and a length of 25 mm. The resonator is tuned to 300 MHz and has a critical unloaded Q of ~500. The Q is brought down to approximately 21.4 by a combination of resistive damping and overcoupling through adjustments of a matching capacitor. Under these conditions, there is no reduction in Q when the sample is loaded. The dead time of the system is ~300 ns. The B1 per square root of watt is 0.45 μT/W½.
Testing
Two sets of experiments were performed, one using coherent averaging and the other using stochastic excitation. For each set, a single averaged FID was collected without active gradient fields to confirm that each experiment was configured for an acceptable signal–to–noise ratio (SNR). The coherent averaging configuration was performed with a 100 ns, 5 W rf pulse resulting in a flip angle of ~50.2°. The stochastic excitation was performed with a 50 ns, 4 W pulse resulting in a flip angle of ~25.2°. A 2D image was also acquired for each experiment configuration consisting of 37 angular projections with the gradient field set to 2.5 G/cm.
RESULTS
A single averaged FID signal was acquired with a test tube sample of NMP-TCNQ using a coherent averaging approach and a stochastic excitation approach. In both cases the gradient field was set to zero. The SNR of the acquired coherent averaging FID is ~25 dB and the SNR of the stochastic excitation FID is ~22 dB. Our focus was not to maximize the SNR, or to compare the coherent averaging and stochastic excitation approaches. The difference in observed SNR was due to variations in the system configuration for the two types of experiments. The averaged FID signals are shown in Figs. 5(a) and 5(b).
FIG. 5.
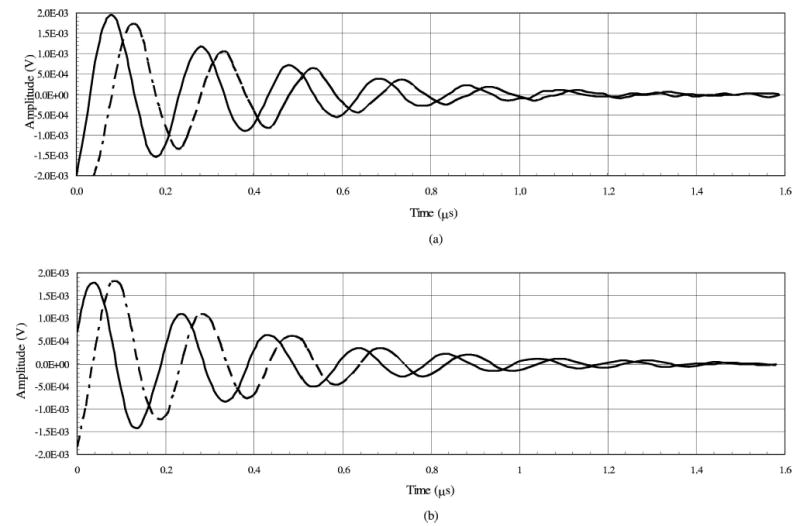
Received FID signals with zero gradient fields for (a) coherent averaging and (b) stochastic excitation for NMP-TCNQ. B0 field was offset by 0.524 mT and the B1 field is 1.0 G. Solid line is the I term and dashed line is the Q term.
A 2D image of two test tubes, each containing samples of NMP-TCNQ, was acquired using coherent averaging, and reconstructed using back projection (see Fig. 6). The gradient field was set at 2.5 G/cm.
FIG. 6.
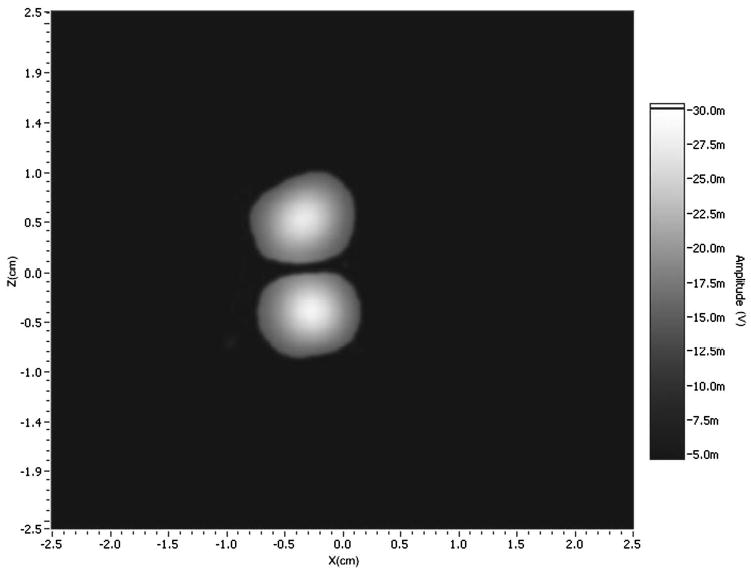
2D image of two samples of NMP-TCNQ using the coherent averaging configuration. 37 projections were acquired for the back projection reconstruction, with the gradient fields set to 2.5 G/cm.
DISCUSSION
We have demonstrated the use of direct FID time-locked subsampling (TLSS), in conjunction with coherent averaging and stochastic excitation, to perform FT-EPR spectroscopy. Direct FID TLSS omits the traditional EPR system receiver section IF stage. Overall EPR system performance improved due to the elimination of problematic phase errors and gain mismatches normally associated with the inclusion of an IF stage. When comparing results to previous system configurations, direct FID TLSS showed a ~5 dB improvement in SNR when testing the same amount of NMP-TCNQ sample. Previous experiments on an earlier system13 gave results with a SNR of ~17 dB compared to ~22 dB for experiments on the current system.
Recently developed commercial off-the-shelf technology will allow us to integrate our current A/D converter with field programmable gate arrays (FPGA) and digital signal processors (DSP). The lower sampling rates of direct TLSS, in conjunction with subsequent hardware-based FPGA sample processing, will facilitate the use of modern DSP technologies for real-time signal processing and image reconstruction. In addition, hardware available from Pentek (Upper Saddle River, NJ), for example, will enable direct sampling at higher Larmor frequencies (i.e., up to ~680 MHz) with higher sampling rates (i.e., up to 210 MS/s enabling acquisition of 52.5 MHz bandwidth FID signals) or higher resolution (i.e., up to 14 bits). Future work will include integrating these emerging technologies into our current EPR imaging systems.
Acknowledgments
The authors are grateful to Rolf Tschudin for his ideas and assistance at the onset of this work.
References
- 1.Halpern HJ, Yu C, Peric M, Barth E, Grdina DJ, Teicher BA. Proc Natl Acad Sci USA. 1994;91:13047. doi: 10.1073/pnas.91.26.13047. [DOI] [PMC free article] [PubMed] [Google Scholar]
- 2.Murugesan R, Cook JA, Devasahayam N, Afeworki M, Subramanian S, Tschudin R, Larsen JA, Mitchell JB, Russo A, Krishna MC. Magn Reson Med. 1997;38:409. doi: 10.1002/mrm.1910380309. [DOI] [PubMed] [Google Scholar]
- 3.Afeworki M, van Dam GM, Devasahayam N, Murugesan R, Cook J, Coffin D, Ardenkjaer-Larsen JHA, Mitchell JB, Subramanian S, Krishna MC. Magn Reson Med. 2000;43:375. doi: 10.1002/(sici)1522-2594(200003)43:3<375::aid-mrm9>3.0.co;2-g. [DOI] [PubMed] [Google Scholar]
- 4.Koscielniak J, Devasahayam N, Moni MS, Kuppusamy P, Yamada K, Mitchell JB, Krishna MC, Subramanian S. Rev Sci Instrum. 2000;71:4273. [Google Scholar]
- 5.Subramanian S, Yamada K, Irie A, Murugesan R, Cook JA, Devasahayam N, van Dam GM, Mitchell JB, Krishna MC. Magn Reson Med. 2002;47:1011. doi: 10.1002/mrm.10133. [DOI] [PubMed] [Google Scholar]
- 6.Krishna MC, English S, Yamada K, Yoo J, Murugesan R, Devasahayam N, Cook JA, Golman K, Ardenkjaer-Larsen JH, Subramanian S, Mitchell JB. Proc Natl Acad Sci USA. 2002;99:2216. doi: 10.1073/pnas.042671399. [DOI] [PMC free article] [PubMed] [Google Scholar]
- 7.Subramanian S, Murugesan R, Devasahayam N, Cook JA, Afeworki M, Pohida T, Tschudin RG, Mitchell JB, Krishna MC. J Magn Reson. 1999;137:379. doi: 10.1006/jmre.1998.1697. [DOI] [PubMed] [Google Scholar]
- 8.Hyde JS, Mchaourab HS, Camenisch TG, Ratke JJ. Rev Sci Instrum. 1998;69:2622. [Google Scholar]
- 9.Froncisz W, Camenisch TG, Ratke JJ, Hyde JS. Rev Sci Instrum. 2001;72:1837. [Google Scholar]
- 10.Nyquist H. AIIE Trans. 1928;47 [Google Scholar]
- 11.Gabor D. J Inst Electr Eng, Part 1. 1946;93 [Google Scholar]
- 12.Coulson AJ, Vaughan RG, Poletti MA. IEEE Trans Signal Process. 1994;42:1556. [Google Scholar]
- 13.Pursley RH, Kakareka J, Salem G, Devasahayam N, Subramanian S, Tschudin RG, Krishna MC, Pohida TJ. J Magn Reson. 2003;162:35. doi: 10.1016/s1090-7807(03)00050-8. [DOI] [PMC free article] [PubMed] [Google Scholar]
- 14.Pohida TJ, Frederickson HA, Tschudin RG, Fessler JF, Krishna MC, Bourg J, Harrington F, Subramanian S. Rev Sci Instrum. 1994;65:2500. [Google Scholar]
- 15.Devasahayam N, Subramanian S, Murugesan R, Cook JA, Afeworki M, Tschudin RG, Mitchell JB, Krishna MC. J Magn Reson. 2000;142:168. doi: 10.1006/jmre.1999.1926. [DOI] [PubMed] [Google Scholar]


