Abstract
We have reported a new class of artificial α-helices in which a pre-organized α-turn nucleates the helical conformation [R. N. Chapman, G. Dimartino, and P. S. Arora, J. Am. Chem. Soc., 2004, 126, 12252 and D. Wang, K. Chen, J. L. Kulp, III, and P. S. Arora, J. Am. Chem. Soc., 2006, 128, 9248]. This manuscript describes the effect of the core nucleation template on the overall helicity of the peptides and demonstrates that the macrocycle which most closely mimics the 13-membered hydrogen-bonded α-turn in canonical α-helices also affords the most stable artificial α-helix. We also investigate the stability of these synthetic helices through classical helix–coil parameters and find that the denaturation behavior of HBS α-helices agrees with the theoretical properties of a peptide with a well-defined and stable helix nucleus.
Introduction
The α-helix is the most common protein secondary structure and is intimately involved in biomolecular recognition. Artificial mimics of α-helices have the potential to regulate these molecular processes.1 We are developing a new approach for the preparation of stable artificial α-helices from short peptide sequences.2,3 This approach is centered on the helix–coil transition theory in peptides, which suggests that the energetically demanding organization of three consecutive amino acids into the helical orientation inherently limits the stability of short α-helices.4,5 Our method affords preorganized α-turns to overcome this intrinsic nucleation barrier and initiate helix formation.6–8 We prepare preorganized α-turns by replacing a main-chain hydrogen-bond between the C=O of the ith amino acid residue and the NH of the i + 4th amino acid residue with a carbon–carbon bond derived from a ring closing metathesis reaction (Fig. 1).9 The hydrogen-bond surrogate (HBS) approach allows full access to the helix surface due to the internal placement of the cross-link. Our method, therefore, differs significantly from the commonly employed side-chain cross-linking methods for helix stabilization, which sacrifice side-chain functionality to nucleate helical conformations.10–12 Modifying side-chains renders them unavailable for molecular recognition; moreover, the resulting tether blocks at least one face of the target helix. In previous reports, we demonstrated that the HBS α-turn can stabilize the α-helical structure in short alanine-rich2 and biologically-relevant sequences.3 We have also demonstrated that HBS α-helices can target their expected protein receptors with high affinities.13
Fig. 1.
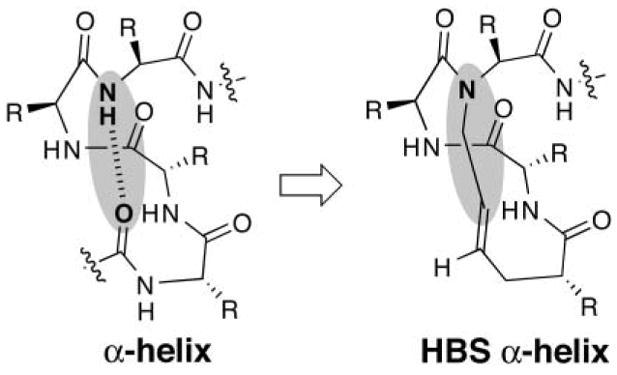
Nucleation of short α-helices by replacement of an N-terminal i and i + 4 hydrogen bond with a carbon–carbon bond.
In the HBS approach, the macrocycle mimicking the N-terminal α-turn nucleates the α-helix. In our preliminary studies we replaced the 13-membered hydrogen-bonded ring that characterize α-helices with a 13-membered macrocycle, based on the conjecture that this ring size may be best at nucleating the helix. In this paper we fully examine the effect of the macrocycle structure on the nucleation and stability of the helix. These studies are critical for the further development of these artificial α-helices as tools for biomolecular recognition; the experiments described here also test our basic design principle: is the N-terminal α-turn properly designed for effective nucleation of the helix? If our initial design is correct, we would predict that a slight change in the pattern of hydrogen-bond acceptors in the macrocycle should significantly disrupt the stability of the α-helix.
In this manuscript, we also inspect the thermal denaturation properties of the synthetic helices and derive a nucleation constant based on the Zimm–Bragg helix–coil theory. We find that the HBS method sets the nucleation constant to unity, in accordance with the theory and our original hypothesis. These studies suggest that HBS helices could become unique probes for the examination of parameters that describe helix formation.
Results and discussion
Effect of nucleation macrocycles on overall helicity
The nucleation studies presented here were performed on two short peptides 1 and 2 (Fig. 2) derived from apoptotic protein BAK BH3 and c-Jun coiled-coil domains, respectively. 3,14,15 These two biologically relevant sequences are unstructured at physiological conditions, providing good models for studying the efficiency of HBS macrocycles for helix nucleation. In a previously reported study, we utilized extensive circular dichroism and NMR studies to demonstrate that the 13-membered HBS analogues (3a and 4a) of peptides 1 and 2 do indeed adopt stable α-helical structures.3 In the current manuscript, we present characterization on analogues that contain 14-membered rings (3c and 4c) in which the hydrogen bond acceptor (carbonyl groups) functionality is offset by one atom. (We intended to prepare both the 12-membered and the 14-membered macrocycle analogs; however, the 12-membered ring requires a 3-butenoic acid residue (a β,γ-unsaturated acid) at the N-terminus that undergoes alkene isomerization rather than ring-closing metathesis.) We hypothesized that a minor change in the macrocycle may have a big impact on the stability of the helix, thus supporting our original design principles that a precise α-turn mimic is critical for helix nucleation.
Fig. 2.
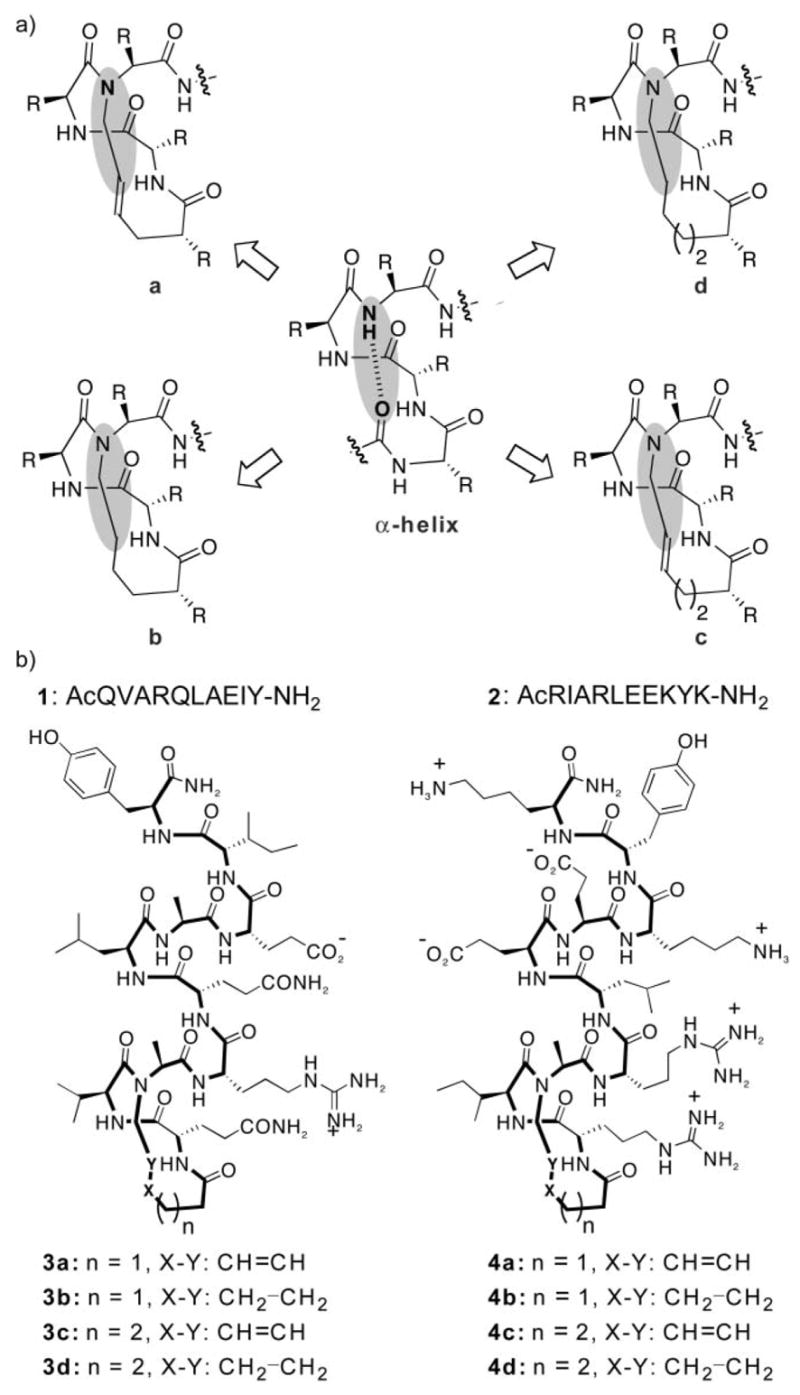
(a) Determination of the optimum nucleation macrocycle in HBS helices. (b) Control peptides and HBS α-helices designed to determine the effect of the nucleation macrocycle on the overall helicity.
The metathesis-derived macrocycle affords high yields of the trans-alkene product, and our previous studies have mainly utilized this alkene isomer. To fully determine the effects of the macrocycle on nucleation, we also prepared the hydrogenated HBS analogs containing 13- and 14-membered rings 3b, 3d, 4b and 4d (Fig. 2). (We were unable to isolate sufficient amounts of the cis-alkene isomers for the present studies.) We reasoned that the hydrogenated compounds should be less helical than the trans-alkene analogs owing to the extra degrees of freedom in the macrocycle.
Characterization by circular dichroism spectroscopy
The HBS helices presented here were synthesized as reported;3,9 detailed synthetic procedures and characterization are included in the Supplementary Information.† We began structural characterization of 3b–d and 4b–d with circular dichroism spectroscopy. The CD spectra were obtained in phosphate-buffered saline (PBS) and in a solution of 10% trifluoroethanol (TFE) in PBS. Fig. 3 shows the CD spectra of HBS α-helices 3a–d and 4a–d along with their unconstrained peptide counterparts 1 and 2, respectively, in 10% TFE in PBS. A summary of the circular dichroism results is listed in Table 1. Unconstrained peptides 1 and 2 display spectra typical of unstructured or slightly helical peptides. Importantly, all HBS α-helices (3a–d and 4a–d) display double minima at 208 and 222 nm, and maxima near 190 nm consistent with those observed for canonical α-helices. Percent helicity is calculated from the ratio [θ]222/[θ]max, where [θ]max = −23 400 for 10-residue α-helices.3 Table 1 also shows the ratio of the 222 nm and 208 nm bands, which is occasionally used as an additional gauge of α-helicity. However, the origin and effect of peptide sequence on this ratio remains ill-defined.16 Nevertheless, we were pleased to observe that the ratios of the 222 nm and 208 nm bands in the HBS α-helices are close to the values (1.25–1.75) expected for canonical α-helices.17
Fig. 3.
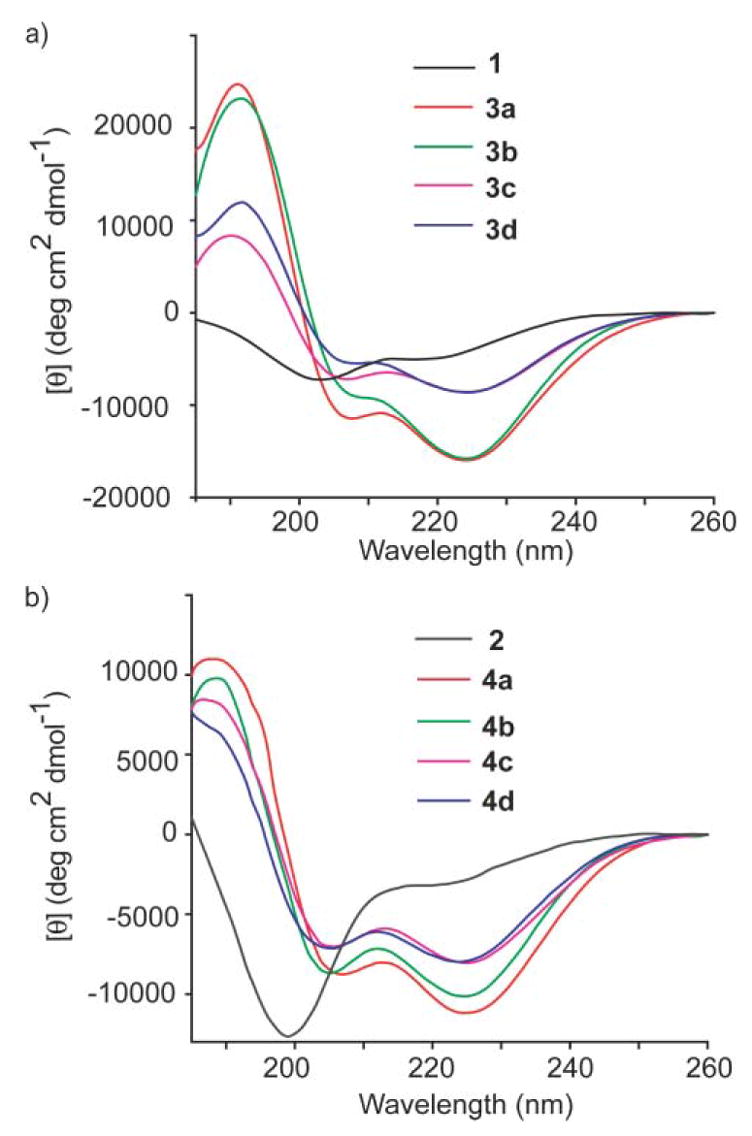
Circular dichroism spectra of (a) 1 (black), 3a (red), 3b (green), 3c (pink), 3d (blue) and (b) 2 (black), 4a (red), 4b (green), 4c (pink), 4d (blue). The CD spectra were obtained in 10% TFE–PBS.
Table 1.
Summary of circular dichroism data for peptides 1 and 2 and HBS α-helices 3a–d and 4a–d
| Helix | Buffer | [θ]222/[θ]208 | Helicity (%)a |
|---|---|---|---|
| 1 | PBS 10% | 0.41 | 14 |
| TFE–PBS | 0.65 | 20 | |
| 3a | PBS | 1.17 | 46 |
| 10% TFE–PBS | 1.40 | 68 | |
| 3b | PBS | 1.79 | 46 |
| 10% TFE–PBS | 1.71 | 66 | |
| 3c | PBS | 0.87 | 24 |
| 10% TFE–PBS | 1.19 | 36 | |
| 3d | PBS | 0.94 | 23 |
| 10% TFE–PBS | 1.55 | 36 | |
| 2 | PBS | 0.08 | 6 |
| 10% TFE–PBS | 0.25 | 13 | |
| 4a | PBS | 0.82 | 32 |
| 10% TFE–PBS | 1.29 | 48 | |
| 4b | PBS | 0.87 | 31 |
| 10% TFE–PBS | 1.25 | 43 | |
| 4c | PBS | 0.81 | 26 |
| 10% TFE–PBS | 1.17 | 34 | |
| 4d | PBS | 0.94 | 28 |
| 10% TFE–PBS | 1.17 | 34 |
Percent helicity was measured from the ratio [θ]222/[θ]max, where [θ]max = −23 400.3
The CD studies show that HBS analogs 3c and 4c containing 14-membered macrocycles are significantly less helical than their 13-membered ring analogues 3a and 4a. These results are consistent with the hypothesis that the macrocycle which most closely mimics the 13-membered hydrogen-bonded α-turn in canonical α-helices should afford the most stable artificial α-helix. Interestingly, the CD studies suggest that the hydrogenated and trans-alkene HBS helices are similar in overall helicity (Fig. 3 and Table 1). The two sets of CD spectra are superimposable except for the 208 nm bands, which are less negative in the hydrogenated series. This result is significant as it indicates that a saturated hydrocarbon link may be sufficient to nucleate an α-helix.
Characterization by NMR spectroscopy
We were surprised to find that hydrogenation of the alkene did not effect the stability of these artificial helices. These CD studies provide important insights into the overall conformation of the oligomer but do not offer detailed information about the peptide structure. To learn about the behavior of individual residues in 3b in comparison to 3a, we performed comprehensive NMR experiments. The goal of these studies is to determine how a small change in the nucleation macrocycle may affect the helicity of the peptide several residues away from the macrocycle. NMR spectroscopy allows several different means for gauging α-helical structure in peptides including evaluation of key medium and long range NOEs, coupling constants and φ angle values, temperature-dependence of amide NH chemical shifts, and rates of amide proton exchange.18 We used all these experiments to probe the structure of 3b as compared to 3a.3 The NMR studies fully support the CD data and unambiguously suggest that both 3a and 3b adopt defined α-helical structures and that the alkene-based HBS α-helix is only slightly superior to the hydrogenated analog in helix stability.
A combination of 2D TOCSY, DQF-COSY and NOESY spectroscopy was used to assign 1H NMR resonances for the HBS helices.18 The NOESY spectra of 3a and 3b show remarkable similarity; this similarity is also captured in the correlation charts for 3a and 3b (Fig. 4). Sequential NN (i and i + 1) NOESY cross-peaks, a signature of helical structure, were observed for both sequences as shown in the NOE correlation charts (Fig. 4). The NOESY spectrum further reveals several nonsequential medium range NOEs, for example, dαN(i, i + 3), dαN(i, i + 4) and dαβ(i, i + 3), that provide unequivocal evidence for the helical structure in 3b.
Fig. 4.
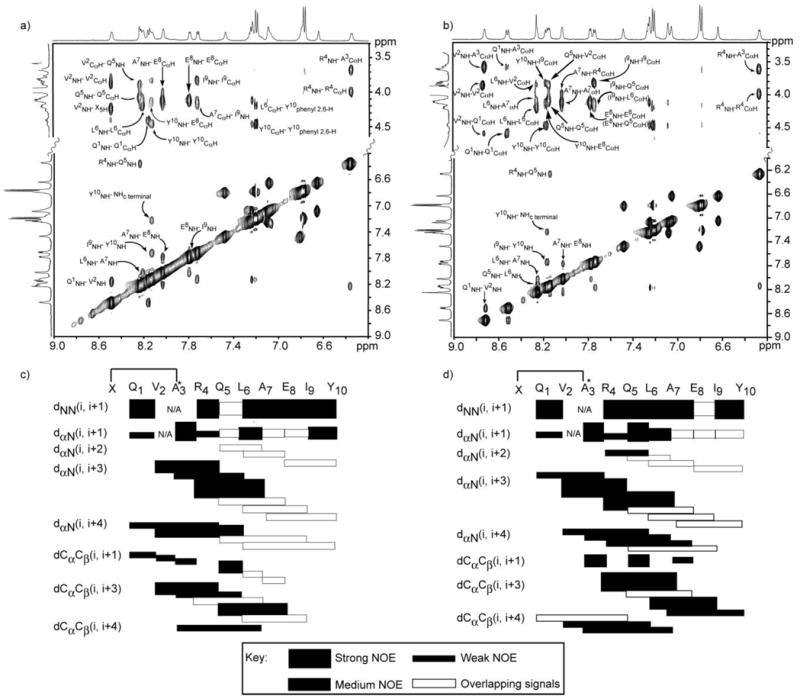
NOESY correlation charts and cross-sections of NOESY spectra for 3a (a, c) and 3b (b, d). The alanine-3 residues in both artificial helices are N-alkylated. Filled rectangles indicate relative intensity of the NOE cross-peaks. Empty rectangles indicate NOE that could not be unambiguously assigned because of overlapping signals.
Table 2 summarizes the NMR results obtained for 3b and compares them to those previously reported for 3a. The 3J NHCHα coupling constant provides a measure of the φ angle and affords intimate details about the local conformation in peptides and proteins.18 The 3J NHCHα values typically range between 4–6 Hz (−70 < φ < −30) for α-helices, and a series of three or more coupling constants in this range are indicative of the α-helical structure. As observed with 3a, all coupling constants and the φ angles for 3b fall in the range expected for α-helical peptides with the exception of coupling constants for residues at the termini (Q1 and Y10).
Table 2.
Summary of NMR data for HBS helices 3a and 3b
| Residues | Q1 | V2 | R4 | Q5 | L6 | A7 | E8 | I9 | Y10 | |
|---|---|---|---|---|---|---|---|---|---|---|
| 3J NH–CαH/Hz | 3a | 8.4 | 4.0 | 4.4 | 4.8 | 4.4 | 3.3 | 4.8 | 6.0 | 6.9 |
| 3b | 9.1 | 3.3 | 5.9 | 4.8 | 4.4 | 3.3 | 5.1 | 6.2 | 6.6 | |
| Calculated φ/○a | 3a | −95 | −58 | −62 | −65 | −62 | −52 | −65 | − 74 | −81 |
| 3b | −103 | −52 | −73 | −65 | −62 | −52 | −67 | − 76 | −79 | |
| Temperature coefficient/ppb ΔK−1 | 3a | −4.45 | − 8.88 | 2.70 | −2.64 | − 5.69 | − 4.50 | − 2.98 | −3.26 | −5.85 |
| 3b | −4.73 | − 7.94 | 2.30 | −4.42 | − 5.66 | − 4.60 | − 2.83 | −3.20 | −3.68 | |
| H/D exchange constant x 10−5/s−1 | 3a | 8.0 | 11.1 | 0.6 | 2.2 | 1.6 | 3.7 | 16.6 | 3.2 | 11.0 |
| 3b | 80.7 | 27.0 | 1.1 | ~1.0 | 1.3 | 1.8 | 9.3 | 3.2 | 3.3 | |
| Protection factor (logkch/kex)b,c | 3a | 1.64 | 1.13 | 2.94 | 2.62 | 2.09 | 1.90 | 1.60 | 1.94 | 1.13 |
| 3b | 0.63 | 0.74 | 2.72 | 0.95 | 2.18 | 2.20 | 1.85 | 1.74 | 1.65 | |
| Stabilization, −ΔG/kcal mol−1b | 3a | 2.18 | 1.47 | 3.94 | 3.51 | 2.80 | 2.54 | 2.12 | 2.33 | 1.48 |
| 3b | 0.69 | 0.88 | 3.64 | 3.96 | 2.92 | 2.95 | 2.47 | 2.33 | 2.20 |
Calculated using the spreadsheet at http://hx2.med.upenn.edu/download.html.
kex: measured exchange rates, kch: intrinsic chemical exchange rate.
The amide proton chemical shift is temperature sensitive and the magnitude of this shift is indicative of the extent to which the particular amide proton is hydrogen-bonded.20 If an amide proton exchanges slowly with a temperature coefficient more positive than −4.5 ppb K−1, it is considered to be hydrogen-bonded. We find that most amide temperature coefficients in helix 3b fall within the range considered indicative of hydrogen-bonded amides and that the values are consistent with those observed with 3a (Fig. 5 and Table 2).
Fig. 5.
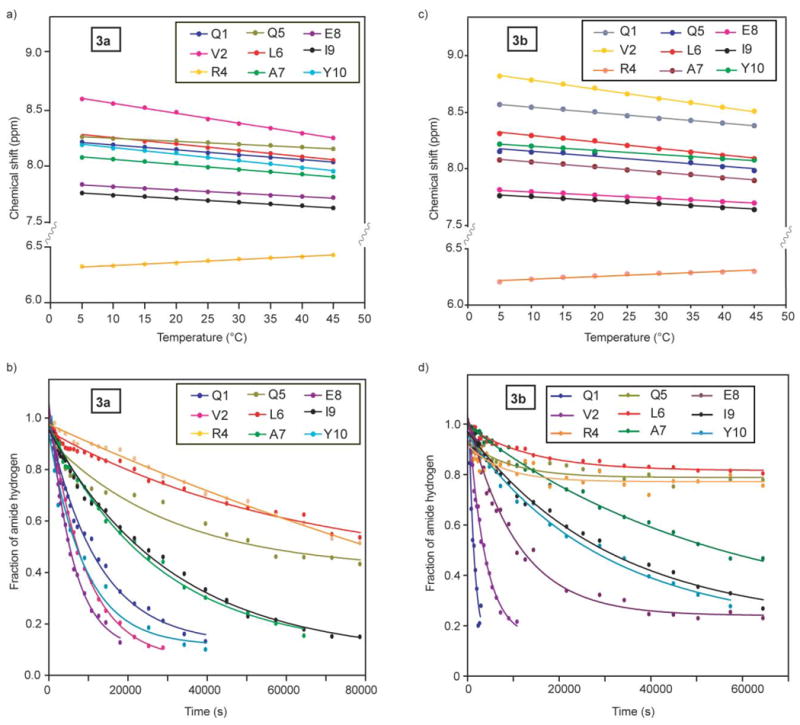
Temperature-dependent chemical shifts (a, c) and hydrogen–deuterium exchange plots (b, d) for backbone amide protons in 3a and 3b.19
Backbone amide hydrogen–deuterium exchange offers a sensitive tool for examining protein structure and dynamics.22,23 The amide exchange rates for unstructured peptides in aqueous solution are often too fast to measure; however if the amide hydrogen is protected from exchange, i.e. through hydrogen bonding, the exchange rates can slow down by several orders of magnitude. Relative rate constants for the H–D exchange, along with the temperature coefficients, provide important insights regarding the involvement of individual amino acid residues in intramolecular hydrogen bonds. Fig. 5b and 5d show H–D exchange curves for helix 3a and 3b, respectively. The tabulated exchange rates for 3a and 3b are shown in Table 2. The data in Fig. 5 show that the individual hydrogen-exchange rates in these helices can be determined precisely.24 The measured exchange rate constants, kex, can be compared to the predicted intrinsic chemical exchange rate constants, kch, for an unstructured peptide of the same sequence, to assess individual protection factors (log kch/kex) and the corresponding free energies of protection (DG). The predicted intrinsic chemical exchange rates, protection factors, and the free energy of protection were calculated using the spreadsheet at http://hx2.med.upenn.edu/download.html, and are shown in Table 2. The data indicate that HBS α-helices 3a and 3b contain a highly stable hydrogen-bonded network with significant protection factors and associated free energies of protection (0.7–3.9 kcal mol−1).3 Such a degree of stabilization is typically observed for buried amide protons in proteins but not in short peptides.10,25 Overall, the NMR studies confirm that hydrogenated analog 3b adopts a stable α-helical structure very similar to the one observed for 3a.
In summary, the circular dichroism and NMR results reported here show that proper alignment of hydrogen bond donors and acceptors is critical for the nucleation of stable α-helices, and that the 13-membered macrocycle affords the optimum nucleation template. We also find that the double bond (which formally replaces a carbonyl group in the peptide chain) in the nucleation macrocycle can be hydrogenated while retaining helix stability. This result will allow us to utilize the alkene group as a synthetic handle for N-terminal functionalization of the HBS α-helices.
HBS α-helices and classical helix-coil parameters
Formation of stable helical structures from disordered polypeptides depends on two parameters: σ which reflects helix nucleation and s which describes propagation.4,5,26 The nucleation constant which refers to the organization of three consecutive amino acid residues in an α-turn is typically very low (10−3–10−4) in unconstrained peptides, disfavoring helix formation.27,28 The intent behind our hydrogen-bond surrogate approach was to afford prenucleated helices such that σ would be ~1. Here we describe preliminary studies to obtain a nucleation constant for HBS α-helices based on the thermal stability of 3a and 3b. These studies provide a rough estimation of the nucleation constant; detailed studies aimed at deriving the nucleation constant in N- and C-capped polyalanine helices will be described in due course.29
To estimate the nucleation constant, σ, in HBS helices, the thermal stabilities of 3a and 3b were investigated by monitoring the temperature-dependent change in the intensity of the 222 nm bands in the CD spectra (Fig. 6a). We observe a gradual increase in the signal intensity at 222 nm with temperature, which indicates helix unwinding at high temperatures. Nevertheless, we find that HBS helices show a remarkable degree of thermal stability as the two peptides retain roughly 70% of their maximum CD signal at 85 °C. Although the HBS helices are conformationally stable at high temperatures, they can be denatured with concentrated guanidinium chloride.2 CD spectroscopy indicates that HBS helix 3a retains only 25% of its maximum helicity in 8 M GuHCl (Supplementary Information, Figure S18†). We attribute the CD signal at 8 M GuHCl ([θ]222 = −4500) to the contribution of the nucleation macrocycle to the overall CD spectra. All CD studies were performed at 100 μM peptide concentrations. Fig. 6b shows the effects of peptide concentration on the mean residue ellipticity and suggests that HBS helices are not aggregating in the 50–300 μM concentration range.
Fig. 6.
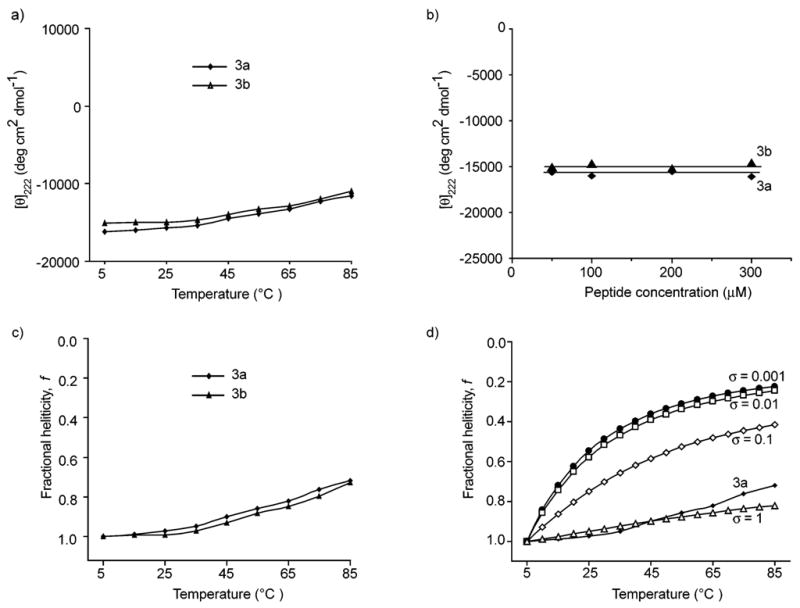
(a) Effect of temperature on the stability of HBS α-helices 3a and 3b. (b) Concentration dependence of mean residue ellipticity of HBS helices at 25 °C. The CD spectra were obtained in 10% TFE–PBS. (c) Normalized thermal denaturation curves for HBS helices. (d) Comparison of theoretical denaturation curves as a function of different nucleation constant, σ, values with the normalized experimental denaturation curve. The theoretical curves were obtained by simulating eqn (1) and (2).
| (1) |
| (2) |
To ascertain the effect of temperature on the fractional helicity of the compounds, we normalized the temperature denaturation curves in Fig. 6a such that the [θ]222 value at 5 °C for each peptide was assigned as the maximum fractional helicity value for that peptide (Fig. 6c). These experimental denaturation curves can be compared with the plots of fractional helicity as a function of temperature at various theoretical σ values (Fig. 6d). These plots were obtained by simulating eqn (1) which represents a simplified version of the Zimm–Bragg model for a helix that can only denature in one direction (Supplementary Information†).30 Fractional helicity can then be correlated with the propagation parameter, s, and temperature through eqn (2), as propagation is largely an entropic phenomenon.31 The enthalpic contribution (ΔH) to helix formation was set to a value of −1000 cal mol−1 in eqn (2).32 In these calculations we utilized a value of s0 = 1 at T0 = 277 K to estimate a nucleation constant for these heteropolymers; v is the number of residues in the peptide beyond the macrocycle. The simulations in Fig. 6d agree with the theory and experiments that for a low σ value, helicity is highly dependent on temperature but that the helix is less perturbed as a function of temperature at high σ values. Comparison of the experimental thermal denaturation curves with the simulation suggests that the nucleation constant, σ, is close to unity in HBS helices (Fig. 6c,d).
| (3) |
The broad melting transition in HBS helices is consistent with σ = 1.33 This σ value (and the broad transition) implies a noncooperative case in which each unit behaves independently. This situation suggests that the helix–coil transition does not depend on the value of σ. This reasoning led us to consider transition in HBS helices with a modified Ising model in which one end is always locked in the helix state. A complete discussion on this subject is presented in the Supplementary Information†. For this modified case, we can use eqn (3) to define fraction helicity as a function of temperature. Fig. 7 compares the simulated curve from eqn (3) to the experimental denaturation curve for helix 3a and suggests that HBS helices are good models for an oligomer that is locked in a helical conformation at one end.
Fig. 7.
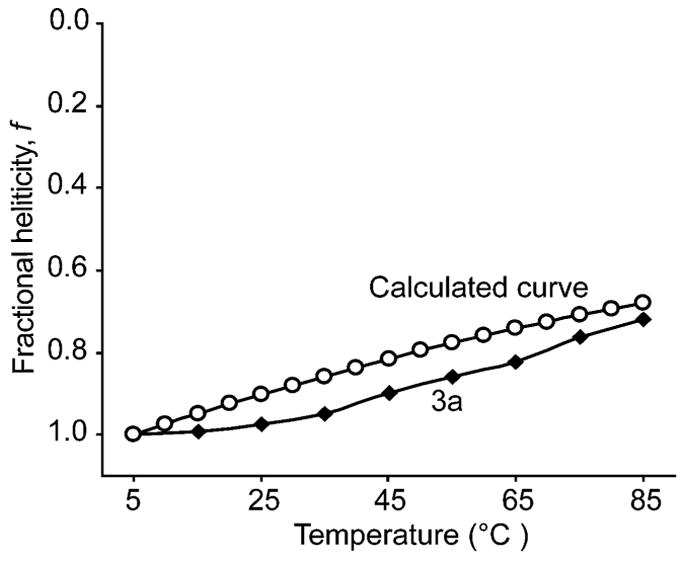
Comparison of HBS helices to a theoretical oligomer with one end always locked in the helix state (eq. 3). The experimental denaturation curve of HBS helices agrees well with the simulated curve from eq. 3.
This helix–coil analysis suggests that HBS helices would provide a unique opportunity to obtain propagation constants for amino acids in pre-nucleated helices. Determination of propagation values in simple, nucleated and well-defined α-helices would significantly enhance our understanding of peptide and protein folding, and has been a long-term goal of several research groups.16,34–36 We are in the process of determining these propagation values in HBS helices; the results of these studies will be reported in due course.
Conclusions
This manuscript outlines our continuing efforts to prepare well-defined short α-helices as potential tools in disruption of biomolecular interactions and as well-defined probes for examining the biophysics of helix formation. Evaluation of several different nucleation templates suggests that the hydrogen-bond surrogate-based macrocycle that most closely resembles the 13-membered hydrogen-bonded ring in canonical α-helices is optimum in these artificial helices. This article also described our initial efforts to characterize HBS helices in terms of classical helix–coil parameters. We find that these artificial α-helices mimic the theoretical properties of a peptide with a well-defined and stable helix nucleus.
Experimental
General
Commercial-grade reagents and solvents were used without further purification except as indicated. All Fmoc amino acids, peptide synthesis reagents, and Rink Amide MBHA resin were obtained from Novabiochem (San Diego, USA). All other reagents were obtained from Sigma-Aldrich (St. Louis, USA). Reversed-phase HPLC experiments were conducted with 4.6 × 150 mm (analytical scale) or 21.4 × 150 mm (preparative scale) Waters C18 Sunfire columns using a Beckman Coulter HPLC equipped with a System Gold 168 Diode array detector. The typical flow rates for analytical and preparative HPLC were 1 mL min−1 and 8 mL min−1, respectively. In all cases, 0.1% aqueous trifluoroacetic acid and acetonitrile buffers were used. Proton and carbon NMR spectra of monomers were obtained on a Bruker AVANCE 400 MHz spectrometer. Proton NMR spectra of HBS peptides were recorded on a Bruker AVANCE 500 MHz spectrometer. High-resolution mass spectra (HRMS) were obtained on a LC/MSD TOF (Agilent Technologies). LCMS data was obtained on an Agilent 1100 series LC/MSD (XCT) electrospray trap.
Synthesis of HBS α-helices
Detailed synthetic procedures and characterization of HBS helices and intermediates are reported in the Supplementary Information.†
CD spectroscopy
CD spectra were recorded on an AVIV 202SF CD spectrometer equipped with a temperature controller using 1 mm length cells and a scan speed of 5 nm min−1. The spectra were averaged over 10 scans with the baseline subtracted from analogous conditions as those for the samples. The samples were prepared in phosphate buffered saline (2 mM phosphate, 27 mM sodium chloride and 0.5 mM potassium chloride, pH 7.4), containing 0%–10% trifluoroethanol, with a final peptide concentration of 100 μM. The concentrations of unfolded peptides were determined by UV absorption of the tyrosine residue at 275 nm in 6.0 M guanidinium hydrochloride aqueous solution. The helix content of each peptide was determined from the mean residue CD at 222 nm, [θ]222 (deg cm2 dmol−1) corrected for the number of amino acids. Percent helicity was calculated from the ratio [θ]222/[θ]max, where [θ]max = (−44 000 + 250T )(1 − k/n) = −23 400 for k = 4.0 and n = 10 (number of amino acid residues in the peptide).3,12,37
Temperature dependent amide proton chemical shift measurements
All experiments were carried out on a Bruker AVANCE 500 MHz spectrometer equipped with an inverse TXI probe and 3D gradient control. Samples of peptide 3a and 3b were prepared by dissolving 2 mg peptide in 450 μL PBS buffer, 30 μL D2O and 120 μL TFE-d3, and adjusting the pH of the solution to 3.5 by adding 1 M HCl. The 1D proton spectra or 2D TOCSY spectra (when overlapping is severe) were employed to read the chemical shifts of the amide protons. Solvent suppression was achieved with a 3919 Watergate pulse sequence. The temperature ranged from 5 °C to 45 °C at 5 °C intervals. At each temperature, the sample was allowed to equilibrate for 15 minutes. The temperature was calibrated precisely by measurement of peak separation in 100% methanol (<30 °C) or 80% ethylene glycol in DMSO (>30 °C). The chemical shifts were calibrated with internal standard tetramethylsilane (TMS).
2D NMR spectroscopy
Spectra of peptide 3a and 3b (samples prepared as described above) were recorded on a Bruker Avance 500 at 20 °C. All 2D spectra were recorded by collecting 4092 complex data points in the t2 domain by averaging 64 scans and 256 increments in the t1 domain with the States-TPPI mode. All TOCSY experiments are performed with a mixing time of 80 ms on 6000 Hz spin lock frequency, and all NOESY with a mixing time of 200 ms. The data were processed and analyzed using the Bruker TOPSPIN program.38 The original free induction decays (FIDs) were zero-filled to give a final matrix of 2048 by 2048 real data points. A 90° sine square window function was applied in both dimensions.
Amide H–D exchange study
Lyophilized samples of peptides 3a and 3b from the above experiments were dissolved in 600 μL of D2O–TFE-d3 mixture (80 : 20) to initialize the H–D exchange. The pH of the solution was confirmed. Spectra were recorded on a pre-shimmed Bruker AVANCE 500 MHz spectrometer. The recorded temperature was 20 °C both inside and outside the probe. The dead time was ca. 2 minutes. The intensity changes for each amide proton were determined by monitoring either the HN peaks on 1D spectra or the cross-peaks between HN and Hα on 2D TOCSY spectra when overlapping was severe. The peak height data were fit into one phase exponential equation to get the exchange rate constants using GraphPad Prism 4.0 program.39
Acknowledgments
We thank Professors Neville Kallenbach and Alexander Vologodskii for their invaluable advice. P.S.A is grateful for financial support from the NIH (GM073943), the donors of the American Chemical Society Petroleum Research Fund, Research Corporation (Cottrell Scholar Award), and NYU (Whitehead Fellowship). We thank the NSF for equipment Grants MRI-0116222 and CHE-0234863, and the NCRR/NIH for Research Facilities Improvement Grant C06 RR-16572.
Footnotes
Electronic supplementary information (ESI) available: Synthesis and characterization of HBS helices, and estimation of the helix–coil transition in HBS helices. See DOI: 10.1039/b612891b
References
- 1.Walensky LD, Kung AL, Escher I, Malia TJ, Barbuto S, Wright RD, Wagner G, Verdine GL, Korsmeyer SJ. Science. 2004;305:1466–1470. doi: 10.1126/science.1099191. [DOI] [PMC free article] [PubMed] [Google Scholar]
- 2.Chapman RN, Dimartino G, Arora PS. J Am Cem Soc. 2004;126:12252–12253. doi: 10.1021/ja0466659. [DOI] [PubMed] [Google Scholar]
- 3.Wang D, Chen K, Kulp JL, III, Arora PS. J Am Cem Soc. 2006;128:9248–9256. doi: 10.1021/ja062710w. [DOI] [PMC free article] [PubMed] [Google Scholar]
- 4.Lifson S, Roig AJ. Cem Pys. 1961;34:1963–1974. [Google Scholar]
- 5.Zimm BH, Bragg JK. J Cem Pys. 1959;31:526–535. [Google Scholar]
- 6.Austin RE, Maplestone RA, Sefler AM, Liu K, Hruzewicz WN, Liu CW, Cho HS, Wemmer DE, Bartlett PA. J Am Cem Soc. 1997;119:6461–6472. [Google Scholar]
- 7.Chin DH, Woody RW, Rohl CA, Baldwin RL. Proc Natl Acad Sci U S A. 2002;99:15416–15421. doi: 10.1073/pnas.232591399. [DOI] [PMC free article] [PubMed] [Google Scholar]
- 8.Kemp DS, Curran TP, Davis WM, Boyd JG, Muendel C. J Org Cem. 1991;56:6672–6682. [Google Scholar]
- 9.Dimartino G, Wang D, Chapman RN, Arora PS. Org Lett. 2005;7:2389–2392. doi: 10.1021/ol0506516. [DOI] [PubMed] [Google Scholar]
- 10.Phelan JC, Skelton NJ, Braisted AC, McDowell RS. J Am Cem Soc. 1997;119:455–460. [Google Scholar]
- 11.Schafmeister CE, Po J, Verdine GL. J Am Cem Soc. 2000;122:5891–5892. [Google Scholar]
- 12.Shepherd NE, Hoang HN, Abbenante G, Fairlie DP. J Am Cem Soc. 2005;127:2974–2983. doi: 10.1021/ja0456003. [DOI] [PubMed] [Google Scholar]
- 13.Wang D, Liao W, Arora PS. Angew Cem, Int Ed. 2005;44:6525–6529. doi: 10.1002/anie.200501603. [DOI] [PMC free article] [PubMed] [Google Scholar]
- 14.Sattler M, Liang H, Nettesheim D, Meadows RP, Harlan JE, Eberstadt M, Yoon HS, Shuker SB, Chang BS, Minn AJ, Thompson CB, Fesik SW. Science. 1997;275:983–986. doi: 10.1126/science.275.5302.983. [DOI] [PubMed] [Google Scholar]
- 15.O’Shea EK, Rutkowski R, Stafford WF, 3rd, Kim PS. Science. 1989;245:646–648. doi: 10.1126/science.2503872. [DOI] [PubMed] [Google Scholar]
- 16.Kallenbach NR, Lyu PC, Zhou HX. CD spectroscopy and the helix–coil transition in peptides and polypeptides. In: Fasman GD, editor. Circular Dicroism and te Conformational Analysis of Biomolecules. Plenum Press; New York: 1996. [Google Scholar]
- 17.Wallimann P, Kennedy RJ, Miller JS, Shalongo W, Kemp DS. J Am Cem Soc. 2003;125:1203–1220. doi: 10.1021/ja0275360. [DOI] [PubMed] [Google Scholar]
- 18.Wuthrich K. NMR of Proteins and Nucleic Acids. Wiley; New York: 1986. [Google Scholar]
- 19.HBS helices 3a and 3b contain arginine residues at the 4th position. The amide protons of these residues display substantial upfield shifts. Please see reference 3 for a discussion on the characteristics of R4 residues.
- 20.Baxter NJ, Williamson MP. J Biomol NMR. 1997;9:359–369. doi: 10.1023/a:1018334207887. [DOI] [PubMed] [Google Scholar]
- 21.Karplus M. J Cem Pys. 1959;30:11–15. [Google Scholar]
- 22.Bai Y, Milne JS, Mayne L, Englander SW. Proteins. 1993;17:75–86. doi: 10.1002/prot.340170110. [DOI] [PMC free article] [PubMed] [Google Scholar]
- 23.Connelly GP, Bai Y, Jeng MF, Englander SW. Proteins. 1993;17:87–92. doi: 10.1002/prot.340170111. [DOI] [PubMed] [Google Scholar]
- 24.Englander SW, Kallenbach NR. Q Rev Biopys. 1983;16:521–655. doi: 10.1017/s0033583500005217. [DOI] [PubMed] [Google Scholar]
- 25.Zhou HXX, Hull LA, Kallenbach NR, Mayne L, Bai YW, Englander SW. J Am Cem Soc. 1994;116:6482–6483. [Google Scholar]
- 26.Qian H, Schellman JA. J Pys Cem. 1992;96:3987–3994. [Google Scholar]
- 27.Yang JX, Zhao K, Gong YX, Vologodskii A, Kallenbach NR. J Am Cem Soc. 1998;120:10646–10652. [Google Scholar]
- 28.Matheson RR, Scheraga HA. Macromolecules. 1983;16:1037–1043. [Google Scholar]
- 29.Lin JC, Barua B, Andersen NH. J Am Cem Soc. 2004;126:13679–13684. doi: 10.1021/ja047265o. [DOI] [PMC free article] [PubMed] [Google Scholar]
- 30.Kallenbach NR. personal communication. [Google Scholar]
- 31.Richardson JM, Lopez MM, Makhatadze GI. Proc Natl Acad Sci U S A. 2005;102:1413–1418. doi: 10.1073/pnas.0408004102. [DOI] [PMC free article] [PubMed] [Google Scholar]
- 32.Lopez MM, Chin DH, Baldwin RL, Makhatadze GI. Proc Natl Acad Sci U S A. 200299 1298–1302 doi: 10.1073/pnas.032665199. [DOI] [PMC free article] [PubMed] [Google Scholar]
- 33.Cantor CR, Schimmel PR. Te beavior of biological macromolecules. W. H. Freeman; San Francisco: 1980. ch. 20. [Google Scholar]
- 34.Rohl CA, Chakrabartty A, Baldwin RL. Protein Sci. 1996;5:2623–2637. doi: 10.1002/pro.5560051225. [DOI] [PMC free article] [PubMed] [Google Scholar]
- 35.Miller JS, Kennedy RJ, Kemp DS. J Am Cem Soc. 2002;124:945–962. doi: 10.1021/ja011726d. [DOI] [PubMed] [Google Scholar]
- 36.Siedlecka M, Goch G, Ejchart A, Sticht H, Bierzyski A. Proc Natl Acad Sci U S A. 1999;96:903–908. doi: 10.1073/pnas.96.3.903. [DOI] [PMC free article] [PubMed] [Google Scholar]
- 37.Luo P, Baldwin RL. Biocemistry. 1997;36:8413–8421. doi: 10.1021/bi9707133. [DOI] [PubMed] [Google Scholar]
- 38.TOPSPIN, Bruker Biospin GmbH. http://www.bruker-biospin.de/NMR/nmrsoftw/prodinfo/topsin/index.html.
- 39.GrapPad Prism v. 4.0. GraphPad software; San Diego, California, USA: http://www.graphpad.com. [Google Scholar]


