Abstract
Understanding transcription factor (TF) mediated control of gene expression remains a major challenge at the interface of computational and experimental biology. Computational techniques predicting TF-binding site specificity are frequently unreliable. On the other hand, comprehensive experimental validation is difficult and time consuming. We introduce a simple strategy that dramatically improves robustness and accuracy of computational binding site prediction. First, we evaluate the rate of recurrence of computational TFBS predictions by commonly used sampling procedures. We find that the vast majority of results are biologically meaningless. However clustering results based on nucleotide position improves predictive power. Additionally, we find that positional clustering increases robustness to long or imperfectly selected input sequences. Positional clustering can also be used as a mechanism to integrate results from multiple sampling approaches for improvements in accuracy over each one alone. Finally, we predict and validate regulatory sequences partially responsible for transcriptional control of the mammalian type A γ-aminobutyric acid receptor (GABAAR) subunit genes. Positional clustering is useful for improving computational binding site predictions, with potential application to improving our understanding of mammalian gene expression. In particular, predicted regulatory mechanisms in the mammalian GABAAR subunit gene family may open new avenues of research towards understanding this pharmacologically important neurotransmitter receptor system.
INTRODUCTION
Co-regulation is a basic mechanism to coordinately control expression of genes in modules, biochemical pathways and protein complexes (1–3). In eukaryotes, expression is most often mediated by transcription factors (TFs) that bind upstream of the transcription start site (TSS) and recruit the polymerase assembly (4). TFs bind, with varying affinity, to a set of similar, short (∼6–20 nt) sequences (5). Computational binding site discovery focuses on finding significantly overrepresented sequences in upstream regions of co-regulated genes (6–8). Thus, computational TFBS prediction algorithms must begin with an input set of promoters from genes hypothetically co-regulated by a shared TF. The algorithms aim to predict the binding positions and consequently the nucleotide specificity of the TF (9–11).
The first part of transcription factor binding site (TFBS) discovery, the input set, can be identified using either computational or experimental methods. Experimental techniques, such as chromatin immunoprecipitation (ChIP) (12), have been successfully used to generate a genome scale mapping of approximate TF-binding positions (10,13,14). Computational techniques, such as phylogenetic profiling (15,16) and artificial neural networks, can also be used to identify sets of co-regulated genes. Both experimental and computational approaches, however, suffer from a significant false positive (FP) prediction rate. Inclusion of extraneous promoters in the input sets dilutes the enrichment of the shared TFBS sequences making computational TFBS discovery significantly more challenging (17). We term such erroneously included promoters decoy sequences (DSs).
After receiving a set of upstream regions co-regulated by a shared TF as input, computational methods aim to predict the binding positions of that TF (6–8,18). Given a set of input promoters, motif detection algorithms identify a set of short, oligonucleotide segments hypothesized to bind to the TF of interest. The predicted sequences can be used to construct a position weight matrix (PWM) representing the average nucleotide frequencies for each position in the site (19). Ideally, computational detection will return all sequences that bind to every TF with biologically relevant function in those upstream regions. However, since the source of binding specificity for TFs is not well understood (20), heuristic approaches and ad hoc multiple alignment based scoring schemes are used to identify locally optimal solutions (17). Each local optimum that exists in a given set of promoters may correspond to distinctly different motifs, and may score differently relative to each other according to different scoring schemes.
Binding site prediction algorithms are generally confounded by several factors: degeneracy in the binding site; the unknown length of the binding site; the relatively large length of promoters; and the inclusion of DSs in the input sets (17,21,22). As a result as few as 10% of predicted positions correspond to biologically functional binding sites (23). Due, in part, to the low accuracy rate, computational binding site identification has been of limited use (23). Problems identifying binding sites are further exacerbated in mammalian genomes by larger promoter regions (24) and scarcity of reliable information on co-regulation of genes. Thus, the most demanding test of efficacy for TFBS identification approaches lies in their application to mammalian systems and subsequent validation of predictions.
Because of computational complexity of the problem, Gibbs sampling is often used to identify binding positions (18). In this paper, we present a new strategy that clusters Gibbs sampling results at each input nucleotide—a technique we term positional clustering—to improve accuracy of predicted TF binding. We evaluate the efficacy of our approach using known examples of binding and regulation in yeast and experimentally testing predicted TF-binding sites upstream of the subunit genes coding for the heteromeric mammalian neurotransmitter receptor system, the type A γ-aminobutyric acid receptor (GABAAR).
The GABAAR is the major inhibitory neurotransmitter receptor in the central nervous system (CNS) (25,26) with important roles in development (27,28) and disease (29–31). The receptor is believed to be a pentamer made up of multiple subunits that come from at least four different subunit classes (α, β, γ and δ) (32). At least 19 genes code for the various subunits that differentially combine to form numerous pharmacologically distinct GABAA receptor isoforms (29,30). Isoform utilization depends in part on the relative abundance of the subunits, which may change under various conditions (33–35). Understanding subunit regulatory mechanisms may provide insight into GABAA receptor isoform usage and related phenotypes (36).
In the current study, we test the ability of positional clustering to detect known TF-binding sites in a series of increasingly noisy sets of yeast promoters, and found marked improvement in the percentage of correct predictions over Gibbs sampling alone. We also present de novo predictions of TF-binding sites in promoter regions of GABAA receptor subunit genes (GABRs) whose expression is altered (either up-regulated or down-regulated) in an animal model of temporal lobe epilepsy (35). Positional clustering identified a number of putative cis-regulatory sites, many of which correspond to known binding elements for TFs found in the CNS. Mobility shift assays showed several predicted GABR-binding sequences specifically bind nuclear proteins derived from primary neocortical neurons kept in culture. Furthermore, a particular non-consensus GABR putative regulatory sequence was shown to have a functional role in cultured cortical neurons demonstrating the efficacy of positional clustering in detecting functional regulatory elements in mammals.
METHODS
Saccharomyces cerevisiae promoter selection
We identified S.cerevisiae genes predicted at high confidence (P ≤ 0.001) to be regulated by the TF STE12 in YPD growth media, according to whole-genome TF location data (14). For the 51 identified genes, we collected upstream intergenic promoters. Intergenic regions were truncated at 1 kb upstream of the gene's TSS.
GABR promoter selection
We selected for study a set of six GABRs: GABRA1, GABRA4, GABRB1, GABRB3, GABRD and GABRE. Promoters were extracted for each gene, including two alternative first exons of the GABRB3 (37), giving a set of seven promoters. The length of each promoter was: GABRA1, 3733 bp; GABRA4, 1546 bp; GABRB1, 1353 bp; GABRB3 (exon 1), 1310 bp; GABRB3 (exon 1A), 2080 bp; GABRD, 6625 bp; and GABRE, 5278 bp. We augmented the input set with orthologous promoters from rat, with the exception of GABRB3 for which an orthologous gene from mouse was used. In total, 14 promoters upstream of six GABRs were selected for analysis.
Evaluating long-term Gibbs sampling behavior
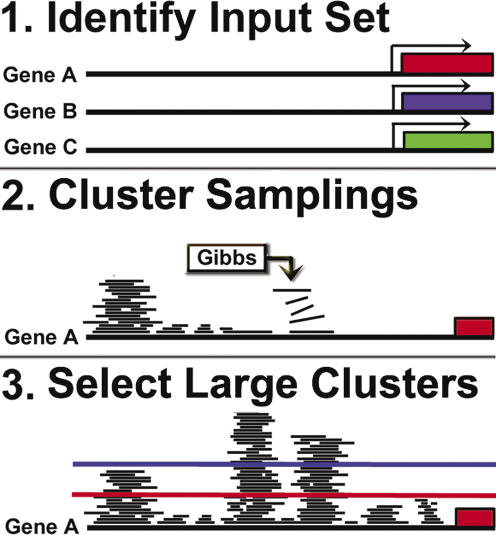
For a given input set of promoters, we ran the Gibbs sampler BioProspector (8) 400–550 times, evenly distributed across all motifs widths from 6–15 bp. We used a third-order background model derived from appropriate genomic promoters. We collected the best three results from each BioProspector run. We counted the number of times BioProspector identified each nucleotide in the input set. For each promoter, we identified the maximally occurring nucleotide, and extracted all positions identified by BioProspector >35% of the maximum. We clustered together neighboring positions into putative TFBS. As a dust filter, we removed all putative TFBSs <6 bp long (Figure 1).
Figure 1.
Schematic diagrams of the positional clustering process. (1) Sets of putatively co-regulated genes are identified. (2) Gibbs sampling is iterated on the input set thousands of times across numerous motif widths. Results are clustered on promoter position, creating a per-nucleotide frequency of the long term recurrence of Gibbs sampling. (3) A linear threshold is used to isolate the most frequently recurring positions, discarding all positions which fall below the threshold.
For sets of S.cerevisiae promoters, we used 1200 results from 400 BioProspector runs in our evaluation. For GABRps, we considered all 127 non-empty subsets of the seven promoters (orthologous sequences were always considered together). We used results from 70 000 BioProspector runs, evenly distributed across all promoter subsets, in our analysis. In addition to dust filtering, we required putative TFBSs to occur both in the human and in the orthologous rodent promoter.
Evaluating STE12-binding site recovery
We used positive predictive value,
to evaluate STE12-binding site predictions. We classified predictions as true positive (TP) or false positive (FP) by comparison to the STE12-binding motif, TGAAACA, as determined by (14). For each sequence, we calculated distance from the known STE12 PWM using a modified local ungapped sequence alignment similar to that in (38). Alignments were scored as the sum of Pearson's correlation coefficient,
between prediction X and the STE12 PWM across all aligned positions. Thus, scores ranged from zero, with no positions aligned, to seven, the length of the STE12 PWM. We observed a bimodal distribution of scores (Supplementary Figure S1), and chose the alignment score corresponding to the minima of the distribution (alignment score = 4.5) as the threshold to classify predictions as TP or FP.
Evaluating robustness to DSs
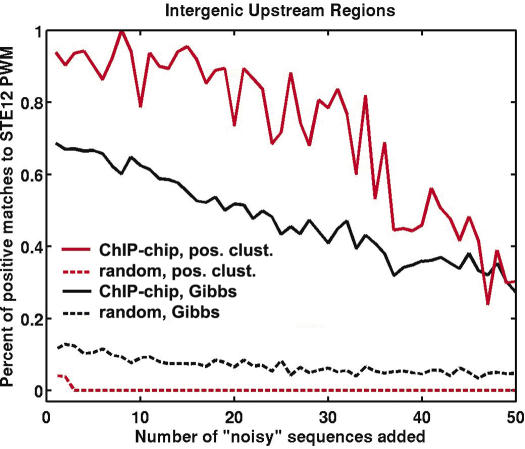
We complemented the seed set of 51 STE12-bound promoters with 1–50 randomly chosen yeast promoters. We performed our motif detection procedure on each input set, and compared the PPV of putative TFBS with that of raw BioProspector results (Figure 2, solid lines).
Figure 2.
The robustness to decoy sequences (DSs) of Gibbs sampling with and without positional clustering. Fifty-one increasingly noisy STE12-binding site enriched datasets were analyzed using Gibbs sampling with positional clustering (red solid line) and without (black solid line). The dotted lines represent null controls, e.g. identification of STE12-like motifs by Gibbs sampling (black dotted line) and positional clustering (red dotted line) given random upstream regions. x-axis counts over the addition of DSs. Each set of DSs was chosen independently from all upstream regions in the S.cerevisiae genome. We evaluated the positive predictive value of each technique on each dataset, and found positional clustering significantly improved the PPV through addition of 45 DSs.
To evaluate the background rate of STE12-binding site recovery, we created a seed set of 51 randomly chosen S.cerevisiae promoters. We evaluated the percentage of STE12-like binding sites identified in the random seed set, as well as in versions of the seed set augmented with 1–50 randomly chosen yeast promoters (Figure 2, dashed lines).
For additional yeast evaluations (HAP4, TEC1, YAP1 and YDR026C), we substituted for BioProspector an in-house implementation of the BioProspector algorithm. Comparisons of results from each implementation show the two implementations to be approximately equivalent.
Identification of known binding motifs in GABR predictions
We ran MotifScanner (39) to search GABR promoters for all vertebrate TF-binding motifs found in TRANSFAC (40). For each promoter analyzed, we used a prior probability of 0.1 and the corresponding organism specific third-order promoter background model from Eukaryotic Promoter Database (EPD) (41).We considered positional overlap between MotifScanner predictions and putative TFBSs indicative of known binding motifs in our predictions.
Electrophoretic mobility shift assay (EMSA)
Double-stranded oligonucleotides for EMSA contained the following sequences:
GABRB1: AATACGGTCCCTACT,
GABRD: ACTTAATTTGATTCCAT,
GABRB3: CGTGCCGGGGCGCGGCGGA,
GABRA4: AGCGCGGGCGAGTGTGAGCGCGAGTGTGCGCACGCCGCGGG,
GABRA4: GTGCACACACACGCCCACCGCGGCTCGGG and
GABRD: TGACCGTAGTAGA.
Nuclear extracts were prepared (42) and used for gel shift analysis after concentration (Microcon no. 10 columns, Amicon, MA). Quantification was performed on EMSAs under conditions that yield a standard curve for band intensity.
Double-stranded oligonucleotide functional analysis
Single-stranded sense and antisense phosphorothioate oligonucleotides for the predicted GGCGGCGTGCACACACACGCCCACCGCGG binding site are annealed by boiling sense and antisense oligonucleotides for 5 min at equal molar ratios in dH2O. Oligos are then cooled to room temperature and placed on ice. Transfections using DOTAP (Roche)/HEPES solutions are performed with oligonucleotides corresponding to wild-type, mutant or with DOTAP (Roche)/HEPES solution lacking oligonucleotides (MOCK) as described in (29). Effects of oligonucleotide application to neurons are assessed by real-time RT–PCR.
RESULTS
Gibbs sampling framework
Since TFBS are predicted computationally by local optimization strategies, we evaluate the extent to which one of these strategies, Gibbs sampling, identifies the same set of segments in repeated runs using the same input data. Identifying stably recurring motifs requires clustering of related results which, in turn, requires definition of ‘related’. Sequence similarity based clustering is impaired by the combination of sequence variation within motifs, the short length of TF-binding sites, and aligning motifs of different lengths. Instead of using sequence based clustering, we chose to cluster results by position, counting the number of times Gibbs sampling identifies each nucleotide in the promoter (Figure 1). We find that Gibbs sampling predictions, generated using BioProspector (8) are power-law distributed over nucleotide position (Supplementary Figure S2). Gibbs sampling converges on the majority of nucleotides very infrequently, and a small number of nucleotides very frequently. Thus, the most frequently recurring nucleotides appear in as few as 10% of results. Moreover, we find the power-law distribution of results is robust to Gibbs sampling algorithm and scoring scheme (data not shown). We can hypothesize that the most frequently occurring positions are the most biologically significant. Thus, discarding the least frequent Gibbs sampling results may yield higher accuracy and robust identification of biologically insignificant positions.
As a preliminary test of the above hypothesis, we applied repeated runs of Gibbs sampling to a set of 51 S.cerevisiae promoters enriched in STE12 binding as identified by whole-genome ChIP-chip experiments (10). We used positional clustering of 1200 results to identify the most frequently recurring positions (see Methods). Incorporation of additional results did not significantly alter the distribution of results (data not shown). We chose STE12 because it is one of the best studied TFs, with a well known, highly conserved and experimentally well-defined binding motif (10,43). The most frequently recurring positions were compared with the known STE12-binding motif (40). We classified predictions into two categories: true positive (TP) if they resemble the experimentally identified STE12-binding motif, and false positive (FP) otherwise (see Methods). Finally, we calculated the positive predictive value PPV as PPV = TP/(TP + FP).
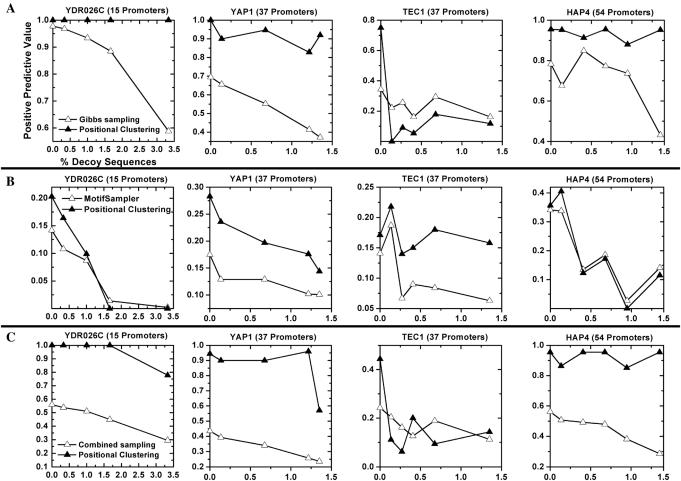
We find that positional clustering and subsequent selection of frequently recurring nucleotides improved the PPV of the STE12 binding site by at least 37% over Gibbs sampling alone (Figure 2). To validate that the above results were not specific to the number of input promoters, the STE12-binding motif, or the particular Gibbs sampling implementation, we repeated the above prediction process for promoters predicted to bind to YAP1, TEC1, HAP4 and YDR026C. We also repeated the analysis replacing the original Gibbs sampling procedure with our own implementation and MotifSampler (44). In all cases, we found positional clustering significantly improves on results over local optimization procedures alone (Figure 3).
Figure 3.
Improvement and robustness of positional clustering on promoters bound to other yeast TFs. Sets of S.cerevisiae promoters bound by the TFs YAP1, TEC1, HAP4 and YDR026C were chosen according to ChIP-chip experiments (10). For each set, the initial promoters were analyzed using Gibbs sampling with positional clustering (solid triangles) and without (open triangles). Two Gibbs sampling approaches were applied to each dataset: a Gibbs sampler procedure similar to BioProspector (8) (row A), and MotifSampler (39) (row B). Row C shows the combination of both sampling procedures, along with positional clustering of the combined results. x-axis counts over addition of DSs. We evaluated the positive predictive value of each technique on each dataset, and found positional clustering generally improved the PPV through addition of 100% random DSs.
Computational discovery of TFBS can have two types of FP predictions. One type is the identification of an incorrect motif from a set of upstream regions known to bind to a TF of interest as described above (see Methods). The second type of FP error is the background discovery rate of the correct motif using upstream regions that do not bind to the TF. To simulate this rate for STE12-like binding site recovery we repeated the analysis as described above starting with 51 randomly chosen yeast promoters. We find that positional clustering identifies STE12-like sites in <5% of results, compared with 10–15% for Gibbs sampling alone. Thus, using positional clustering, the performance of computational motif discovery is enhanced not only by improving the positive predictive value in promoters of genes co-regulated by STE12, but also by decreasing the false discovery of STE12-like sites by ∼10%.
Robustness to DSs
Next, we evaluated the effect of adding DSs on the performance of Gibbs sampling with and without positional clustering. Addition of DSs dilutes enrichment of the TF-binding site in the input set, making motif detection more challenging (17,22). Modeling DSs, we repeated our estimate of PPV of TFBS detection with the addition of 1–50 random yeast promoters (DSs) to the original set of 51 STE12-bound promoters. We found that positional clustering improves the PPV of Gibbs sampling by >20% through the addition of up to 80% noise or 40 DSs (Figure 2, Supplementary Figure S3). Additionally, results of Gibbs sampling both with and without positional clustering decay linearly with the addition of decoys [R2 = 0.81 and 0.95, respectively (Supplementary Figure S4)]. Extrapolating, we predict positional clustering will maintain an improved PPV through the addition of >100% noise or 70 DSs.
To address issues of generality, we repeated the procedure on additional sets of S.cerevisiae promoters (YAP1, TEC1, HAP4 and YDR026C). An added benefit is that we can evaluate the effect of information content of the binding motif and number of promoters on the improvement from positional clustering (22). Repeating the analysis, we again find that independently of the set or sampling procedure, positional clustering improves accuracy through a broad range of random DSs (Figure 3). Improvement appears to be limited and unreliable only when sampling alone correctly identifies the binding site in fewer than ∼20% of results. This result is consistent with our analysis of STE12-bound promoters (Figure 2), and may correspond to a lower limit for the efficacy of positional clustering.
Integrating sampling strategies
Recently, researchers have noted that complementary motif detection approaches can be used together to predict binding sites more effectively than either method alone (23). With this in mind, we evaluated positional clustering in terms of its ability to combine results from two different sampling implementations. For each dataset, an equal number of results from each approach were combined into a single dataset, and positional clustering was used to predict binding sites as described above (Figure 3C). We measured the average percent change in PPV for each TF on each dataset, and found positional clustering improved combined sampling by 94% compared with 25% and 27% improvement for BioProspector and MotifSampler, respectively. Additionally, clustering combined sampling improved 19 of the 22 datasets evaluated, whereas clustering of BioProspector and MotifSampler results improved 17 and 16 datasets, respectively. Thus, positional clustering is an effective mechanism to integrate results from multiple sampling procedures.
Identification of GABR cis-regulatory sequences
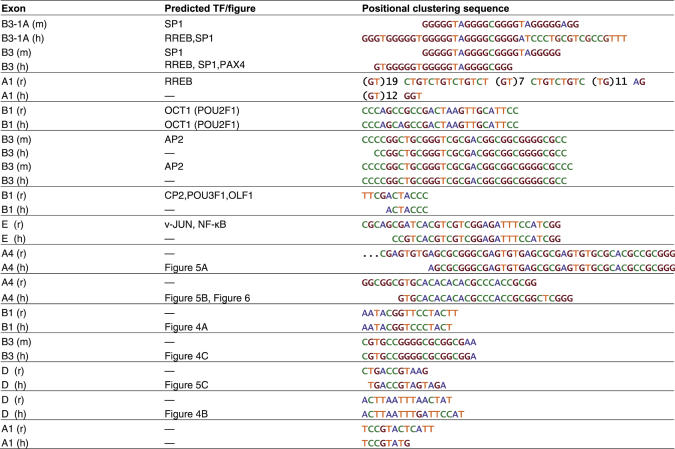
As described above in Introduction, identifying functional TFBS in mammals is difficult due in part to inclusion of decoy sequence from long upstream regions and lack of information on co-regulation of genes. Positional clustering, as shown above, is more robust to noisy input than Gibbs sampling alone, and thus may be better suited to identify de novo cis-regulatory elements in mammalian promoters that are coordinately regulated. To test this possibility, we chose seven mammalian GABR promoters (GABRps) whose activity is potentially altered in response to status epilepticus as identified through change in mRNA levels of the gene products (31,35). We also included orthologous rodent promoters in the input sets (45). Orthologous promoters were included to provide more instances of binding sites in the input set than would be expected by random, allowing for easier detection of the sites. Inclusion of orthologous promoters has the additional effect of selectively amplifying evolutionarily conserved binding sites. Such binding sites are more likely to have major functional roles in the regulation of the GABR receptor. Thus, sensitivity to such sequences is improved at the expense of sensitivity to species-specific binding sites. With this effect in mind, we require all GABR-binding site predictions to exist in orthologous promoters. Since the mechanisms of co-regulation for the seven GABRs are unknown, hypothetical co-regulation models were evaluated by querying all 27 possible subsets of the seven GABRps. Clustering results on nucleotide positions and selecting the most frequently occurring positions, we predicted 13 functional TF-binding sites.
Predictions were compared with instances of known binding motifs from TRANSFAC (40), and 8 of the 13 predictions (61.5%) resembled known binding sites for 10 TFs (Table 1). Of the 10 TFs, 7 have been identified in the CNS of rodents: SP-1 (46); AP-2, TST-1 (POU3F1), OCT-1 (POU2F1), OLF-1 (47); CP-2 (48); and RREB-1 (49). Furthermore, previous analyses of GABR promoter regions agree with our predictions that assign putative regulatory roles to SP-1, OCT-1, OLF-1 in the regulation of GABRs (29). We chose to validate novel motif predictions with EMSAs and functional studies in primary cultured neurons.
Table 1.
Positional clustering based predictions of transcriptional regulatory sequences upstream of GABRs
In total, we predict 15 orthologous pairs of regulatory sequences, representing 13 unique sequences. Comparing with known mammalian binding motifs, eight of the predictions show similarity to previously characterized TFBS, as indicated. Where no known binding motif exists, the corresponding in vitro EMSA and functional assay, if applicable, is indicated. Similar predictions are grouped together and aligned by hand.
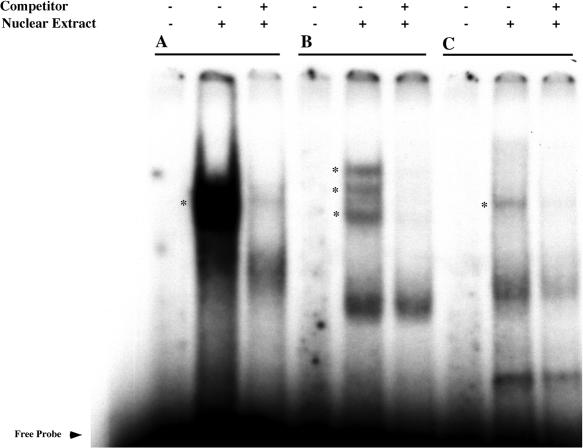
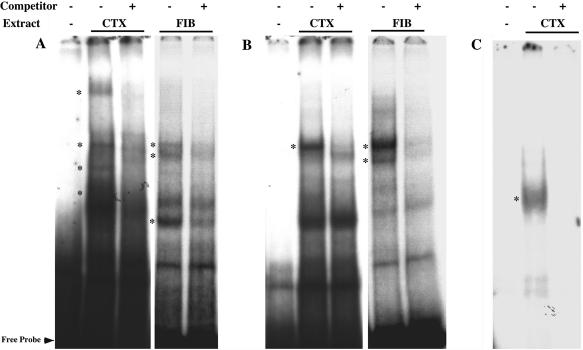
EMSA (50) was performed with an excess of cold competitors to define specificity of protein binding in nuclear extracts derived from primary neocortical neurons and fibroblasts (FIBs) kept in culture. As shown in Figures 4–6, out of six predicted binding sites found upstream of the (α, β, γ and δ) subunit genes, four (GABRA4, GABRB1, GABRB3 and GABRD) displayed specific binding. In addition to specific binding of neuronal extracts to novel GABRA4 motifs, we have evidence for specific binding using FIB extracts (Figure 5A and B), of especial interest given that the expression of GABRs is restricted to the nervous system and repressors such as the RE1-silencing transcription factor (REST) (51,52) expressed in non-neuronal cells have been implicated in the neural specificity of gene expression.
Figure 4.
Three putative transcription factor binding sites form DNA–protein complexes in neocortical nuclear extracts. Neocortical nuclear extracts from E18 rat embryos were incubated with three 32P-radiolabeled probes from human GABRB1, GABRD and GABRB3. Cold wild-type oligonucleotides were used to define specificity through competition. Cold oligonucleotides were added at 100-fold excess over probe. The conditions for each lane are as indicated. Specific binding complexes are shown using asterisks (*). The probe sequences are as follows: (A) GABRB1: AATACGGTCCCTACT, (B) GABRD: ACTTAATTTGATTCCAT and (C) GABRB3: CGTGCCGGGGCGCGGCGGA.
Figure 6.
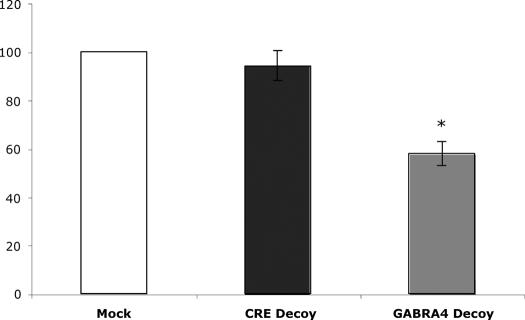
Double-stranded oligonucleotide functional assay for GABRA4 regulation. Primary cultures of rat neocortical neurons were treated with DOTAP (N-[1-(2,3-dioleoyloxy)propyl]-N,N,N-trimethylammonium methylsulfate) alone (Mock) or with DOTAP and phosphothioate oligonucleotides from either a cAMP response element (CRE Decoy) or a sequence from the GABA-A4 promoter predicted using positional clustering (GABA-A4 Decoy) (GTGCACACACACGCCCACCGCGGCTCGGG). mRNA was harvested after 24 h, and real-time RT–PCR was performed with GABA-A4 specific primers. Error bars refer to individual experiments; i.e. different platings of cells from different animals. Data was normalized to rRNA levels, and expressed as relative mRNA levels (GABA-A4/rRNA). Results are shown as mean ± SEM, N = 3, asterisk indicates significantly different from control at the 95% confidence interval.
Figure 5.
EMSA of three putative TF binding sites form DNA–protein complexes in neocortical and fibroblast nuclear extracts. Neocortical (NEO) and fibroblast (FIB) nuclear extracts from E18 rat embryos were incubated with three 32P-radiolabeled probes from human A4 and D receptor subunits. Cold wild-type oligonucleotides were used to define specificity through competition. Cold oligonucleotides were added at 100-fold excess over probe. The conditions for each lane are as indicated. Specific binding complexes are shown using asterisks (*). The probe sequences are as follows: (A) GABA-A4: AGCGCGGGCGAGTGTGAG CGCGAGTGTGCGCACGCCGCGGG, (B) GABA-A4: GTGCACACACACGCCCACC GCGGCTCGGG and (C) GABA-D: TGACCGTAGTAGA.
Clearly, protein binding to DNA does not always necessitate regulatory function. To begin to address the functional significance of our predicted regulatory motifs, we evaluated the effects of transfecting neurons with double-stranded oligonucleotides containing one of the GABRA4 novel binding motifs (dsA4O), as described above. GABRA4 is especially interesting given that it is regulated by brain derived neurotrophic factor (BDNF) after status epilepticus (31,53). Transfection with the dsA4O produced a significant down-regulation of GABRA4 gene expression in neocortical neurons as monitored by quantitative real-time RT–PCR with no change after MOCK transfection or transfection with a dsO containing three copies of a cAMP regulatory element (CRE) (Figure 6).
DISCUSSION
How reliable are the binding site predictions returned by Gibbs sampling based TFBS identification algorithms? We began by evaluating the stability of binding site predictions via repeated runs of Gibbs sampling. To quantify the robustness of predictions, we counted the number of Gibbs sampling results at each nucleotide position in the input set (Figure 1) over a large number of repeated trials. We find that the most frequently returned positions better predict TF binding sites than the maximally scoring motifs from Gibbs sampling (Figures 2 and 3). Since scoring functions are empirically derived and do not necessarily represent biological reality, the result is not altogether unexpected (17). However, we find that selecting frequently recurring positions allows filtering of up to 90% of spurious sampling results caused by convergence on biologically uninformative local minima. Positional clustering allows unbiased aggregation of results from different motif widths, thus approximating the width of the binding site ‘for free’ (54).
Next we show that positional clustering improves robustness to the addition of DSs (Figures 2 and 3). Such sequences arise from inclusion of promoter regions in input sets without direct binding to the TF either due to experimental error or computational mis-annotation (17,22). In the STE12 example studied, linear regression models indicate our approach will maintain an advantage over traditional Gibbs sampling through addition of up to 150% noise to the original signal (Supplementary Figure S4). Empirical data, however, show a sharp decrease in improvement close to the addition of 45 DSs, or roughly double the input set (Figure 2). Moreover, evaluations using promoters co-regulated by other TFs indicate positional clustering is less likely to improve predictions when Gibbs sampling identifies a correct site in <20% of repetitions (Figure 3). Thus, it is possible the rather simplistic linear model overestimates improvement in robustness beyond what is practically achievable. Moreover, when multiple motifs exist in the input promoters, preliminary evidence suggests positional clustering will uniquely identify a single dominant motif (Supplementary Figure S5). With further refinement, however, it may be possible to recover subordinate motifs, enabling identification of cis-regulatory modules. In spite of these limitations, using positional clustering of repeated runs, researchers can successfully apply sampling algorithms in identification of functional binding sites in datasets with a significant proportion of noise.
Computational prediction of TF binding in mammalian genomes poses just such a challenge due to increased decoy sequence in large upstream regions (24). Thus, having established increased robustness to DSs in yeast, we applied our approach to identify potentially unknown GABAA receptor subunit gene regulatory sequences that may participate in the response of the genome to seizure activity. We reasoned that GABAA receptor subunit genes either up-regulated or down-regulated in the animal model of epilepsy would share common binding motifs. Using positional clustering, we predicted 13 TF-binding sites upstream of GABAA receptor subunit genes (Table 1). Twelve of our predictions were verified by either comparison to known binding sites or experimental verification using in vitro binding assays. Initially positive experimental results highlight the ability of computational techniques to direct research into transcriptional regulation in mammalian models. As such, our approach may be applicable in the study of other protein complexes in the mammalian proteome.
The reported predictions may enable pharmacologically important downstream research. For example the predicted sites can be used as a starting point for quantifying in vivo effect on downstream transcription; for identifying the TFs bound; and even for the more complex task of understanding the role of each site in determining the relative abundance of GABAA receptor isoforms. Research along these lines may dramatically improve our understanding of GABAA receptor regulation and its role in disease and development. Additionally, a more comprehensive evaluation of the remaining GABAA receptor subunit genes may reveal additional TF-binding sites that uncover the evolutionary significance of γ-α-β GABR clusters in the human genome.
SUPPLEMENTARY DATA
Supplementary Data are available at NAR Online.
Acknowledgments
Charles DeLisi is partially supported by NIH grants A08 POGM66401A and J50 01-130021. Daniel S. Roberts is supported by NIH training grant 2T32 GM00854. Shelley J Russek is supported by NIH/NINDS Grant NS050393. Funding to pay the Open Access publication charges for this article was provided by the Boston University Bioinformatics Program.
Conflict of interest statement. None declared.
REFERENCES
- 1.Winderickx J., de Winde J.H., Crauwels M., Hino A., Hohmann S., Van Dijck P., Thevelein J.M. Regulation of genes encoding subunits of the trehalose synthase complex in Saccharomyces cerevisiae: novel variations of STRE-mediated transcription control? Mol. Gen. Genet. 1996;252:470–482. doi: 10.1007/BF02173013. [DOI] [PubMed] [Google Scholar]
- 2.Madhani H.D., Fink G.R. Combinatorial control required for the specificity of yeast MAPK signaling. Science. 1997;275:1314–1317. doi: 10.1126/science.275.5304.1314. [DOI] [PubMed] [Google Scholar]
- 3.Niehrs C., Pollet N. Synexpression groups in eukaryotes. Nature. 1999;402:483–487. doi: 10.1038/990025. [DOI] [PubMed] [Google Scholar]
- 4.Lewin B. Genes VIII. Upper Saddle River, NJ: Pearson Prentice Hall; 2004. [Google Scholar]
- 5.Stormo G.D. Consensus patterns in DNA. Methods Enzymol. 1990;183:211–221. doi: 10.1016/0076-6879(90)83015-2. [DOI] [PubMed] [Google Scholar]
- 6.Roth F.P., Hughes J.D., Estep P.W., Church G.M. Finding DNA regulatory motifs within unaligned noncoding sequences clustered by whole-genome mRNA quantitation. Nat. Biotechnol. 1998;16:939–945. doi: 10.1038/nbt1098-939. [DOI] [PubMed] [Google Scholar]
- 7.Bussemaker H.J., Li H., Siggia E.D. From the Cover: building a dictionary for genomes: identification of presumptive regulatory sites by statistical analysis. Proc. Natl Acad. Sci. USA. 2000;97:10096–10100. doi: 10.1073/pnas.180265397. [DOI] [PMC free article] [PubMed] [Google Scholar]
- 8.Liu X., Brutlag D.L., Liu J.S. BioProspector: discovering conserved DNA motifs in upstream regulatory regions of co-expressed genes. Pac. Symp. Biocomput. 2001:127–138. [PubMed] [Google Scholar]
- 9.Macisaac K.D., Wang T., Gordon B.D., Gifford D.K., Stormo G.D., Fraenkel E. An improved map of conserved regulatory sites for Saccharomyces cerevisiae. BMC Bioinformatics. 2006;7:113. doi: 10.1186/1471-2105-7-113. [DOI] [PMC free article] [PubMed] [Google Scholar]
- 10.Harbison C.T., Gordon D.B., Lee T.I., Rinaldi N.J., Macisaac K.D., Danford T.W., Hannett N.M., Tagne J.-B., Reynolds D.B., Yoo J., et al. Transcriptional regulatory code of a eukaryotic genome. Nature. 2004;431:99–104. doi: 10.1038/nature02800. [DOI] [PMC free article] [PubMed] [Google Scholar]
- 11.MacIsaac K.D., Fraenkel E. Practical strategies for discovering regulatory DNA sequence motifs. PLoS Comput. Biol. 2006;2:e36. doi: 10.1371/journal.pcbi.0020036. [DOI] [PMC free article] [PubMed] [Google Scholar]
- 12.Kuo M.H., Allis C.D. In vivo cross-linking and immunoprecipitation for studying dynamic Protein:DNA associations in a chromatin environment. Methods. 1999;19:425–433. doi: 10.1006/meth.1999.0879. [DOI] [PubMed] [Google Scholar]
- 13.Iyer V.R., Horak C.E., Scafe C.S., Botstein D., Snyder M., Brown P.O. Genomic binding sites of the yeast cell-cycle transcription factors SBF and MBF. Nature. 2001;409:533–538. doi: 10.1038/35054095. [DOI] [PubMed] [Google Scholar]
- 14.Lee T.I., Rinaldi N.J., Robert F., Odom D.T., Bar-Joseph Z., Gerber G.K., Hannett N.M., Harbison C.T., Thompson C.M., Simon I., et al. Transcriptional regulatory networks in Saccharomyces cerevisiae. Science. 2002;298:799–804. doi: 10.1126/science.1075090. [DOI] [PubMed] [Google Scholar]
- 15.Pellegrini M., Marcotte E.M., Thompson M.J., Eisenberg D., Yeates T.O. Assigning protein functions by comparative genome analysis: protein phylogenetic profiles. Proc. Natl Acad. Sci. USA. 1999;96:4285–4288. doi: 10.1073/pnas.96.8.4285. [DOI] [PMC free article] [PubMed] [Google Scholar]
- 16.Wu J., Kasif S., DeLisi C. Identification of functional links between genes using phylogenetic profiles. Bioinformatics. 2003;19:1524–1530. doi: 10.1093/bioinformatics/btg187. [DOI] [PubMed] [Google Scholar]
- 17.Friberg M., von Rohr P., Gonnet G. Scoring functions for transcription factor binding site prediction. BMC Bioinformatics. 2005;6:84. doi: 10.1186/1471-2105-6-84. [DOI] [PMC free article] [PubMed] [Google Scholar]
- 18.Lawrence C.E., Altschul S.F., Boguski M.S., Liu J.S., Neuwald A.F., Wootton J.C. Detecting subtle sequence signals: a Gibbs sampling strategy for multiple alignment. Science. 1993;262:208–214. doi: 10.1126/science.8211139. [DOI] [PubMed] [Google Scholar]
- 19.Stormo G.D. DNA binding sites: representation and discovery. Bioinformatics. 2000;16:16–23. doi: 10.1093/bioinformatics/16.1.16. [DOI] [PubMed] [Google Scholar]
- 20.Morozov A.V., Havranek J.J., Baker D., Siggia E.D. Protein-DNA binding specificity predictions with structural models. Nucleic Acids Res. 2005;33:5781–5798. doi: 10.1093/nar/gki875. [DOI] [PMC free article] [PubMed] [Google Scholar]
- 21.Li N., Tompa M. Analysis of computational approaches for motif discovery. Algorithms Mol. Biol. 2006;1:8. doi: 10.1186/1748-7188-1-8. [DOI] [PMC free article] [PubMed] [Google Scholar]
- 22.Reddy T.E., DeLisi C., Shakhnovich B.E. Assessing transcription factor motif drift from noisy decoy sequences. Genome Inform. Ser. Workshop Genome Inform. 2005;16:59–67. [PubMed] [Google Scholar]
- 23.Tompa M., Li N., Bailey T.L., Church G.M., De Moor B., Eskin E., Favorov A.V., Frith M.C., Fu Y., Kent W.J., et al. Assessing computational tools for the discovery of transcription factor binding sites. Nat. Biotechnol. 2005;23:137–144. doi: 10.1038/nbt1053. [DOI] [PubMed] [Google Scholar]
- 24.Blackwood E.M., Kadonaga J.T. Going the Distance: a current view of enhancer action. Science. 1998;281:60–63. doi: 10.1126/science.281.5373.60. [DOI] [PubMed] [Google Scholar]
- 25.Siegel G.J., Agranoff B.W. Basic Neurochemistry: Molecular, Cellular, and Medical Aspects, 6th edn. Philadelphia: Lippincott-Raven Publishers; 1999. [Google Scholar]
- 26.Kaplan P.W., Fisher R.S., National Center for Biotechnology Information (U.S.).Naitonal Center for Health Statistics (U.S.).National Library of Medicine (U.S.). Imitators of Epilepsy, 2nd edn. New York: Demos Medical Pub.; 2005. [Google Scholar]
- 27.Anand K., Ziebuhr J., Wadhwani P., Mesters J.R., Hilgenfeld R. Coronavirus main proteinase (3CLpro) structure: basis for design of anti-SARS drugs. Science. 2003;300:1763–1767. doi: 10.1126/science.1085658. [DOI] [PubMed] [Google Scholar]
- 28.Bosman L.W., Heinen K., Spijker S., Brussaard A.B. Mice lacking the major adult GABAA receptor subtype have normal number of synapses, but retain juvenile IPSC kinetics until adulthood. J. Neurophysiol. 2005;94:338–346. doi: 10.1152/jn.00084.2005. [DOI] [PubMed] [Google Scholar]
- 29.Steiger J.L., Russek S.J. GABAA receptors: building the bridge between subunit mRNAs, their promoters, and cognate transcription factors. Pharmacol. Ther. 2004;101:259–281. doi: 10.1016/j.pharmthera.2003.12.002. [DOI] [PubMed] [Google Scholar]
- 30.Treiman D.M. GABAergic mechanisms in epilepsy. Epilepsia. 2001;42(Suppl. 3):8–12. doi: 10.1046/j.1528-1157.2001.042suppl.3008.x. [DOI] [PubMed] [Google Scholar]
- 31.Roberts D.S., Raol Y.H., Bandyopadhyay S., Lund I.V., Budreck E.C., Passini M.A., Wolfe J.H., Brooks-Kayal A.R., Russek S.J. Egr3 stimulation of GABRA4 promoter activity as a mechanism for seizure-induced up-regulation of GABA(A) receptor alpha4 subunit expression. Proc. Natl Acad. Sci. USA. 2005;102:11894–11899. doi: 10.1073/pnas.0501434102. [DOI] [PMC free article] [PubMed] [Google Scholar]
- 32.Purves D., Augustine H.J., Fitzpatrict D., Hall W.C., LaMantia A., McNamara J.O., Williams S.M. Neuroscience, 3rd edn. Sunderland, MA: Sinauer Associates, Inc.; 2004. [Google Scholar]
- 33.Temple J.L., Wray S. Developmental changes in GABA receptor subunit composition within the gonadotrophin-releasing hormone-1 neuronal system. J. Neuroendocrinol. 2005;17:591–599. doi: 10.1111/j.1365-2826.2005.01348.x. [DOI] [PubMed] [Google Scholar]
- 34.Wall M.J. Alterations in GABAA receptor occupancy occur during the postnatal development of rat Purkinje cell but not granule cell synapses. Neuropharmacology. 2005;49:596–609. doi: 10.1016/j.neuropharm.2005.04.027. [DOI] [PubMed] [Google Scholar]
- 35.Brooks-Kayal A.R., Shumate M.D., Jin H., Rikhter T.Y., Coulter D.A. Selective changes in single cell GABA(A) receptor subunit expression and function in temporal lobe epilepsy. Nature Med. 1998;4:1166–1172. doi: 10.1038/2661. [DOI] [PubMed] [Google Scholar]
- 36.Dawson G.R., Collinson N., Atack J.R. Development of subtype selective GABAA modulators. CNS Spectr. 2005;10:21–27. doi: 10.1017/s1092852900009871. [DOI] [PubMed] [Google Scholar]
- 37.Kirkness E.F., Fraser C.M. A strong promoter element is located between alternative exons of a gene encoding the human gamma-aminobutyric acid-type A receptor beta 3 subunit (GABRB3) J. Biol. Chem. 1993;268:4420–4428. [PubMed] [Google Scholar]
- 38.Pietrokovski S. Searching databases of conserved sequence regions by aligning protein multiple-alignments [published erratum appears in Nucleic Acids Res 1996 Nov 1;24(21):4372] Nucleic Acids Res. 1996;24:3836–3845. doi: 10.1093/nar/24.19.3836. [DOI] [PMC free article] [PubMed] [Google Scholar]
- 39.Aerts S., Thijs G., Coessens B., Staes M., Moreau Y., De Moor B. Toucan: deciphering the cis-regulatory logic of coregulated genes. Nucleic Acids Res. 2003;31:1753–1764. doi: 10.1093/nar/gkg268. [DOI] [PMC free article] [PubMed] [Google Scholar]
- 40.Wingender E., Chen X., Fricke E., Geffers R., Hehl R., Liebich I., Krull M., Matys V., Michael H., Ohnhauser R., et al. The TRANSFAC system on gene expression regulation. Nucleic Acids Res. 2001;29:281–283. doi: 10.1093/nar/29.1.281. [DOI] [PMC free article] [PubMed] [Google Scholar]
- 41.Perier R.C., Praz V., Junier T., Bonnard C., Bucher P. The Eukaryotic Promoter Database (EPD) Nucleic Acids Res. 2000;28:302–303. doi: 10.1093/nar/28.1.302. [DOI] [PMC free article] [PubMed] [Google Scholar]
- 42.Therrien M., Drouin J. Cell-specific helix-loop-helix factor required for pituitary expression of the pro-opiomelanocortin gene. Mol. Cell. Biol. 1993;13:2342–2353. doi: 10.1128/mcb.13.4.2342. [DOI] [PMC free article] [PubMed] [Google Scholar]
- 43.Dolan J.W., Kirkman C., Fields S. The yeast STE12 protein binds to the DNA sequence mediating pheromone induction. Proc. Natl Acad. Sci. USA. 1989;86:5703–5707. doi: 10.1073/pnas.86.15.5703. [DOI] [PMC free article] [PubMed] [Google Scholar]
- 44.Thijs G., Marchal K., Lescot M., Rombauts S., De Moor B., Rouze P., Moreau Y. A Gibbs sampling method to detect overrepresented motifs in the upstream regions of coexpressed genes. J. Comput. Biol. 2002;9:447–464. doi: 10.1089/10665270252935566. [DOI] [PubMed] [Google Scholar]
- 45.Wasserman W.W., Palumbo M., Thompson W., Fickett J.W., Lawrence C.E. Human–mouse genome comparisons to locate regulatory sites. Nature Genet. 2000;26:225–228. doi: 10.1038/79965. [DOI] [PubMed] [Google Scholar]
- 46.Saffer J.D., Jackson S.P., Annarella M.B. Developmental expression of Sp1 in the mouse. Mol. Cell. Biol. 1991;11:2189–2199. doi: 10.1128/mcb.11.4.2189. [DOI] [PMC free article] [PubMed] [Google Scholar]
- 47.Gray P.A., Fu H., Luo P., Zhao Q., Yu J., Ferrari A., Tenzen T., Yuk D.I., Tsung E.F., Cai Z., et al. Mouse brain organization revealed through direct genome-scale TF expression analysis. Science. 2004;306:2255–2257. doi: 10.1126/science.1104935. [DOI] [PubMed] [Google Scholar]
- 48.Swendeman S.L., Spielholz C., Jenkins N.A., Gilbert D.J., Copeland N.G., Sheffery M. Characterization of the genomic structure, chromosomal location, promoter, and development expression of the alpha-globin transcription factor CP2. J. Biol. Chem. 1994;269:11663–11671. [PubMed] [Google Scholar]
- 49.Thiagalingam A., De Bustros A., Borges M., Jasti R., Compton D., Diamond L., Mabry M., Ball D.W., Baylin S.B., Nelkin B.D. RREB-1, a novel zinc finger protein, is involved in the differentiation response to Ras in human medullary thyroid carcinomas. Mol. Cell. Biol. 1996;16:5335–5345. doi: 10.1128/mcb.16.10.5335. [DOI] [PMC free article] [PubMed] [Google Scholar]
- 50.Kerr L.D. Electrophoretic mobility shift assay. Methods Enzymol. 1995;254:619–632. doi: 10.1016/0076-6879(95)54044-x. [DOI] [PubMed] [Google Scholar]
- 51.Ballas N., Battaglioli E., Atouf F., Andres M.E., Chenoweth J., Anderson M.E., Burger C., Moniwa M., Davie J.R., Bowers W.J., et al. Regulation of neuronal traits by a novel transcriptional complex. Neuron. 2001;31:353–365. doi: 10.1016/s0896-6273(01)00371-3. [DOI] [PubMed] [Google Scholar]
- 52.Ballas N., Grunseich C., Lu D.D., Speh J.C., Mandel G. REST and its corepressors mediate plasticity of neuronal gene chromatin throughout neurogenesis. Cell. 2005;121:645–657. doi: 10.1016/j.cell.2005.03.013. [DOI] [PubMed] [Google Scholar]
- 53.Roberts D.S., Hu Y., Lund I.V., Brooks-Kayal A.R., Russek S.J. Brain-derived Neurotrophic Factor (BDNF)-induced Synthesis of Early Growth Response Factor 3 (Egr3) Controls the Levels of Type A GABA Receptor{alpha}4 Subunits in Hippocampal Neurons. J. Biol. Chem. 2006;281:29431–29435. doi: 10.1074/jbc.C600167200. [DOI] [PubMed] [Google Scholar]
- 54.Frith M.C., Hansen U., Spouge J.L., Weng Z. Finding functional sequence elements by multiple local alignment. Nucleic Acids Res. 2004;32:189–200. doi: 10.1093/nar/gkh169. [DOI] [PMC free article] [PubMed] [Google Scholar]


