

Abstract
Background
It is not clear whether bone turnover markers can be used to make inference regarding changes in bone mineral density (BMD) in untreated healthy elderly men. The present study was designed to address three specific questions: (i) is there a relationship between bone turnover markers and femoral neck BMD within an individual; (ii) is there a relationship between baseline measurements of bone turnover markers and subsequent change in BMD; and (iii) is there a relationship between changes in bone turnover markers and changes in femoral neck BMD?
Methods
The present study was part of the on-going Dubbo Osteoporosis Epidemiology Study, which was designed as a prospective investigation. Men who had had at least 3 sequential visits with serum samples available during follow-up were selected from the study population. Serum C-terminal telopeptide of type I collagen (sICTP), N-terminal propeptide of type I collagen (sPINP) and femoral neck BMD were measured by competitive radioimmunoassays. Femoral neck bone mineral density (BMD) was measured by a densitometer (GE Lunar Corp, Madison, WI). Various mixed-effects models were used to assess the association between the markers and changes in BMD.
Results
One hundred and one men aged 70 ± 4.1 years (mean ± SD) met the criteria of selection for analysis. On average, sPINP decreased by 0.7% per year (p = 0.026), sICTP increased by 1.7% per year (p = 0.0002), and femoral neck BMD decreased by 0.4% per year (p < 0.01). Within-subject analysis indicated that changes in BMD were significantly associated with changes in sPINP (p = 0.022), but not with changes in sICTP (p = 0.84). However, neither baseline sPINP (p = 0.50) nor baseline sICTP (p = 0.63) was associated with subsequent changes in BMD. Moreover, changes in BMD were not significantly associated with previous changes in sPINP (p = 0.13) or sICTP (p = 0.95).
Conclusion
These results suggest that in elderly men of Caucasian background, changes in sPINP were inversely related to changes in BMD within an individual. However, neither sPINP nor sICTP was sufficiently sensitive to predict the rate of change in BMD for a group of individuals or for an individual.
Background
That the continuous remodeling process of bone formation and bone resorption can be measured by biochemical bone turnover markers is well-established; however, due to their substantial intra-subject variability, it remains controversial whether these indices are useful in the clinical setting. Being able to predict the change in bone mineral density (BMD) for an individual is of importance, as it may help to manage the disease progression and potentially provides an opportunity for intervention to reduce the fracture risk for the individual. A number of studies, mainly in women, have suggested that the association between bone turnover markers and change in BMD ranged from non-significant [1] or weak [2-4] to moderate association [5].
Bone loss (as measured by BMD) is less pronounced in men than in women [6,7], and the association between bone turnover markers and BMD is unclear. Cross-sectional studies in men have demonstrated that PINP, a bone formation marker, decreases with advancing age, but was paradoxically negatively correlated with BMD [8,9]. In a prospective study, again in elderly men, an increase in either PINP or ICTP was associated with increased loss of femoral neck BMD [10]. However, most of these studies were cross-sectional nature, and therefore, important questions on the within-subject relationships between bone turnover markers and change in BMD could not be addressed.
The present study was designed to examine the association between baseline measures and change in two bone markers and BMD in a sample of well-characterized elderly men. Three specific questions were asked: First, is there a relationship between bone turnover markers and femoral neck BMD within an individual? Second, is there a relationship between baseline measurements of bone turnover markers and change in BMD after controlling for unmeasured factors? These "unmeasured factors" were modeled by including a term for year, along with random factor terms for individual. Third, is there a causal relationship between changes in bone turnover markers and changes in femoral neck BMD?
Methods
Study subjects
The present study was part of the Dubbo Osteoporosis Epidemiology Study (DOES) for which the study design and protocol have been described elsewhere [11]. Briefly, DOES is a longitudinal, population-based study of risk factors for fracture and mortality. The study was approved by the St Vincent's Hospital Ethics Committee. Written informed consent was obtained from each subject. The study was initiated in mid-1989 and has been on-going since. By February 2003, 989 men and 1661 women had participated in the study.
Because the aim was to assess the association between changes in markers of bone turnover and changes in BMD, the present study included only men who have been longitudinally followed for at least 3 visits with serum samples available during follow-up period. Men with bone diseases, fractures, acute or chronic illnesses (i.e. cardiac failure, renal and liver insufficiency, and cancer), hypogonadism, or men on any medication affecting bone metabolism (i.e., glucocorticoids, calcitonin, anticonvulsants, and vitamin D or analogues) were excluded from the study. Ultimately, data from 101 men were included in the analysis. The median duration of follow-up was 6 years. All men have been scheduled for periodical visits, separated by an average of 2 years.
Measurements
After obtaining written informed consent, subjects were interviewed by a nurse co-ordinator who administered a structured questionnaire to collect data including age, anthropometric variables, life-style and clinical. Serum samples were collected in the non-fasting state and stored at -80°C until analysis.
A marker of bone formation, serum N-terminal propeptide of type I collagen (sPINP) and a marker of bone resorption, serum C-terminal telopeptide of type I collagen (sICTP) were measured in duplicate by competitive radioimmunoassays (Orion Diagnostica, Espoo, Finland) [12,13]. The reproducibility of sPINP was 3.1 to 7.7%, with a male reference range being 21 to 78 μg/L. The reproducibility of sICTP was 6.7 to 8.5%, with a male reference range being 1.4 to 5.2 μg/L. All laboratory analyses were carried out in batches with all samples from a single subject run in one assay. The same batch of the respective assay was used for all measurements.
BMD was measured at the lumbar spine and femoral neck by dual energy X-ray absorptiometry using a LUNAR DPX densitometer (GE Lunar Corporation, Madison, WI, USA). The coefficient of reliability of BMD in our institution in normal subjects is 0.96, and the coefficient of variation was 1.5% at the proximal femur [14]. Quality control was performed regularly by using phantom to ensure the reliability of the densitometer. All BMD measurements were performed by the same operator and the same DXA instrument by a standardized protocol of measurement.
The primary dependent (outcome) variable used in this study was change in femoral neck BMD. This choice was based on the fact that in elderly men femoral neck BMD measurement is less likely to be affected by degenerative changes than lumbar spine BMD measurement. Thus, the use of femoral neck BMD as an outcome variable permitted a more reliable and valid way to examine the true relationship between PINP and ICTP and bone mineral density.
Statistical analysis
To take full advantage of the hierarchical structure and longitudinal nature of the study, a mixed-effects linear model was considered. Various mixed-effects models containing both fixed and random effects and adjusted for the within-subject correlation [15] were considered. Model development was guided by the research questions. Details of these statistical models are shown in the Appendix. Briefly, the analysis began with the estimation of the baseline value and rate of change in BMD for each individual, assuming a linear function of time. The baseline value here refers to the intercept of an individual [15]. The collection of the rates of change across individuals was assumed to be normally distributed with a mean β and variance . To address the first question (i.e., within-subjects correlation between bone turnover markers and BMD), a slight modification of the above model was considered in that association between bone turnover markers and BMD, the variation of BMD within an individual was modeled as a linear function of the individual's sPINP or sICTP over time. To address the second question (i.e., association between baseline bone turnover markers and subsequent changes in BMD), the individual intercepts and slopes of the outcome-time model were modeled as a linear function of baseline measurements of PINP and ICTP. The SAS PROC MIXED procedure [16] was used to derive estimates of the mixed-effects model parameters. Finally, to address the causative relationship between change in bone turnover markers and change in BMD, a first-order autoregressive model was used. In this model, the difference in BMD between visit 3 and visit 2 (BMD3-2) was modeled as a linear function of the difference in PINP (or ICTP) between visit 2 and visit 1 (PINP2-1 or ICTP2-1) such that BMD3-2 = α + β (PINP2-1) + γ (ICTP2-1) + e, where e is the residual error term, and α, β and γ are regression coefficients to be estimated from the sample of 101 individuals. The estimates of these parameters were obtained by the least squares method with PROC REG of the SAS systems [17].
Results
The 101 men had been followed for a median of 6 years (range: 4 to 10 years). At baseline (first visit) the men's average age was 70 years (SD: 4.1 years) (Table 1). All bone turnover markers and BMD measurements were normally distributed with no evidence of outliers or skewness of distribution. Cross-sectionally, there was a weak and statistically non-significant correlation between baseline femoral neck BMD and baseline PINP (r = -0.14; p = 0.14) and ICTP (r = 0.15, p = 0.14) (Figure 1).
Table 1.
Characteristics of study subjects at baseline
| Variable | Mean (standard deviation) | 5th and 95th quantile |
| Age (yr) | 70.4 (4.1) | 66, 82 |
| Weight (kg) | 80.5 (12.3) | 63, 102 |
| Height (cm) | 173.7 (6.4) | 162, 183 |
| Body mass index (kg/m2) | 26.6 (3.4) | 22.3, 34.3 |
| sPINP(μg/L) | 39.8 (13.1) | 22.8, 67.1 |
| sICTP (μg/L) | 4.2 (1.1) | 2.9, 6.8 |
| Lumbar spine BMD (g/cm2) | 1.29 (0.21) | 0.98, 1.68 |
| Femoral neck BMD (g/cm2) | 0.95 (0.13) | 0.73, 1.15 |
| Duration of follow-up (yrs) | 5.9 (1.5) | 4.0, 8.9 |
sICTP, serum C-terminal telopeptide of type I collagen; sPINP, serum N-terminal propeptide of type I collagen; BMD bone mineral density.
Figure 1.
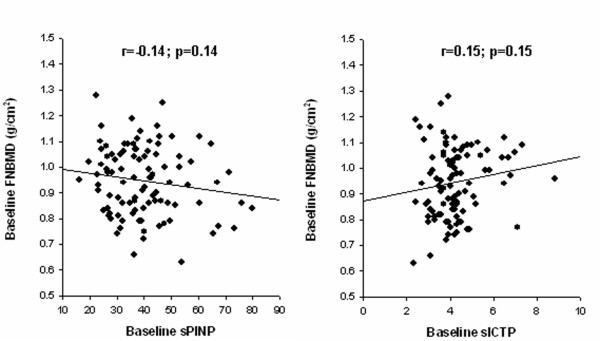
Relationship between baseline sPINP (left panel) or sICTP (right panel) and femoral neck BMD.
Rates of change in BMD, sPINP and sICTP
In longitudinal analyses (Table 2), femoral neck BMD decreased by 3.5 ± 1.0 mg/cm2 per year (mean ± SE; p < 0.001), while lumbar spine BMD increased by 7 ± 1.3 mg/cm2 per year (p < 0.001). When expressed in percentage terms, these changes were equivalent to -0.4% per year for the femoral neck and +0.6% per year for the lumbar spine. As indicated by the estimated variance of slopes (), the rates of change in femoral neck BMD varied significantly among individuals (44 ± 16; p = 0.004); however, the rate of change in lumbar spine BMD did not differ significantly among individuals (p = 0.47). The non-significant covariance () suggests that the baseline and rate of change in BMD were not significantly correlated.
Table 2.
Rates of change in bone mineral density and bone turnover markers
| Symbol | Estimated parameters ± standard error (SE) for | ||||
| Femoral neck BMD | Lumbar spine BMD | sPINP | sICTP | ||
| Parameters | |||||
| Baselinea | α | 943.0 ± 13** | 1288.0 ± 20.3** | 40. 1 ± 1.3* | 4.3 ± 0.12** |
| Rate of changeb | β | -3.5 ± 1.0** | 7.4 ± 1.3** | -0.4 ± 0.18* | 0.08 ± 0.02* |
| Variance components | |||||
| Baseline | 16650 ± 2453** | 38968 ± 5883** | 130.8 ± 25* | 0.81 ± 0.22** | |
| Rate of change | 44 ± 6* | 2 ± 30 | 0.4 ± 0.51 | 0.01 ± 0.05 | |
| Covariance | 43 ± 135 | 876 ± 283** | -1.1 ± 2.7 | 0.07 ± 0.03** | |
| Random error | 908 ± 131** | 3234 ± 327** | 52.6 ± 6.8** | 0.84 ± 0.08** | |
sICTP, serum C-terminal telopeptide of type I collagen; sPINP, serum N-terminal propeptide of type I collagen; BMD bone mineral density.
Units of measurement: abaseline parameters were expressed in mg/cm2 (for bone mineral density) and μg/L (for sPINP and sICTP); brate of change: mg/cm2 per year (for bone mineral density) and μg/L per year (for sPINP and sICTP).
Note of interpretation: For femoral neck BMD, the overall average baseline measurement was 943 mg/cm2, and the rate of change was -3.5 mg/cm2 per year. The standard deviation (SD) of baseline BMD among individuals was = 129 mg/cm2, and the SD of rates of change among individuals was = 6.6 mg/cm2. More importantly, the variance in BMD within individuals was 908 mg2/cm4. The covariance was not statistically significant, which suggests that there was no significant correlation between the baseline measurements and rates of change in BMD.
Statistical significance is indicated by *p < 0.05; ** 0.001 < p < 0.05, and *** p < 0.0001.
The marker of bone formation, sPINP, decreased at the rate of -0.4 ± 0.18 μg/L or 0.7% per year (p = 0.026), whereas the resorption marker, sICTP, increased by 0.08 ± 0.02 μg/L or 1.7% per year (p = 0.0002). There was no statistically significant variation in the rates of change in sICTP or sPINP among individuals.
When comparing the unconditional linear change model with the unconditional mean model, 34% of the within-subject variance in BMD was attributable to time. However, time explained a modest proportion of within-subject variance in sPINP (10%) and sICTP (7%).
Relationships between BMD and sPINP or sICTP within individuals
Results of the mixed-effects analysis suggests that after adjusting for the effect of age, each unit increase in sPINP was associated with a decrease of 9.2 ± 4.4 mg/cm2 (p = 0.022) in femoral neck BMD. However, there was no significant association between changes in sICTP and changes in femoral neck BMD (p = 0.84) (Table 3). Compared with the unconditional linear change model in Table 2, the inclusion of sPINP or sICTP in the model accounted for a further 0.5% and 0.1% reduction in the within-subject variance in BMD, respectively.
Table 3.
Within-subject association between femoral neck BMD and bone turnover markers.
| Symbol | Estimate ± SE | P-value | |
| Analysis marker: sPINP | |||
| Estimated parameters | |||
| Intercept (baseline) | α | 944 ± 13 | <0.0001 |
| Rate of change | β | -3.7 ± 1.0 | 0.0004 |
| sPINP | γ | -9.2 ± 4.4 | 0.022 |
| Variance components | |||
| Baseline | 16428 ± 2425 | <0.001 | |
| Rate of change | 38 ± 16 | 0.009 | |
| Covariance | 72 ± 131 | 0.586 | |
| Random error | 903 ± 134 | <0.001 | |
| Analysis marker: sICTP | |||
| Estimated parameters | |||
| Intercept (baseline) | α | 943 ± 13 | <0.0001 |
| Rate of change | β | -3.4 ± 1.0 | 0.0013 |
| sICTP | γ | -0.7 ± 3.6 | 0.8425 |
| Variance components | |||
| Baseline | 16677 ± 2462 | <0.0001 | |
| Rate of change | 44 ± 16 | 0.0041 | |
| Covariance | 43 ± 135 | 0.7526 | |
| Random error | 907 ± 130 | <0.0001 | |
sICTP, serum C-terminal telopeptide of type I collagen; sPINP, serum N-terminal propeptide of type I collagen; BMD bone mineral density.
Note of interpretation: Results in part (a) suggest that the BMD measurement (mg/cm2) for a subject at time t (denoted by BMDt) can be represented by the equation: BMDt = 944 – 3.7*Year – 9.2* sPINPt, where "Year" is 0, 1, 2, ..., and sPINPt is the measurement of sPINP at time t for the subject. In other words, femoral neck BMD was decreased by -3.7 mg/cm2 per year. Furthermore, each 1 μg/L increase in sPINP was associated with a 9.2 mg/cm2 decrease in BMD. The interpretation of variance components is similar to that in Table 2. For example, the SD of baseline BMD among individuals was = 129 mg/cm2, and the SD of rates of change among individuals was = 6.6 mg/cm2. The within-individuals variance in BMD was 907 mg2/cm4, a slight reduction from 908 mg2/cm4 (Table 2), which suggests that including sPINP did not have a substantial effect on the within-subjects variance in BMD.
Relationships between baseline sPINP or sICTP and change in BMD
Further analysis suggested that the rate of change in femoral neck BMD was not significantly correlated to baseline sPINP (p = 0.28) or sICTP (p = 0.71). Compared with the model shown in Table 3, the inclusion of baseline sPINP or sICTP did not significantly reduce the within-subject variance in BMD (Table 4 and Figure 2).
Table 4.
Association between baseline PINP, ICTP and change in femoral neck BMD
| Symbol | Estimate ± SE | P-value | |
| Analysis marker: sPINP | |||
| Estimated parameters | |||
| Intercept (baseline) | α | 943 ± 13 | <0.0001 |
| Rate of change | β | -3.5 ± 1.0 | 0.0004 |
| sPINP | γ | 0.7 ± 1.1 | 0.4953 |
| Variance components | |||
| Baseline | 16661 ± 2454 | <0.001 | |
| Rate of change | 44 ± 16 | 0.004 | |
| Covariance | 54 ± 131 | 0.692 | |
| Random error | 902 ± 130 | <0.001 | |
| Analysis marker: sICTP | |||
| Estimated parameters | |||
| Intercept (baseline) | α | 943 ± 13 | <0.0001 |
| Rate of change | β | -3.6 ± 1.0 | 0.0008 |
| sICTP | γ | -0.6 ± 1.3 | 0.629 |
| Variance components | |||
| Baseline | 16643 ± 2453 | <0.0001 | |
| Rate of change | 43 ± 16 | 0.0041 | |
| Covariance | 56 ± 139 | 0.6848 | |
| Random error | 907 ± 131 | <0.0001 | |
sICTP, serum C-terminal telopeptide of type I collagen; sPINP, serum N-terminal propeptide of type I collagen; BMD bone mineral density.
Note of interpretation: Results in part (a) suggest that the BMD measurement (mg/cm2) for a subject at time t (denoted by BMDt) can be represented by the equation: BMDt = 943 – 3.5*Year – 9.2* sPINP0, where "Year" is 0, 1, 2, ..., and sPINP0 is the measurement of sPINP at baseline for the subject. In other words, femoral neck BMD was decreased by -3.5 mg/cm2 per year. There was no significant association between baseline sPINP and change in BMD (p = 0.4953). The interpretation of variance components is similar to that in Table 3.
Figure 2.
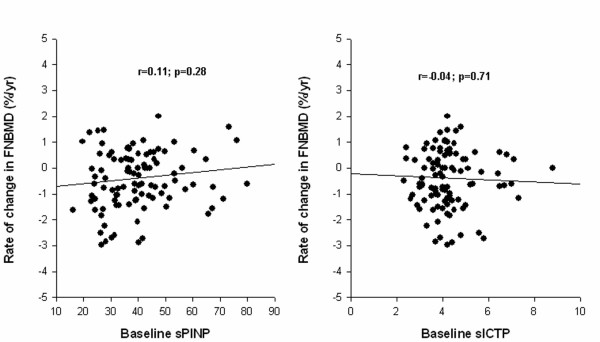
Relationship between change in femoral neck BMD and baseline sPINP (left panel) or sICTP (right panel).
Causal relationship between change in femoral neck BMD and change in sPINP
Changes in sPINP and sICTP between visit 2 and visit 1 were not significant predictors of subsequent change in femoral neck BMD between visit 3 and visit 2 (Figure 3). However, the relationship was consistent with results from the within-subject analysis. For instance, each unit increase in sPINP between visit 2 and visit 1 was related to a subsequent decrease in femoral neck BMD of 0.6 ± 0.4 mg/cm2, but the relationship was not statistically significant (p = 0.18).
Figure 3.
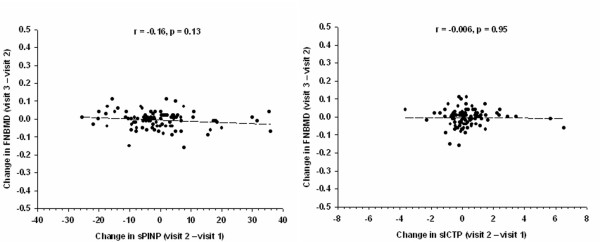
Relationship between change in femoral neck BMD (between visit 2 and visit 1) and change in sPINP (between visit 2 and visit 1) (left panel), and change in sICTP (right panel).
Discussion
Bone loss results from an imbalance between the two processes of bone resorption and bone formation, which can be measured by bone turnover markers. One of the suppositions in using bone turnover markers is to make inference regarding the magnitude of changes in bone density. In this study of untreated elderly men, a significant increase in bone resorption (as measured by sICTP), decrease in bone formation (as measured by sPINP), and decrease in femoral neck BMD were observed. Despite this, neither baseline measurement of, nor the change in, sPINP or sICTP predicted the subsequent rate of change in BMD.
It should be noted that the rate of change in BMD and the rate of change in either serum markers of bone turnover in this study was modest. However, such modest changes should not affect the predictive relationship between the bone turnover markers and BMD, should it exist, as the variance of rates of change was substantial in both markers and BMD. Furthermore, the current sample size had a more than 80% chance to detect a correlation of 0.2 at the significance level of 5% should the association exist: the sample size required to detect a correlation of 0.25 at the significance level of 5% is approximately 62 subjects). Therefore, the present study's non-significant results are unlikely to be due to the study's power or the distribution of bone loss of change in sPINP or sICTP.
In elderly women, a combination of three biochemical markers accounted for more than 50% of the variance in bone mineral density [18]. Skeletal turnover rates appear to be as much as 85% higher in elderly women with low bone mass, compared with women who have normal bone density. Furthermore, in a large prospective study of elderly postmenopausal women in Europe [19], levels of osteocalcin, C-telopeptides, and bone-specific alkaline phosphatase were all significantly greater in older than younger women. Furthermore, these bone formation markers were inversely related to femoral bone mineral density.
However, the situation in men remains largely unclear. In a relatively small longitudinal study of 24 men, whose BMD, sPINP and sICTP were measured 3 years apart, change in BMD was significantly and inversely correlated with change in sPINP (r = -0.24; p = 0.05) and change in sICTP (r = -0.24; p = 0.01) [10]. However, it was not clear from that study whether both factors were independent predictors of BMD change if they were considered simultaneously in the same model, or whether baseline sPINP and sICTP was predictive of subsequent change in BMD. These results together with those of the present study clearly suggest that the contribution of bone turnover markers to the prediction of change in BMD is minimal. Indeed, variation in sPINP and sICTP accounts for less than 1% of the variance of rates of change in BMD within subjects.
In interpreting the association between bone turnover markers and BMD, it is important to make distinction between a between-subject correlation from within-subject correlation between change in sPINP (or sICTP) and change in BMD. Previous studies [20,21] examined the between-subject correlation, whereas the present study primarily examined the within-subjects association. For example, it was observed in this study that although the between-subject correlation between sICTP and femoral neck BMD was statistically significant (r = 0.15, p = 0.03), the within-subject correlation was not. Thus, while individuals with higher/lower levels of sICTP may have lower/higher BMD, the increase in sICTP within an individual does not necessarily translating into a decrease in BMD. More importantly, there was no causal relationship between change in either sICTP or sPINP and change in BMD, as the preceding change in the markers was not a significant predictor of subsequent change in BMD.
A number of studies in women have suggested that a baseline measurement of bone resorption markers such as urinary CTx [19], urinary NTx [19], urinary free dPyr [22] and sICTP [23] was each associated with fracture risk [5]. Thus, although sICTP was not a significant predictor of change in BMD it is a predictive of fracture risk, independent of BMD. Indeed, in this cohort, baseline measurement of sICTP, but not sPINP, was found to be an independent predictor of fracture risk, such that a combination of sICTP and femoral neck BMD yielded a better predictive value than either measurement [24].
Measurements of bone turnover markers in serum are generally considered to be more reliable and more accurate than those measured in urine, as the confounding errors associated with creatinine measurement are largely eliminated. Nevertheless, the within-subject biological variation in sPINP and sICTP was around 20% [5], which in turn can be attributed to factors such as non-uniform rates of bone turnover, variable rates of metabolism and clearance, diurnal and seasonal variability, and other factors affecting pre-analytic variability. This relatively large variation in bone turnover markers can compromise the relationship between change in these markers and change in BMD within an individual.
Inaccuracy and unreliability of measurements, including within-subject random variability, can affect the delineation of the association between bone turnover markers and BMD or fracture risk in some epidemiological studies. Theoretically, if the coefficients of reliability of BMD and sPINP are r1 and r2, respectively, then it can be shown that the maximum squared correlation between the two variables is r1r2 [25]. In our study, r1 = 0.96 and r2 = 0.91, then the maximally expected squared correlation between BMD and sPINP is 0.87. However, in reality the correlation was 0.0196. Given the imprecision, this correlation could be about 0.0196/0.87 = 0.022. Therefore, it seems the imprecision of measurement did not account for the modest association that we observed in this study.
The decrease in sPINP and increase in sICTP observed in this study are indications of reduced bone formation and increased bone resorption activities. This is consistent with the established fact that androgen levels (free or available testosterone) decrease with advancing age [26,27]. Reduced testosterone is associated with bone loss in men [28], probably associated with a reduction in vitamin D levels leading to calcium malabsorption and reduced bone formation [29]. Recently, the important role of estrogen in the regulation of bone metabolism in men has been recognized [30], because estrogen controls bone resorption in elderly men [31]. The present study did not measure estrogen in these men, therefore it was not possible to examine the relationship between estrogen and the bone turnover markers. Although vitamin D was not measured in these men, in a study of men in the same cohorts from whom the present study's men were selected, the prevalence of vitamin D deficiency was extremely low (less than 1%). Thus, the present study's result was unlikely to be compromised by vitamin D status.
Conclusion
In summary, the present study suggests that in a group of non-treated elderly men of Caucasian background, the change in the rate of bone formation, as measured by sPINP, was associated with the change in BMD within a subject. However, neither sPINP nor sICTP was sufficiently sensitive to predict the rate of change in BMD for a group of individuals or for an individual.
Competing interests
The author(s) declare that they have no competing interests.
Authors' contributions
TVN, CM, JAE and MJS were involved in the conceptual discussion and design of the study. CM carried out the biochemical analyses. TVN performed the statistical analysis and drafted the manuscript. JRC was involved in the data collection. TVN, JAE and JRC obtained the funding for the Dubbo Osteoporosis Epidemiology Study. All authors read and approved the final manuscript.
Appendix: mixed-effects models
In what follows i denotes study subjects (i = 1, 2, 3, ..., 101), and t denotes visits (t = 1, 2, 3). The measurement of each outcome variable, BMD, PINP, and ICTP, taken at the tth visit for the ith subject is denoted by BMDit, PINPit, and ICTPit, respectively. The duration of follow-up for the tth visit, calculated from the initial visit, is denoted by Tit, where Ti1 = 0. The change in each outcome variable for each subject was first modeled as a linear function of time (also called the unconditional linear growth model) as follows:
BMDit = αi + βiTit + eit (1)
where α i denotes the BMD measurement at the initial visit (baseline value) and β i denotes the rate of change in BMD per year for the ith subject, and eit denotes the within-subject random variation. The baseline BMD of the ith subject was then modeled as a function of population mean, α, and a deviation from the population mean, ri: αi = α + ri. Similarly, the rate of change for the ith subject was assumed to be equal to an overall mean rate of change, β, and a deviation from the mean associated with the ith individual, si: βi = β + si. Therefore, the BMD values of the ith subject in (1) can now be written as:
BMDit = α + βTit + ri + siTit + eit (2)
PINPit and ICTPit were also modeled similarly. It is assumed that eit are independently normally distributed with mean 0 and variance . The distributions of ri and si are assumed to be normal with mean 0, variances of and , respectively, and a covariance of .
For interpretation, α represents the population mean of an outcome measure (i.e., BMD, PINP or ICTP), β represents the average linear annual rate of change in the outcome measure; represents the within-subject variance or the pooled deviation of each subject's measure around his "true" average; is the between-subject variance of the measure; is the between-subject variance of the linear rates of change in the measure; and represents the correlation between the true average and the rate of change. The estimates of α, β, , , , and are shown in Table 2.
To address the first aim (e.g., is there an association between PINP or ICTP and BMD within individuals), model (1) was extended to accommodate the effect of PINP or ICTP:
BMDit = αi + βiTit + γ(PINPit) + eit
or BMDit = αi + βiTit + γ(ICTPit) + eit (3)
where αi = α + ri, βi = β + si as above, and γ i are assumed to be a fixed effect. Note that unlike α i and β i, the coefficient associated with PINP or ICTP is assumed to be a constant across subjects. Therefore, the BMD values of the ith subject can now be written as: BMDit = α + βTit + γPINPit + ri + siTit + eit or BMDit = α + βTit + γICTPit + ri + siTit + eit. The estimates of α, β, γ, , , , and are shown in Table 3.
To address the second aim (e.g., whether baseline PINP or ICTP predicts the change in BMD), the coefficients of time effects in model (1) was modeled as a function of baseline PINP or ICTP as follows: βi = β + ηPINPi0 + si or βi = β + ηICTPi0 + si Therefore the model becomes:
BMDit = α + (β + ηPINPi0 + si)Tit + ri + eit
BMDit = α + (β + ηICTPi0 + si)Tit + ri + eit (4)
The estimates of α, β, η, , , , and are shown in Table 4.
Pre-publication history
The pre-publication history for this paper can be accessed here:
Acknowledgments
Acknowledgements
We gratefully acknowledge the expert assistance of Janet Watters and Donna Reeves in the interview, data collection and measurement bone densitometry; and the invaluable help of the staff of Dubbo Base Hospital. We also thank Natasa Ivankovic for the management of the data base. This work has been supported by the National Health and Medical Research Council of Australia. C. Meier is the recipient of a medical research fellowship from the Swiss National Science Foundation (Nr. 81BS-67544).
Contributor Information
Tuan V Nguyen, Email: t.nguyen@garvan.org.au.
Christian Meier, Email: christian.meier@unibas.ch.
Jacqueline R Center, Email: j.center@garvan.org.au.
John A Eisman, Email: j.eisman@garvan.org.au.
Markus J Seibel, Email: mjs@med.usyd.edu.au.
References
- Keen RW, Nguyen T, Sobnack R, Perry LA, Thompson PW, Spector TD. Can biochemical markers predict bone loss at the hip and spine?: a 4-year prospective study of 141 early postmenopausal women. Osteoporos Int. 1996;6:399–406. doi: 10.1007/BF01623014. [DOI] [PubMed] [Google Scholar]
- Dresner-Pollak R, Parker RA, Poku M, Thompson J, Seibel MJ, Greenspan SL. Biochemical markers of bone turnover reflect femoral bone loss in elderly women. Calcif Tissue Int. 1996;59:328–333. doi: 10.1007/s002239900135. [DOI] [PubMed] [Google Scholar]
- Bauer DC, Sklarin PM, Stone KL, Black DM, Nevitt MC, Ensrud KE, Arnaud CD, Genant HK, Garnero P, Delmas PD, Lawaetz H, Cummings SR. Biochemical markers of bone turnover and prediction of hip bone loss in older women: the study of osteoporotic fractures. J Bone Miner Res. 1999;14:1404–1410. doi: 10.1359/jbmr.1999.14.8.1404. [DOI] [PubMed] [Google Scholar]
- Garnero P, Sornay-Rendu E, Duboeuf F, Delmas PD. Markers of bone turnover predict postmenopausal forearm bone loss over 4 years: the OFELY study. J Bone Miner Res. 1999;14:1614–1621. doi: 10.1359/jbmr.1999.14.9.1614. [DOI] [PubMed] [Google Scholar]
- Looker AC, Bauer DC, Chesnut CH, 3rd, Gundberg CM, Hochberg MC, Klee G, Kleerekoper M, Watts NB, Bell NH. Clinical use of biochemical markers of bone remodeling: current status and future directions. Osteoporos Int. 2000;11:467–480. doi: 10.1007/s001980070088. [DOI] [PubMed] [Google Scholar]
- Nguyen TV, Sambrook PN, Eisman JA. Bone loss, physical activity, and weight change in elderly women: the Dubbo Osteoporosis Epidemiology Study. J Bone Miner Res. 1998;13:1458–1467. doi: 10.1359/jbmr.1998.13.9.1458. [DOI] [PubMed] [Google Scholar]
- Ensrud KE, Palermo L, Black DM, Cauley J, Jergas M, Orwoll ES, Nevitt MC, Fox KM, Cummings SR. Hip and calcaneal bone loss increase with advancing age: longitudinal results from the study of osteoporotic fractures. J Bone Miner Res. 1995;10:1778–1787. doi: 10.1002/jbmr.5650101122. [DOI] [PubMed] [Google Scholar]
- Fatayerji D, Eastell R. Age-related changes in bone turnover in men. J Bone Miner Res. 1999;14:1203–1210. doi: 10.1359/jbmr.1999.14.7.1203. [DOI] [PubMed] [Google Scholar]
- Szulc P, Delmas PD. Biochemical markers of bone turnover in men. Calcif Tissue Int. 2001;69:229–234. doi: 10.1007/s00223-001-1059-1. [DOI] [PubMed] [Google Scholar]
- Chandani AK, Scariano JK, Glew RH, Clemens JD, Garry PJ, Baumgartner RN. Bone mineral density and serum levels of aminoterminal propeptides and cross-linked N-telopeptides of type I collagen in elderly men. Bone. 2000;26:513–518. doi: 10.1016/S8756-3282(00)00262-3. [DOI] [PubMed] [Google Scholar]
- Nguyen TV, Center JR, Eisman JA. Osteoporosis in elderly men and women: effects of dietary calcium, physical activity, and body mass index. J Bone Miner Res. 2000;15:322–331. doi: 10.1359/jbmr.2000.15.2.322. [DOI] [PubMed] [Google Scholar]
- Risteli J. Clinical chemical methods for assessing connective tissue metabolism. Scand J Clin Lab Invest Suppl. 1990;202:139–142. [PubMed] [Google Scholar]
- Melkko J, Kauppila S, Niemi S, Risteli L, Haukipuro K, Jukkola A, Risteli J. Immunoassay for intact amino-terminal propeptide of human type I procollagen. Clin Chem. 1996;42:947–954. [PubMed] [Google Scholar]
- Nguyen TV, Sambrook PN, Eisman JA. Sources of variability in bone mineral density measurements: implications for study design and analysis of bone loss. J Bone Miner Res. 1997;12:124–135. doi: 10.1359/jbmr.1997.12.1.124. [DOI] [PubMed] [Google Scholar]
- Singer JD, Willett JB. Applied Longitudinal Data Analysis: Modeling Change and Event Occurence. New York , Oxford University Press, Inc; 2003. [Google Scholar]
- Littell RC, Milliken GA, Stroup WW, Wolfinger RD. SAS System for Mixed Models. Cary, NC , SAS Institute Inc.; 1996. [Google Scholar]
- SAS Institute Inc. Base SAS. 9.1.3 (TS1M3) Cary, NC, USA , SAS Publishing; 2004. Base SAS 9.1.3 Procedures Guide, Volumes 1-4. [Google Scholar]
- Garnero P, Sornay-Rendu E, Chapuy MC, Delmas PD. Increased bone turnover in late postmenopausal women is a major determinant of osteoporosis. J Bone Miner Res. 1996;11:337–349. doi: 10.1002/jbmr.5650110307. [DOI] [PubMed] [Google Scholar]
- Garnero P, Hausherr E, Chapuy MC, Marcelli C, Grandjean H, Muller C, Cormier C, Breart G, Meunier PJ, Delmas PD. Markers of bone resorption predict hip fracture in elderly women: the EPIDOS Prospective Study. J Bone Miner Res. 1996;11:1531–1538. doi: 10.1002/jbmr.5650111021. [DOI] [PubMed] [Google Scholar]
- Scariano JK, Glew RH, Bou-Serhal CE, Clemens JD, Garry PJ, Baumgartner RN. Serum levels of cross-linked N-telopeptides and aminoterminal propeptides of type I collagen indicate low bone mineral density in elderly women. Bone. 1998;23:471–477. doi: 10.1016/S8756-3282(98)00126-4. [DOI] [PubMed] [Google Scholar]
- Greenspan SL, Rosen HN, Parker RA. Early changes in serum N-telopeptide and C-telopeptide cross-linked collagen type 1 predict long-term response to alendronate therapy in elderly women. J Clin Endocrinol Metab. 2000;85:3537–3540. doi: 10.1210/jc.85.10.3537. [DOI] [PubMed] [Google Scholar]
- van Daele PL, Seibel MJ, Burger H, Hofman A, Grobbee DE, van Leeuwen JP, Birkenhager JC, Pols HA. Case-control analysis of bone resorption markers, disability, and hip fracture risk: the Rotterdam study. Bmj. 1996;312:482–483. doi: 10.1136/bmj.312.7029.482. [DOI] [PMC free article] [PubMed] [Google Scholar]
- Akesson K, Ljunghall S, Jonsson B, Sernbo I, Johnell O, Gardsell P, Obrant KJ. Assessment of biochemical markers of bone metabolism in relation to the occurrence of fracture: a retrospective and prospective population-based study of women. J Bone Miner Res. 1995;10:1823–1829. doi: 10.1002/jbmr.5650101127. [DOI] [PubMed] [Google Scholar]
- Meier C, Nguyen TV, Center JR, Seibel MJ, Eisman JA. Bone resorption and osteoporotic fractures in elderly men: the dubbo osteoporosis epidemiology study. J Bone Miner Res. 2005;20:579–587. doi: 10.1359/JBMR.041207. [DOI] [PubMed] [Google Scholar]
- Lachin JM. The role of measurement reliability in clinical trials. Clin Trials. 2004;1:553–566. doi: 10.1191/1740774504cn057oa. [DOI] [PubMed] [Google Scholar]
- Gray A, Feldman HA, McKinlay JB, Longcope C. Age, disease, and changing sex hormone levels in middle-aged men: results of the Massachusetts Male Aging Study. J Clin Endocrinol Metab. 1991;73:1016–1025. doi: 10.1210/jcem-73-5-1016. [DOI] [PubMed] [Google Scholar]
- Center JR, Nguyen TV, Sambrook PN, Eisman JA. Hormonal and biochemical parameters and osteoporotic fractures in elderly men. J Bone Miner Res. 2000;15:1405–1411. doi: 10.1359/jbmr.2000.15.7.1405. [DOI] [PubMed] [Google Scholar]
- Gennari L, Merlotti D, Martini G, Gonnelli S, Franci B, Campagna S, Lucani B, Dal Canto N, Valenti R, Gennari C, Nuti R. Longitudinal association between sex hormone levels, bone loss, and bone turnover in elderly men. J Clin Endocrinol Metab. 2003;88:5327–5333. doi: 10.1210/jc.2003-030736. [DOI] [PubMed] [Google Scholar]
- Mawer EB, Davies M. Vitamin D nutrition and bone disease in adults. Rev Endocr Metab Disord. 2001;2:153–164. doi: 10.1023/A:1010002710485. [DOI] [PubMed] [Google Scholar]
- Khosla S, Melton LJ, 3rd, Atkinson EJ, O'Fallon WM, Klee GG, Riggs BL. Relationship of serum sex steroid levels and bone turnover markers with bone mineral density in men and women: a key role for bioavailable estrogen. J Clin Endocrinol Metab. 1998;83:2266–2274. doi: 10.1210/jc.83.7.2266. [DOI] [PubMed] [Google Scholar]
- Falahati-Nini A, Riggs BL, Atkinson EJ, O'Fallon WM, Eastell R, Khosla S. Relative contributions of testosterone and estrogen in regulating bone resorption and formation in normal elderly men. J Clin Invest. 2000;106:1553–1560. doi: 10.1172/JCI10942. [DOI] [PMC free article] [PubMed] [Google Scholar]