

Abstract
DOTA-based complexes of gadolinium bearing a thiol moiety on a propyl or hexyl arm were synthesized. It was hypothesized that these complexes would form reversible covalent linkages with human serum albumin (HSA) which contains a reactive thiol at cysteine-34. The binding constant of the hexyl complex to HSA was measured to be 64 mM−1, decreasing to 17, 6.1 and 3.6 mM−1 in the presence of 0.5, 1 and 2 mM homocysteine, respectively. The binding constant of the propyl complex to HSA was significantly lower, 5.0 mM−1, decreasing to 2.0, 1.5 and 0.87 mM−1 in the presence of 0.5, 1 and 2 mM homocysteine, respectively. The longitudinal water-proton relaxivities of the hexyl and propyl complexes at 37°C and 4.7 T were 2.3 and 2.9 mM−1 s−1, respectively, in saline. The relaxivities of the HSA-bound forms of the hexyl and propyl complexes were calculated to be 5.3 and 4.5 mM−1 s−1, respectively. The in vivo pharmacokinetics of both thiol complexes were altered by a chase of homocysteine but not saline, while the washout of GdDTPA was unaffected by either chase. Such redox-sensitive reversible binding of gadolinium complexes to plasma albumin can be exploited for imaging tissue redox and the blood-pool by MRI.
Keywords: gadolinium, redox, blood-pool, albumin, thiol
INTRODUCTION
Solid tumors are characterized by low pH, hypoxia, and a chaotic and leaky vasculature. In general, these characteristics of tumors are associated with adverse clinical outcomes, resistance to radiotherapy and chemotherapies, likelihood of tumor recurrence and metastases, and shorter patient survival (1–3). Recent evidence points to the increased production of antioxidants by cells in hypoxic regions (4). Electron Paramagnetic Resonance (EPR) has shown that hypoxic regions in xenograft tumors are indeed highly reducing (5–7). The thiol/disulfide redox status of the extracellular milieu is correlated with tumor radiosensitivity (8) and sensitivity to platinum-based anticancer drugs (9–10). Emerging evidence also indicates that a reducing extracellular microenvironment aids tumor cell survival and proliferation (11–14). Several drugs have been designed to target tumor cells in such hypoxic-reducing microenvironments (15–18). Methods for imaging tumor redox status would allow non-invasive assessment of this potential biomarker of tumor sensitivity to existing and novel platinum-based and redox-active therapies as well as radiotherapy. Utility could also extend to other pathologies such as cardiovascular disease, since free radical formation is associated with deleterious effects on coronary microcirculation during recovery from myocardial infarctions (19).
The protected Cys34 site in Human Serum Albumin (HSA) binds thiols as well as other small molecules and metal ions (20). Takeda and co-workers studied the mechanism of transport of the radiological imaging agent 99mTc coupled to homocysteine and cysteine, which they found to accumulate in experimental tumors (21, 22). A large fraction of injected 99mTc-Homocysteine was albumin-bound, indicating that 99mTc-Homocysteine spontaneously bound to plasma albumin in vivo (21). 99mTc-Homocysteine was found to only bind mercaptalbumin, and not nonmercaptalbumin (23), suggesting an essential role for the Cys34 residue (24). They also found that injecting reduced glutathione (GSH), homocysteine or cysteine intravenously into an animal pre-dosed with 99mTc-Homocysteine sharply decreased vascular retention time of the radionuclide. In vitro analyses showed that this was due to conversion of albumin from the mercapto- to nonmercapto- form (23).
We have synthesized DO3A-based thiol complexes of gadolinium designed to exploit this redox-sensitive binding site on albumin. We present in vitro evidence of reversible redox-sensitive binding of two such complexes to HSA. We also present in vivo evidence of spontaneous binding of these complexes to circulating plasma albumin in mice. The potential for use of such complexes of gadolinium as redox-sensitive or blood-pool contrast agents for MRI is discussed.
METHODS
Synthesis of Gd-DO3A-NH-(CH2)n-SH, n = 3 & 6
Two representatives of the family of HSA-binding thiols with the general structure shown in figure 1, where n = 3 and 6, were synthesized as depicted in figure 2 and as described in the following protocol.
Figure 1.
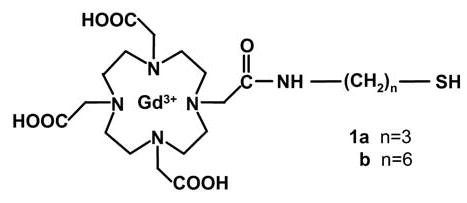
General structure of Gd-DO3A-NH-(CH2)n-SH. Two compounds, 1a with n=3 and 1b with n=6, were synthesized as described herein.
Figure 2.
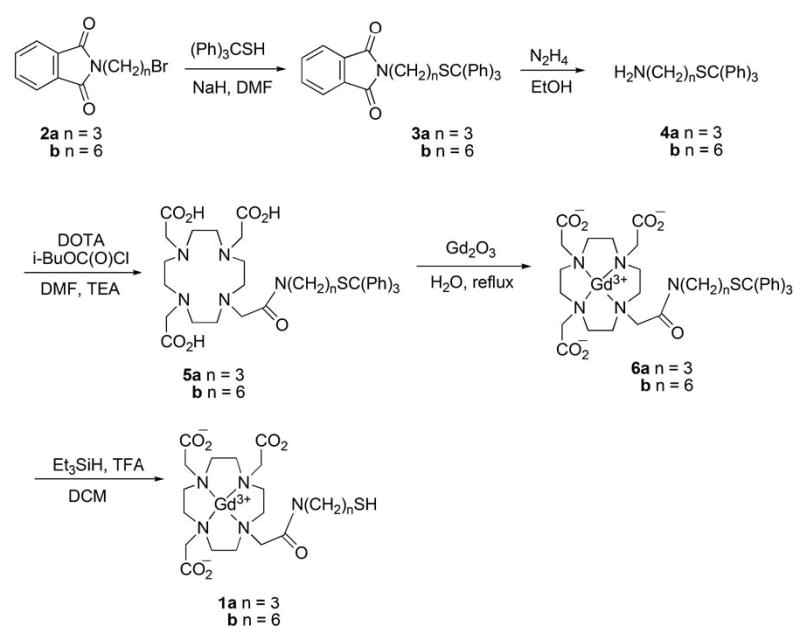
Synthesis of Gd-DO3A-NH-(CH2)n-SH homologs 1a and 1b.
Synthesis of Tritylthiopropylphthalimide (3a)
To a suspension of NaH (0.624 g, 26 mmol) in dry DMF (20 mL) was added trityl mercaptan (6.52 g, 23 mmol) in three portions with cooling under an argon atmosphere. After 0.5 h, a solution of 3-bromopropylphthalimide (2a) (7.0 g, 26 mmol) in DMF (20 mL) was added dropwise to the reaction mixture, which was then stirred for 5 min with cooling and then at room temperature overnight. A mixture of 200 mL of petroleum ether/ether (4:1) was added to the reaction mixture to precipitate NaBr. The precipitate was removed by filtration and the filtrate evaporated to dryness under vacuum. The residue was titurated with petroleum ether to afford 9.5 g of 3a (20 mmol, 79%) as a white powder, mp 137–140 °C. 1H NMR (300 MHz, CDCl3) δ 1.68 (2, quintet, J = 7.2 Hz), 2.18 (2, t, J = 7.5 Hz), 3.57 (2, t, J = 6.9 Hz), 7.09–7.14 (3, m), 7.19–7.24 (6, m), 7.36–7.40 (6, m), 7.66 (2, dd, J = 5.4, 3.0 Hz), 7.79 (2, dd, J = 5.4, 3.3 Hz); 13C NMR (75 MHz, CDCl3) δ 27.8, 29.2, 37.1, 66.6, 123.0, 126.4, 127.7, 129.4, 131.9, 133.7, 144.6, 167.9; MS-FAB+ (M+H+) not observed, 243.36 [(Ph)3C-]
Synthesis of Tritylthiopropylamine (4a)
To a suspension of 3a (6.0 g, 12.95 mmol) in absolute EtOH (75 mL) was added 98.5% hydrazine (1.03 g, 32.4 mmol) and the mixture heated at 45 °C for 0.5 h. The resulting solid was removed by filtration and the filtrate evaporated to dryness under reduced pressure. Chloroform (100 mL) was added to the residue, the mixture stirred for 0.5 h, and filtered. The precipitate was washed with CHCl3 (100 mL) and the combined organic fractions washed with water (3×100 mL), dried (Na2SO4), filtered, and concentrated. Flash chromatography (CHCl3/benzene/EtOH/aq NH4OH (4:2:1:0.1)) afforded 3.91 g (11.74 mmol, 85%) of 4a as a white solid, mp 48–50 °C. 1H NMR (300 MHz, CDCl3) δ1.08 (2, br s), 1.51 (2, quintet, J = 7.2 Hz), 2.19 (2, t, J = 7.5 Hz), 2.60 (2, t, J = 6.9 Hz), 7.16–7.28 (9, m), 7.41 (6, m); 13C NMR (75 MHz, CDCl3) δ 29.1, 32.4, 41.1, 66.4, 126.4, 127.7, 129.4, 144.7; MS-ESI (M+H+) calculated for C22H24NS 334.1, found 333.7.
Synthesis of 1,4,7-Tris(carboxymethyl)-10-(N-(3-trityl-thiopropyl)carbamoyl] 1,4,7,10-tetraazacyclododecane (5a)
1,4,7,10-Tetraazacyclododecane-1,4,7,10-tetraacetic acid (DOTA, 6.4 H2O) (1.248 g, 2.4 mmol) was dissolved in water (3 mL), lyophilized, and dissolved in DMF/TEA (4:1, v/v, 120 mL) and stirred at room temperature for 24 h. Isobutyl chloroformate (164 mg, 1.2 mmol) was added to the reaction mixture at 0 °C. After 1h, tritylthiopropylamine (4a) (267 mg, 0.8 mmol) was added and the reaction mixture stirred. After 48 h, the solvent was removed under reduced pressure and the crude solid loaded on a flash silica gel column. Elution with CHCl3/MeOH/aq NH4OH (5:3:0.3) followed by removal of solvents gave 5a as a semi-solid which was dissolved in a minimal amount of water and freeze dried. By this procedure 5a (495 mg, 0.687 mmol) was obtained as a white fluffy solid in 86% yield. 1H NMR (500 MHz, CD3OD) δ 1.60 (2, m), 2.18 (4, m), 2.31 (4, br m), 2.82 (8, br m), 3.24 (8, br m), 3.56 (2, m), 3.68 (2, m), 7.21 (3, m), 7.29 (6, m), 7.36 (6, m); 13C NMR (125 MHz) δ 29.2, 30.8, 40.4, 58.2, 60.0, 68.0, 127.9, 129.0, 130.8, 146.3, 174.8, 179.9; HRMS-FAB+ (M+H+) calculated for C38H50N5O7S 720.3431, found 720.3440.
Synthesis of {1,4,7-Tris(carboxymethyl)-10-[N-(3-trityl-thiopropyl)carbamoyl]-1,4,7,10-tetraazacyclododecanato}gadolinium (6a)
To a solution of 5a (400 mg, 0.55 mmol) in water (7 mL) was added Gd2O3 (201 mg, 0.55 mmol) while stirring. The resulting white suspension was stirred at reflux for 36 h. The reaction mixture was cooled to room temperature, filtered on a sintered funnel and the solvent evaporated under reduced pressure to give an off-white colored solid. Flash chromatography (5:3:0.5, CHCl3/MeOH/aq NH4OH), followed by lyophilization afforded 330 mg (0.68 mmol, 68%) of 6a as a white fluffy solid. HRMS-ESI (M+H+) calculated for C38H47GdN5O7S 875.2444, found 875.2447.
{1,4,7-Tris(carboxymethyl)-10-[N-(3-mercaptopropyl)carbamoyl]-1,4,7,10-tetraazacyclododecanato}gadolinium (1a)
To a solution of 6a (17 mg, 19.45 μmol) and Et3SiH (2.6 mg, 22.36 μmol) in DCM (1 mL) was added TFA (40 μL, 4% v/v) and the mixture stirred at room temperature. After 10 min, volatiles were removed in vacuo, the residue dissolved in EtOAc (5 mL), and extracted with water (5 mL). The organic layer was discarded and the aqueous layer lyophilized. Flash chromatography of the residue on reverse phase silica gel (30% MeOH/H2O), followed by lyophilization, yielded 10 mg (15.8 μmol, 81%) of the free thiol 1a {1,4,7-Tris(carboxymethyl)-10-[N-(3-mercaptopropyl) carbamoyl]-1,4,7,10- tetraazacyclododecanato}gadolinium (Gd-DO3A-NH-(CH2)3-SH) as a white fluffy solid. HRMS-ESI (M+H+) calculated for C19H33GdN5O7S 633.1344, found 633.1321.
By an analogous protocol, compound 1b, {1,4,7-tris(carboxymethyl)-10-[N-(6-mercaptohexyl) carbamoyl]-1,4,7,10-tetraazacyclododecanato}gadolinium (Gd-DO3A-NH-(CH2)6-SH) was also synthesized.
Spectral data for (3b)
mp 78–80 °C. 1H NMR (300 MHz, CDCl3) δ 1.16–1.40 (6, m), 1.58 (2, m), 2.12 (2, t, J = 6.3 Hz), 3.61 (2, t, J = 6.3 Hz), 7.16–7.28 (9, m), 7.37–7.41 (6, m), 7.68 (2, dd, J = 5.3, 2.9 Hz), 7.82 (2, dd, J = 5.4, 3 Hz); 13C NMR (75 MHz, CDCl3) δ 26.2, 28.2, 28.31, 28.3, 31.6, 37.7, 66.2, 122.9, 126.3, 127.6, 129.4, 131.9, 133.6, 144.8, 168.2; MS-FAB+ (M+H+) not observed, 243.34 [(Ph)3C-].
Spectral data for (4b)
mp 82–85 °C. 1H NMR (300 MHz, CDCl3) δ 1.17–1.32 (6, m), 1.38 (2, m), 2.14 (2, t, J = 7.5 Hz), 2.63 (2, t, J = 7.5 Hz), 3.65 (2, br s), 7.17–7.30 (9, m), 7.42 (6, m); 13C NMR (75 MHz, CDCl3) δ 26.3, 28.4, 28.6, 31.8, 32.0, 41.2, 66.3, 126.4, 127.7, 129.5, 144.9; MS-ESI (M+H+) calculated for C25H30NS 376.2, found 375.8.
Spectral data for (5b)
1H NMR (500 MHZ, CD3OD) δ 1.19 (4, m), 1.38 (4, m), 2.13 (4, m), 2.30 (4, br m), 2.82 (8, br m), 3.22 (8, br m), 3.55 (2, m), 3.67 (2, m), 7.18 (3, m), 7.25 (6, m), 7.36 (6, m); 13C NMR (125 MHz) δ 27.8, 29.8, 29.9, 30.1, 33.0, 40.9, 58.3, 59.9, 60.0, 67.7, 127.8, 128.9, 130.8, 146.5, 174.5, 180.1; HRMS-MALDI (M+H+) calculated for C41H56N5O7S 762.3898, found 762.3728.
Spectral data for (6b)
HRMS-ESI (M+H+) calculated for C41H53GdN5O7S 917.2915, found 917.2961.
Spectral data for (1b)
HRMS-ESI (M+H+) calculated for C22H39GdN5O7S 675.1814, found 675.1777.
Binding of Gd-DO3A-NH-(CH2)n-SH to Human Serum Albumin
Solutions of Gd-DO3A-NH-(CH2)3-SH and Gd-DO3A-NH-(CH2)6-SH were made in phosphate-buffered saline (PBS), PBS containing 0–2 mM homocysteine (Sigma), PBS containing 0.66 mM Human Serum Albumin (HSA, Sigma), and PBS containing 0.66 mM HSA and 0–2 mM homocysteine, to final gadolinium concentrations (GdTotal) of 0–1.0 mM. All solutions also contained 10 mM sodium azide to inhibit microbial growth, and final pH of all solutions was 7.35–7.40 at room temperature. Solutions were allowed to equilibrate overnight at 37°C prior to measurements. 500 μL aliquots of each solution containing HSA were placed in pre-warmed ultrafiltration units (Amicon UItra-4 Centrifugal Filter Units, 30000 MW cutoff, Millipore Corporation) and immediately centrifuged at 3000 g for 5 min inclusive of braking time. It was assumed that gadolinium bound to HSA would not pass through the membrane, and that the filtrate accurately represented the unbound gadolinium (Gdfree) in each sample (25). Gadolinium concentration in the filtrates was determined by Inductively Coupled Plasma Mass Spectrometry. The apparent equilibrium binding constant (K) for each complex was calculated from the Law of Mass Action, assuming a single binding site:

| [2] |
Here GdS represents free gadolinium, and GdS·HSA represents bound gadolinium. The above reaction scheme is approximate, and several concurrent stoichiometries are likely, given that the gadolinium complex can be in either monomer or dimer form, and the Cys34 of the HSA obtained from Sigma can either be in reduced form or in disulfide linkage with an endogenous thiol such as cysteine or homocysteine.
Relaxivity of Gd-DO3A-NH-(CH2)n-SH in PBS
Measurements of the longitudinal water-proton relaxivities of Gd-DO3A-NH-(CH2)3-SH and Gd-DO3A-NH-(CH2)6-SH in PBS were made at 37°C on a 4.7 T Bruker Biospec MR Instrument (Bruker Biospin, Billerica, MA). 96-well tissue culture plates (Falcon) were cut down to 6×9 wells, creating a sample tray which fit inside a 72 mm ID birdcage radio-frequency transmitter-receiver coil (Bruker). Aliquots (200 μL) of the gadolinium solutions were loaded into these wells. Spaces between the wells were filled with PBS so as to reduce air-water susceptibility artifacts in the images. The sample tray was maintained at 37°C during imaging by flowing heated air over the sample tray. Sample temperature was continuously monitored using a fluoroptic temperature probe (Luxtron Corporation, Santa Clara, CA, USA). Spin-echo MR images of cross-sections of the wells were acquired with recycle times (TR) ranging between 50–8000 ms, and an echo time (TE) of 6 ms. Signal intensity S in each well was fitted to Eq. [3] to extract the T1 at each solution condition. The factor c was between 0.98–1.0 in all regressions.
| [3] |
The T1 relaxation times of the solutions of gadolinium in PBS containing 0–2 mM homocysteine thus calculated were then fit to Eq. [4], and a longitudinal relaxivity r1 obtained for each solution condition:
| [4] |
Here 1/T10 is the relaxation rate in the absence of contrast agent, and [Gd] is the concentration of gadolinium in the solution.
Relaxivity of Gd-DO3A-NH-(CH2)n-SH in the presence of HSA
The relaxivity of gadolinium in HSA-containing solutions was approximated to have only two components – “free” (monomer, homodimer, heterodimer), and “bound” (to HSA). The T1 times of the solutions of both gadolinium complexes in PBS + HSA were inserted into Eq. [5], and fitted for the relaxivity of bound gadolinium (r1,bound):
| [5] |
where Gdfree was obtained by solving Eq. [2] for each solution condition, with K constrained to equal the binding constant calculated for the respective HSA-containing solution. In these regressions, r1,free was constrained to equal the relaxivity measured in the corresponding HSA-free solution.
Animals for MRI
All animal experiments described in this report were conducted in accordance with the policies of the Institutional Animal Care and Use Committee (IACUC) at the University of Arizona. The kinetics of MR image enhancement and washout of the n=3 and n=6 complexes were examined in mice. In addition, the influence of a bolus of homocysteine on the washout kinetics of these thiol complexes of gadolinium was also examined. Female or male ICR mice were prepared for MR imaging according to a previously published protocol (26). Briefly, mice were anesthetized by inhaled isoflurane (1.5% in O2), and cannulated at the tail-vein. The tail-vein cannula consisted of a 30G ½” stainless steel needle attached directly to one end of PE-20 tubing, with a heparinized septum and luer-lock at the other end. This assembly was constructed to have a low dead volume of ≈ 0.04 mL. A pressure-transducer balloon taped to the animal’s chest was used for continuously monitoring respiration rate. Body temperature of the animal was continuously monitored using a rectal fluoroptic temperature probe (Luxtron), and maintained by flowing heated air over the animal. The animal was gently secured into a plastic holder, and the entire assembly was loaded into a 25-mm-ID small animal imaging Litz coil (Doty Scientific, Columbia, SC). The coil was centered inside the 4.7 T magnet equipped with 20 G/cm self-shielded gradients for imaging.
In vivo Contrast-enhanced MRI
Gadolinium complexes for in vivo use were prepared as 25–50 mM solutions in PBS, filter-sterilized, and stored at 4°C prior to use. At the time of injection into the animal, the complexes could therefore have been in monomer, homodimer or mixed state. The homocysteine was prepared as a 1 M solution in ultrapure water, adjusted to neutral pH, filter-sterilized, and stored at room temperature. MRI images of axial slices through the kidneys and surrounding tissues of the mouse were acquired using a fat-suppressed radial spin-echo sequence, collecting 256 points per radial line and 256 lines per 2π radians. This sequence was chosen both for the motion compensation provided by a radial sequence, as well as the high temporal resolution made possible by sliding-window reconstruction of the radial data (see below). Pre-contrast images were acquired with TE = 9 ms, and TR = 3000 ms and 500 ms. For the dynamic portion of the experiment, radial lines were continuously collected with TE = 9 ms and TR = 100 ms. Radial lines collected adjacent in time were separated by approximately 0.78 radians so that a coarse sampling of the full 2π radians of Fourier space was carried out every 800 ms, while complete sampling was carried out every 26 seconds. After 8.5 min of pre-contrast data had been collected, gadolinium solution was manually administered via the tail-vein cannula at a dose of 0.025–0.1 mmole/Kg, chased with 0.2 mL saline. After 30 min of continuous imaging, mice were administered either 0.25 mL saline, or 1 mmole/Kg homocysteine chased with 0.2 mL saline. Total injection time was 90 s each time, both to minimize trauma to the tail vein and to minimize the impact of the relatively large fluid load delivered to the animals in a 60 min period. Imaging was performed continuously through both injections. Images were reconstructed offline by filtered back-projection using a sliding window reconstruction (256 radial lines within each window), obtaining an effective temporal resolution of 6.4 s per image. T1 maps were computed by fitting pre-contrast images to Eq. [3] with the factor c fixed at unity.
Arterial Input Function (AIF)
The AIF was approximated by a “vascular normalization function” (VNF), calculated from pixels within a hand-drawn region-of-interest (ROI) which enhanced at least 3-fold and which reached maximum enhancement within 90s of the start of the injection, analogous to the method of Rijpkema et al. (27). Signal enhancement produced by GdDTPA was converted to concentration of gadolinium using Eq. [4] and a previously measured longitudinal relaxivity of 3.1 mM−1 s−1 at 37°C and 4.7 T in PBS (26). Signal enhancement produced by Gd-DO3A-NH-(CH2)3-SH and Gd-DO3A-NH-(CH2)6-SH was converted to concentration of gadolinium using Eqs. [2] and [5], the appropriate measured values of r1,free, r1,bound and K, an assumed longitudinal relaxation time of 1.5 s for whole blood (28), and an assumed plasma concentration of albumin of 0.66 mM (24, 29).
Pharmacokinetic Modeling of DCE-MRI data
Data were analyzed on a pixel-by-pixel basis using the extended Tofts model (30):
| [6] |
Here Ck is the time-dependent volume-averaged concentration of gadolinium calculated as described above, and Cp is the AIF. In this model, ve corresponds to the extracellular extravascular volume fraction, vp corresponds to the extracellular vascular volume fraction, and KGF is the volume transfer constant. In the renal cortex, KGF corresponds to the glomerular filtration rate (GFR) per unit tissue volume. Model fitting to Eq. [6] was performed on a pixel-by-pixel basis using programs written in Interactive Data Language (IDL, Research Systems Inc., Boulder, CO).
RESULTS
Binding of Gd-DO3A-NH-(CH2)n-SH to HSA
Figure 3a depicts the variation of the bound fraction of gadolinium with total gadolinium concentration for Gd-DO3A-NH-(CH2)3-SH in PBS + 0.66 mM HSA in the presence of varying concentrations of homocysteine. These data were fitted to Eq. [2] to extract the apparent binding constant, K. Gd-DO3A-NH-(CH2)3-SH binds HSA with modest affinity, and the binding affinity decreases with increasing concentration of homocysteine (table 1). Homocysteine is known to bind HSA at Cys34 (24, 29), and the data in figure 3a indicate competitive binding of Gd-DO3A-NH-(CH2)3-SH and homocysteine to the same site. Gd-DO3A-NH-(CH2)6-SH binds HSA with greater affinity (figure 3b), and the binding constant similarly decreases with increasing concentration of homocysteine (table 1). The data in figure 3b suggest competitive binding of Gd-DO3A-NH-(CH2)6-SH and homocysteine to the Cys34 of HSA.
Figure 3.
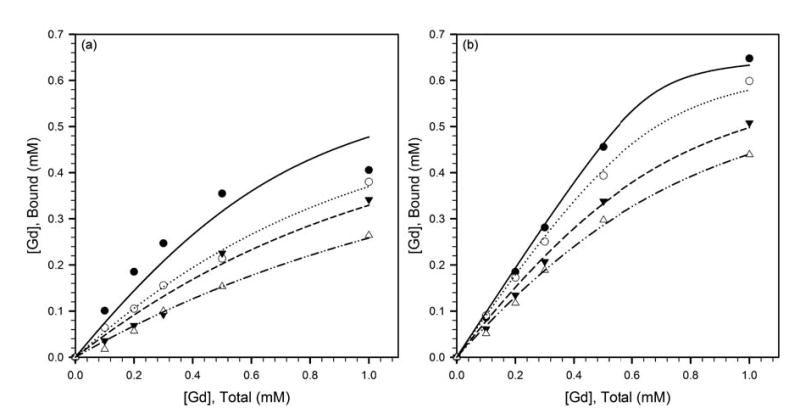
Variation of the HSA-bound fraction of gadolinium with total gadolinium concentration, for (a) Gd-DO3A-NH-(CH2)3-SH, and, (b) Gd-DO3A-NH-(CH2)6-SH, in PBS + 0.66 mM HSA in the presence of 0 mM (filled circles, solid line), 0.5 mM (open circles, dotted line), 1 mM (filled triangles, dashed line) and 2 mM (open triangles, dash-dot-dot line) homocysteine. The fitted curves represent the regressions to Eq. [2], and the apparent binding constants K in the presence of the different homocysteine concentrations are listed in table 1.
Table 1.
Mean ± SE of regression parameters of Gd-DO3A-NH-(CH2)n-SH.
| Homocysteine Concentration | |||||
|---|---|---|---|---|---|
| 0.0 mM | 0.5 mM | 1.0 mM | 2.0 mM | Mean±SD | |
| n=3: | |||||
| K (mM−1) | 5.0±1.5 | 2.0±0.12 | 1.5±0.20 | 0.87±0.05 | n.a. |
| r1,bound (mM−1 s−1) | 4.0±0.13 | 4.6±1.3 | 4.6±0.25 | 4.7±0.58 | 4.5±0.29 |
| r1,free (mM−1 s−1) | 2.7±0.05 | 3.0±0.06 | 2.9±0.05 | 2.9±0.05 | 2.9±0.11 |
| n=6: | |||||
| K (mM−1) | 64±16 | 17±2.2 | 6.1±0.54 | 3.6±0.23 | n.a. |
| r1,bound (mM−1 s−1) | 4.9±0.16 | 5.0±0.19 | 5.6±0.28 | 5.6±0.30 | 5.3±0.34 |
| r1,free (mM−1 s−1) | 2.5±0.05 | 2.1±0.05 | 2.2±0.04 | 2.3±0.05 | 2.3±0.15 |
Relaxivity of Gd-DO3A-NH-(CH2)n-SH
Figure 4a depicts the increase in longitudinal relaxation rate produced by increasing concentrations of Gd-DO3A-NH-(CH2)3-SH in PBS. These data were fit to Eq. [4] to extract the longitudinal relaxivity of Gd-DO3A-NH-(CH2)3-SH in the absence of HSA (r1,free). The relaxivities in PBS with 0.0, 0.5, 1 and 2 mM homocysteine were statistically indistinguishable, and these data were therefore combined and are shown in figure 4a as a single plot. In addition, figure 4a also depicts the variation in relaxation rate produced by Gd-DO3A-NH-(CH2)3-SH in the presence of 0.66 mM HSA and varying concentrations of homocysteine. The latter 4 pairs of data were fit to Eq. [5], with Gdfree obtained by solving Eq. [2] for each solution condition (figure 3a), with r1,free constrained to equal the value obtained in PBS (figure 4a, table 1), and with K constrained to equal the binding constant calculated for the respective HSA-containing solution (figure 3a, table 1). The calculated longitudinal relaxivities of HSA-bound Gd-DO3A-NH-(CH2)3-SH (r1,bound) were, as expected, similar at all 4 homocysteine concentrations (table 1). The relative increase in relaxivity of Gd-DO3A-NH-(CH2)3-SH upon binding to HSA (r1,bound vs. r1,free) was significant, suggesting some restriction of the reorientational freedom of bound gadolinium. However, both the absolute and relative increase in relaxivity were low compared to increases reported for other albumin-binding complexes (25, 31–33), possibly due to the high flexibility of the acyl linker.
Figure 4.
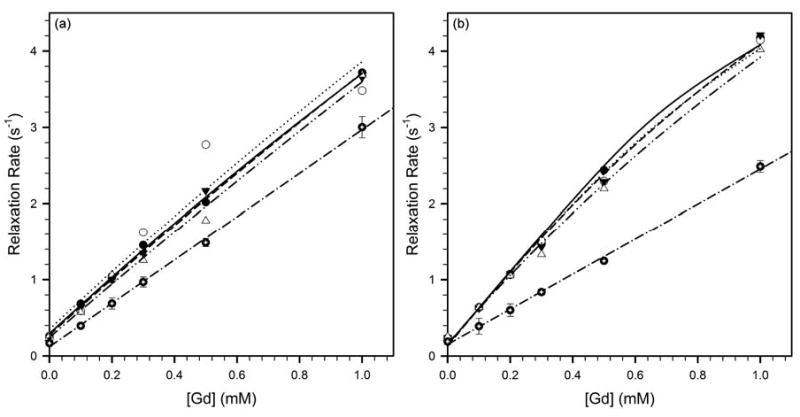
Relaxivity of (a) Gd-DO3A-NH-(CH2)3-SH, and, (b) Gd-DO3A-NH-(CH2)6-SH, at 37°C and 4.7 T in PBS (filled circles with crosshairs, dash-dot line), and PBS with 0.66 mM HSA and 0 mM (filled circles, solid line), 0.5 mM (open circles, dotted line), 1 mM (closed triangles, dashed line) or 2 mM (open triangles, dash-dot-dot line) homocysteine. The increase in longitudinal relaxation rate produced by increasing concentrations of Gd-DO3A-NH-(CH2)n-SH in PBS was fit to Eq. [4] to yield r1,free. The relaxation rates in the presence of HSA were fit to Eq. [5] to yield r1,bound. The fitted relaxivities are listed in table 1.
Figure 4b depicts the relaxation enhancement produced by Gd-DO3A-NH-(CH2)6-SH in PBS, and in PBS with 0.66 mM HSA and varying concentrations of homocysteine. The relaxivities of Gd-DO3A-NH-(CH2)6-SH in the absence (r1,free) and presence (r1,bound) of HSA were calculated by fitting to Eqs. [4] and [5], respectively, as in figure 4a. The relaxivities in PBS with 0.0, 0.5, 1 and 2 mM homocysteine were statistically indistinguishable, and these data were therefore combined into a single plot in figure 4b. The calculated longitudinal relaxivities of HSA-bound Gd-DO3A-NH-(CH2)6-SH (r1,bound) were also similar at all 4 homocysteine concentrations (table 1). As with the n=3 complex, the fractional increase in relaxivity of Gd-DO3A-NH-(CH2)6-SH upon binding to HSA (r1,bound vs. r1,free) was significant, but both the relative and absolute increase in relaxivity were low compared to increases reported for other albumin-binding complexes (25, 31–33). This suggests that while there is some degree of restriction of the reorientational freedom of gadolinium upon binding to HSA, the increase is limited by the high flexibility of the acyl linkers. In addition, changes in the kinetics of water-proton exchange at the gadolinium upon binding to HSA may also play a role.
In vivo Contrast-enhanced MRI
Figure 5 is an example T1-weighted spin-echo image of an axial slice through the kidneys and nearby tissues in a male ICR mouse. “Vascular” pixels, selected automatically as described in Methods, are depicted in white. In this example it can be seen that both the renal artery and renal vein have been selected by the algorithm. Due to the slow injections employed, the enhancement kinetics of arteries and veins were not always sufficiently different to make them clearly distinguishable.
Figure 5.
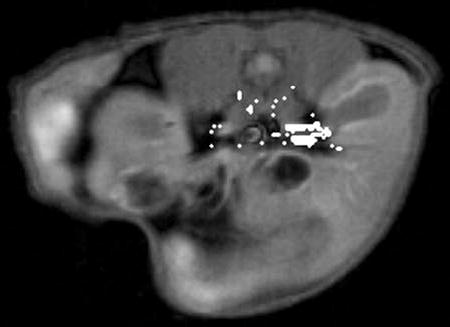
T1-weighted spin-echo MR image showing an axial cross-section of the kidneys and nearby organs in a male ICR mouse. The “vascular” pixels are indicated in white. It can be seen that our algorithm for automatically identifying vascular pixels selects both the renal artery and the renal vein in this animal.
Proteins such as albumin are excluded from renal glomerular filtration on account of their large molecular size. While free Gd-DO3A-NH-(CH2)3-SH and Gd-DO3A-NH-(CH2)6-H are small enough to readily undergo glomerular filtration, it is expected that any complex bound to plasma albumin will not be filtered. As only filtered gadolinium is expected to be present in the renal pelvis, we have compared renal signal enhancement kinetics in mice following i.v. boluses of Gd-DO3A-NH-(CH2)3-SH, Gd-DO3A-NH-(CH2)6-SH and a control complex, GdDTPA. We have also examined the influence on their washout kinetics of chase boluses of saline and homocysteine.
ROIs in the renal cortex and renal pelvis were hand-drawn, while the vascular ROI was selected automatically as in figure 5. Signal intensity in the renal cortex following boluses of GdDTPA, Gd-DO3A-NH-(CH2)3-SH and Gd-DO3A-NH-(CH2)6-SH, normalized to pre-contrast intensity, are plotted in figure 6a. The vertical gray line indicates the time of injection of the chase bolus of either saline or homocysteine. It can be seen that neither a saline chase nor a homocysteine chase produced a significant change in the slope of the washout curves of any of the complexes. These data also suggest that the washout of Gd-DO3A-NH-(CH2)3-SH and Gd-DO3A-NH-(CH2)6-SH is slower than the washout of GdDTPA. The data in figure 6a are representative of data from 3 animals imaged at each pair of contrast agent & chase solution conditions.
Figure 6.
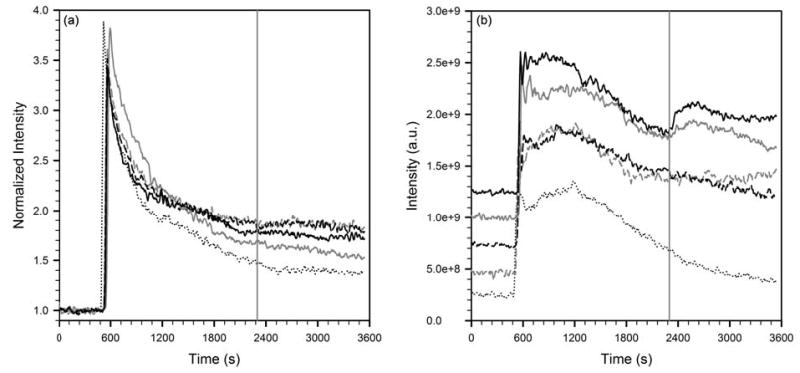
(a) Signal intensity in the renal cortex normalized to pre-contrast intensity, and, (b) absolute signal intensity in the renal pelvis, following boluses of GdDTPA, Gd-DO3A-NH-(CH2)3-SH or Gd-DO3A-NH-(CH2)6-SH. The vertical gray line indicates the time of injection of the chase bolus of either saline or homocysteine. The five curves are, GdDTPA chased with homocysteine (dotted black line), Gd-DO3A-NH-(CH2)3-SH chased with saline (dashed, gray), Gd-DO3A-NH-(CH2)6-SH chased with saline (dashed, black), Gd-DO3A-NH-(CH2)3-SH chased with homocysteine (solid, gray), and Gd-DO3A-NH-(CH2)6-SH chased with homocysteine (solid, black).
Signal enhancement in the renal pelvis of these same animals are shown in figure 6b. The absolute values of the 5 curves were offset on the vertical scale to improve readability. It can be seen that the washout kinetics of GdDTPA were unaffected by the homocysteine bolus. This was also the case when a saline chase bolus was used (not shown). By contrast, the washout curves of both Gd-DO3A-NH-(CH2)3-SH and Gd-DO3A-NH-(CH2)6-SH show an upslope immediately following the homocysteine bolus, indicating the arrival of freshly filtered gadolinium in the renal pelvis. A saline chase of either thiol complex of Gd does not produce this increase. Taken together, these data lend support to the hypothesis that both Gd-DO3A-NH-(CH2)3-SH and Gd-DO3A-NH-(CH2)6-SH spontaneously bind circulating albumin upon intravenous injection into the mice. The fraction of gadolinium which is albumin-bound at any time is excluded from glomerular filtration, thereby prolonging its retention in the blood-pool. Homocysteine in the chase bolus competes for binding to albumin, resulting in the release of free Gd-DO3A-NH-(CH2)3-SH or Gd-DO3A-NH-(CH2)6-SH, which are then promptly filtered and appear in the renal pelvis. The data in figure 6b are representative of data from 3 animals imaged at each pair of contrast agent & chase solution conditions.
The calculated concentration of gadolinium in vascular pixels in the same animals is shown in figure 7. For visual clarity, only the VNFs following GdDTPA chased with homocysteine, and Gd-DO3A-NH-(CH2)6-SH chased with saline and homocysteine, are shown. The washout of Gd-DO3A-NH-(CH2)6-SH is seen to be markedly slower than that of GdDTPA. The VNF of GdDTPA was not noticeably affected by a homocysteine chase. The VNF of Gd-DO3A-NH-(CH2)6-SH is seemingly unaffected by a bolus of saline. Interestingly, a bolus of homocysteine also does not produce a change in slope of the VNF of Gd-DO3A-NH-(CH2)6-SH. Similar results were obtained with Gd-DO3A-NH-(CH2)3-SH (not shown). This could be due to other physiological compartments in the body which buffer the plasma concentration of Gd-DO3A-NH-(CH2)6-SH, at least on the timescale of our imaging experiment. Detailed biodistribution studies are planned in order to better understand the in vivo pharmacokinetics of both Gd-DO3A-NH-(CH2)3-SH and Gd-DO3A-NH-(CH2)6-SH. The data in figure 7 are representative of data from 3 animals imaged at each pair of contrast agent & chase solution conditions.
Figure 7.
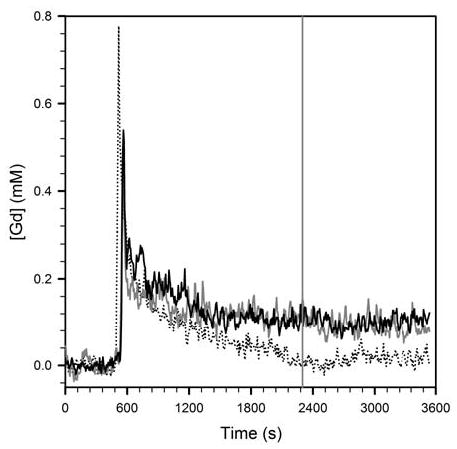
Representative plots of vascular normalization functions following injection of GdDTPA chased with homocysteine (dotted), Gd-DO3A-NH-(CH2)6-SH chased with saline (solid, gray), and Gd-DO3A-NH-(CH2)6-SH chased with homocysteine (solid, black). The vertical gray line indicates the time of injection of the chase bolus of saline or homocysteine.
Figures 6 and 7 suggest that the washout of the two thiol complexes of gadolinium is slower than that of GdDTPA. However, in order to quantify differences in the pharmacokinetics of the various gadolinium complexes, one must account for the slight differences in injection times, gadolinium dose, and pre-contrast T1 of a given tissue, from experiment to experiment. We have used the extended Tofts model (30) for this purpose. Prolonged retention of any complex in the plasma would result in the calculation of low KGF values in renal pixels. Absolute values of KGF thus calculated may be affected by imperfect measurement of the AIF, departure of water-proton exchange rates from the fast-exchange limit, as well as signal loss due to T2-shortening in regions of high gadolinium concentration. Nonetheless, as seen in figure 8, there are interesting relative differences in the KGF maps of kidneys and surrounding tissues in mice administered GdDTPA, Gd-DO3A-NH-(CH2)3-SH and Gd-DO3A-NH-(CH2)6-SH. In all animals, it can be seen that KGF in the renal cortex and medulla is significantly higher than in the renal pelvis or extra-renal tissues. The KGF for filtration of GdDTPA is ≥ 0.6 min−1 in the renal cortex (figure 8a). The KGF for filtration of Gd-DO3A-NH-(CH2)3-SH is in the range 0.3–0.5 min−1 in the renal cortex (figure 8b), while the corresponding figure for filtration of Gd-DO3A-NH-(CH2)6-SH in the renal cortex ranges from approximately 0.1–0.25 min−1 (figure 8c). The mean renal cortical KGF for Gd-DO3A-NH-(CH2)3-SH (0.4 ± 0.16 min−1, n=6) and for Gd-DO3A-NH-(CH2)6-SH (0.2 ± 0.07 min−1, n=6) were both significantly lower than for GdDTPA (1.1 ± 0.28 min−1, n=6, p<0.05). While the KGF for Gd-DO3A-NH-(CH2)3-SH was higher than for Gd-DO3A-NH-(CH2)6-SH, the difference did not achieve statistical significance (p=0.067). A higher KGF in the renal cortex corresponds to higher glomerular filtration rates. GdDTPA is readily filtered, and this is reflected in the generally high cortical KGF values. The two thiol complexes are retained in plasma to some extent due to binding with albumin, and this is reflected in correspondingly lower cortical KGF values.
Figure 8.
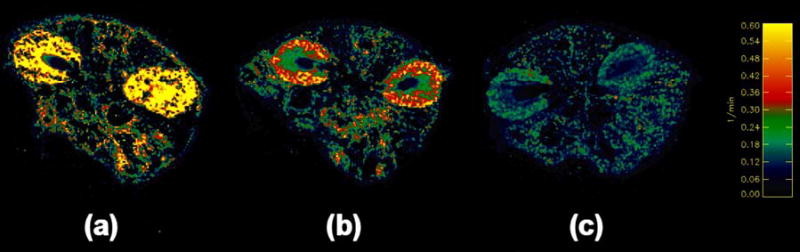
Parameter maps of KGF corresponding to axial images through the kidneys of mice, calculated using Eq. [6] for the excretion of (a) GdDTPA, (b) Gd-DO3A-NH-(CH2)3-SH, and, (c) Gd-DO3A-NH-(CH2)6-SH. The color scale runs from 0–0.6 min−1.
DISCUSSION
HSA is a major carrier & depot protein, known to covalently or non-covalently bind several small molecules. HSA interacts reversibly with a broad spectrum of therapeutic agents, and these typically bind to a number of high-affinity sites with association constants in the range 10–1000 mM−1. The protected Cys34 site in HSA binds thiols as well as other small molecules and metal ions (20). We have presented in vitro and in vivo evidence that two thiol complexes of gadolinium, Gd-DO3A-NH-(CH2)3-SH and Gd-DO3A-NH-(CH2)6-SH, bind albumin in a redox-sensitive manner. The binding of both complexes to HSA in vitro could be described as a Mass Action equilibrium. A decrease in binding constant with increasing concentration of homocysteine, a thiol also found endogenously in plasma, indicates competition for binding of Gd-DO3A-NH-(CH2)n-SH and homocysteine to the same site on HSA. The longitudinal relaxivities of both complexes increase upon binding to HSA. In vivo dynamic contrast-enhanced MRI of mice demonstrates that Gd-DO3A-NH-(CH2)3-SH and Gd-DO3A-NH-(CH2)6-SH are retained in the blood-pool longer than GdDTPA. In addition, the washout kinetics of Gd-DO3A-NH-(CH2)3-SH and Gd-DO3A-NH-(CH2)6-SH are altered by an intravenous chase bolus of homocysteine. This is further evidence that these complexes spontaneously bind plasma albumin in a reversible redox-sensitive manner.
While gadolinium bound to albumin would behave as a macromolecular contrast agent, reduction of the disulfide bond in reducing microenvironments would free the gadolinium complex and cause it to distribute as a small molecule. We are working on strategies to exploit the expected differences in the pharmacokinetics of such agents in oxidizing vs. reducing microenvironments to produce redox-sensitive contrast enhancement in MRI images. Unambiguous interpretation of image enhancement in terms of redox status would require, among other things, a minimal difference between the relaxivities of albumin-bound and unbound gadolinium. Acyl linkers were chosen to allow relatively free movement of the gadolinium, independent of the albumin, thereby reducing the increases in relaxivity from a slowing of molecular motion upon binding to the macromolecule. As the preliminary results presented here demonstrate, we have been partially successful in accomplishing this goal of eliminating relaxivity differences between albumin-bound and free gadolinium complex.
There have been several recent reports of gadolinium complexes designed to reversibly bind albumin though non-covalent linkages (25, 31–33). The stated objective of those studies was the development of blood-pool MRI contrast agents. The thiol complexes of gadolinium described in this study also exhibit potential as blood-pool MRI contrast agents. For enhancing the blood-pool, rather than for redox-sensitive MRI, the highest possible increase in relaxivity of the gadolinium upon binding to albumin is desirable. We are therefore also working on parallel strategies to increase the relaxivity enhancement of such complexes upon binding to albumin.
There is extant evidence in the literature of the presence of hypoxia-related reducing regions in tumors. Tumor vascular permeability measured by DCE-MRI of small molecule contrast agents is an emerging biomarker of tumor angiogenesis and response to anti-angiogenic drugs. These measurements could be made more precise through the use of macromolecular contrast agents (18, and references therein). The known correlation of tumor redox, hypoxia and angiogenesis to poor prognosis in cancer highlights the need for non-invasive methodologies to assess these tumor characteristics. There have been significant advances in recent years towards the development of blood-pool (25, 31–34) and redox-sensitive (35) MRI contrast agents. Thiol complexes of gadolinium offer the potential for developing both classes of MRI contrast agents via the same synthetic strategy.
Acknowledgments
This work was partly funded by grants from the National Institutes of Health (R21-DK63124, P30-CA23074, U54-CA090821) and the Arizona TRIF Optics/Imaging Initiative.
References
- 1.Raghunand N, Gatenby RA, Gillies RJ. Microenvironmental and cellular consequences of altered blood flow in tumours. Br J Radiol. 2003;76:S11–S22. doi: 10.1259/bjr/12913493. [DOI] [PubMed] [Google Scholar]
- 2.Rofstad EK. Microenvironment-induced cancer metastasis. Int J Radiat Biol. 2000;76:589–605. doi: 10.1080/095530000138259. [DOI] [PubMed] [Google Scholar]
- 3.Raghunand N, Gillies RJ. pH and drug resistance in tumors. Drug Resistance Updates. 2000;3:39–47. doi: 10.1054/drup.2000.0119. [DOI] [PubMed] [Google Scholar]
- 4.Waleh NS, Calaoagan J, Murphy BJ, Knapp AM, Sutherland RM, Laderoute KR. The redox-sensitive human antioxidant responsive element induces gene expression under low oxygen conditions. Carcinogenesis. 1998;19:1333–1337. doi: 10.1093/carcin/19.8.1333. [DOI] [PubMed] [Google Scholar]
- 5.Kuppusamy P, Li H, Ilangovan G, Cardounel AJ, Zweier JL, Yamada K, Krishna MC, Mitchell JB. Noninvasive imaging of tumor redox status and its modification by tissue glutathione levels. Cancer Res. 2002;62:307–312. [PubMed] [Google Scholar]
- 6.Gallez B, Gacic G, Goda F, Jiang J, O’Hara JA, Dunn JF, Swartz HM. Use of nitroxides for assessing perfusion, oxygenation, and viability of tissues: in vivo EPR and MRI studies. Magn Reson Med. 1996;35:97–106. doi: 10.1002/mrm.1910350113. [DOI] [PubMed] [Google Scholar]
- 7.Mikuni T, He G, Petryakov S, Fallouh MM, Deng Y, Ishihara R, Kuppusamy P, Tatsuta M, Zweier JL. In vivo detection of gastric cancer in rats by electron paramagnetic resonance imaging. Cancer Res. 2004;64:6495–6502. doi: 10.1158/0008-5472.CAN-04-0319. [DOI] [PubMed] [Google Scholar]
- 8.Prezioso JA, Shields D, Wang N, Rosenstein M. Role of gamma-glutamyltranspeptidase-mediated glutathione transport on the radiosensitivity of B16 melanoma variant cell lines. Int J Radiat Oncol Biol Phys. 1994;30:373–381. doi: 10.1016/0360-3016(94)90017-5. [DOI] [PubMed] [Google Scholar]
- 9.Hanigan MH, Gallagher BC, Townsend DM, Gabarra V. Gamma-glutamyl transpeptidase accelerates tumor growth and increases the resistance of tumors to cisplatin in vivo. Carcinogenesis. 1999;20:553–559. doi: 10.1093/carcin/20.4.553. [DOI] [PMC free article] [PubMed] [Google Scholar]
- 10.Paolicchi A, Lorenzini E, Perego P, Supino R, Zunino F, Comporti M, Pompella A. Extracellular thiol metabolism in clones of human metastatic melanoma with different gamma-glutamyl transpeptidase expression: implications for cell response to platinum-based drugs. Int J Cancer. 2002;97:740–745. doi: 10.1002/ijc.10110. [DOI] [PubMed] [Google Scholar]
- 11.Jonas CR, Ziegler TR, Gu LH, Jones DP. Extracellular thiol/disulfide redox state affects proliferation rate in a human colon carcinoma (Caco2) cell line. Free Radical Biol Med. 2002;33:1499–1506. doi: 10.1016/s0891-5849(02)01081-x. [DOI] [PubMed] [Google Scholar]
- 12.Pallis M, Bradshaw TD, Westwell AD, Grundy M, Stevens MFG, Russell N. Induction of apoptosis without redox catastrophe by thioredoxin-inhibitory compounds. Biochem Pharmacol. 2003;66:1695–1705. doi: 10.1016/s0006-2952(03)00471-4. [DOI] [PubMed] [Google Scholar]
- 13.Jonas CR, Gu LH, Nkabyo YS, Mannery YO, Avissar NE, Sax HC, Jones DP, Ziegler TR. Glutamine and KGF each regulate extracellular thiol/disulfide redox and enhance proliferation in Caco-2 cells. Am J Physiol. 2003;285:R1421–R1429. doi: 10.1152/ajpregu.00702.2002. [DOI] [PubMed] [Google Scholar]
- 14.Rehman F, Shanmugasundaram P, Schrey MP. Fenretinide stimulates redox-sensitive ceramide production in breast cancer cells: potential role in drug-induced cytotoxicity. Br J Cancer. 2004;91:1821–1828. doi: 10.1038/sj.bjc.6602212. [DOI] [PMC free article] [PubMed] [Google Scholar]
- 15.Rowinsky EK. Novel radiation sensitizers targeting tissue hypoxia. Oncology. 1999;13:61–70. [PubMed] [Google Scholar]
- 16.Brown JM, Wilson WR. Exploiting tumour hypoxia in cancer treatment. Nat Rev Cancer. 2004;4:437–447. doi: 10.1038/nrc1367. [DOI] [PubMed] [Google Scholar]
- 17.Welsh SJ, Williams RR, Birmingham A, Newman DJ, Kirkpatrick DL, Powis G. The thioredoxin redox inhibitors 1-methylpropyl 2-imidazolyl disulfide and pleurotin inhibit hypoxia-induced factor 1alpha and vascular endothelial growth factor formation. Mol Cancer Therap. 2003;2:235–243. [PubMed] [Google Scholar]
- 18.Jordan BF, Runquist M, Raghunand N, Gillies RJ, Tate WR, Powis G, Baker AF. The thioredoxin-1 inhibitor 1-methylpropyl 2-imidazolyl disulfide decreases vascular permeability in tumor xenografts monitored by dynamic contrast-enhanced magnetic resonance imaging. Clinical Cancer Research. 2005;11(2):1–9. [PubMed] [Google Scholar]
- 19.Matsumoto H, Inoue N, Takaoka H, Hata K, Shinke T, Yoshikawa R, Masai H, Watanabe S, Ozawa T, Yokoyama M. Depletion of antioxidants is associated with no-reflow phenomenon in acute myocardial infarction. Clin Cardiol. 2004;27:466–470. doi: 10.1002/clc.4960270809. [DOI] [PMC free article] [PubMed] [Google Scholar]
- 20.Kragh-Hansen U, Chuang VTG, Otagiri M. Practical aspects of the ligand-binding and enzymatic properties of human serum albumin. Biol Pharm Bull. 2002;25:695–704. doi: 10.1248/bpb.25.695. [DOI] [PubMed] [Google Scholar]
- 21.Tamemasa O, Takeda A, Goto R. Tumor detection with some 99mTc-labeled S-containing amino acids. Gann. 1984;75:395–402. [PubMed] [Google Scholar]
- 22.Takeda A, Goto R, Okada S. Mechanism of tumor transport of 99mTc-DL-Homocysteine, a possible tumor-imaging agent. Chem Pharm Bull. 1988;36:2570–2575. doi: 10.1248/cpb.36.2570. [DOI] [PubMed] [Google Scholar]
- 23.Takeda A, Hibino T, Okada S. Intensification of tumor affinity of 99mTc-DL-Homocysteine by cooperative use of SH-containing compounds. Nucl Med Biol. 1989;16:581–585. doi: 10.1016/0883-2897(89)90074-3. [DOI] [PubMed] [Google Scholar]
- 24.Sengupta S, Chen H, Togawa T, DiBello PM, Majors AK, Budy B, Ketterer ME, Jacobsen DW. Albumin thiolate anion is an intermediate in the formation of albumin-S-S-homocysteine. J Biol Chem. 2001;276:30111–30117. doi: 10.1074/jbc.M104324200. [DOI] [PubMed] [Google Scholar]
- 25.Caravan P, Greenfield MT, Li X, Sherry AD. The Gd3+ complex of a fatty acid analogue of DOTP binds to multiple albumin sites with variable water relaxivities. Inorg Chem. 2001;40:6580–6587. doi: 10.1021/ic0102900. [DOI] [PubMed] [Google Scholar]
- 26.Raghunand N, Howison CM, Zhang S, Sherry AD, Gillies RJ. Renal and systemic pH imaging by contrast-enhanced MRI. Magn Reson Med. 2003;49:249–257. doi: 10.1002/mrm.10347. [DOI] [PubMed] [Google Scholar]
- 27.Rijpkema M, Kaanders JH, Joosten FB, van der Kogel AJ, Heerschap A. Method for quantitative mapping of dynamic MRI contrast agent uptake in human tumors. J Magn Reson Imaging. 2001;14:457–463. doi: 10.1002/jmri.1207. [DOI] [PubMed] [Google Scholar]
- 28.Farahani K, Saxton RE, Yoon H-C, De Salles AAF, Black KL, Lufkin RB. MRI of thermally denatured blood: methemoglobin formation and relaxation effects. Magn Reson Imaging. 1999;17:1489–1494. doi: 10.1016/s0730-725x(99)00094-6. [DOI] [PubMed] [Google Scholar]
- 29.Togawa T, Sengupta S, Chen H, Robinson K, Nonevski I, Majors AK, Jacobsen DW. Mechanisms for the formation of protein-bound homocysteine in human plasma. Biochem Biophys Res Commun. 2000;277:668–674. doi: 10.1006/bbrc.2000.3723. [DOI] [PubMed] [Google Scholar]
- 30.Tofts PS. Modeling tracer kinetics in dynamic GdDTPA MR imaging. J Magn Reson Imaging. 1997;7:91–101. doi: 10.1002/jmri.1880070113. [DOI] [PubMed] [Google Scholar]
- 31.Caravan P, Cloutier NJ, Greenfield MT, McDermid SA, Dunham SU, Bulte JWM, Amedio JC, Looby RJ, Supkowski RM, Horrocks WD, McMurry TJ, Lauffer RB. The interaction of MS-325 with human serum albumin and its effect on proton relaxation rates. J Am Chem Soc. 2002;124:3152–3162. doi: 10.1021/ja017168k. [DOI] [PubMed] [Google Scholar]
- 32.Toth E, Connac F, Helm L, Adzamli K, Merbach AE. Direct assessment of water exchange on a Gd(III) chelate bound to a protein. J Biol Inorg Chem. 1998;3:606–613. [Google Scholar]
- 33.Martin VV, Ralston WH, Hynes MR, Keana JFW. Gadolinium(III) di- and tetrachelates designed for in vivo noncovalent complexation with plasma proteins: a novel molecular design for blood pool MRI contrast enhancing agents. Bioconjugate Chem. 1995;6:616–623. doi: 10.1021/bc00035a017. [DOI] [PubMed] [Google Scholar]
- 34.Zong Y, Wang X, Goodrich KC, Mohs AM, Parker DL, Lu ZR. Contrast-enhanced MRI with new biodegradable macromolecular Gd(III) complexes in tumor-bearing mice. Magn Reson Med. 2005;53:835–842. doi: 10.1002/mrm.20402. [DOI] [PubMed] [Google Scholar]
- 35.Aime S, Botta M, Gianolio E, Terreno E. A pO2-responsive MRI contrast agent based on the redox switch of Manganese (II/III)-porphyrin complexes. Angew Chem Intl Ed. 2000;39:747–750. doi: 10.1002/(sici)1521-3773(20000218)39:4<747::aid-anie747>3.0.co;2-2. [DOI] [PubMed] [Google Scholar]