

Abstract
Objective
To assess if children and adolescents with neurofibromatosis type 1 (NF1) have decreased bone mineral density (BMD).
Study design
Bone densitometry of the whole body, hip and lumbar spine was utilized in a case:control design (84 individuals with NF1: 293 healthy individuals without NF1). Subjects were 5–18 years of age. Individuals with NF1 were compared to controls using an analysis-of-covariance with a fixed set of covariates (age, weight, height, Tanner stage, and sex).
Results
Individuals with NF1 had decreased areal bone mineral density (aBMD) of the hip (p<0.0001), femoral neck (p<0.0001), lumbar spine (p=0.0025), and whole body subtotal (p<0.0001). When individuals with NF1 were separated into groups with and without a skeletal abnormality, the NF1 individuals without a skeletal abnormality still had statistically significant decreases compared to controls (p<0.0001 for whole body subtotal aBMD) albeit less pronounced than those with osseous abnormalities.
Conclusions
These data suggest that individuals with NF1 have a unique generalized skeletal dysplasia, predisposing them to localized osseous defects. Dual energy x-ray absorptiometry may prove useful to identify individuals with NF1 who are at risk for clinical osseous complications, and monitoring therapeutic trials.
Keywords: densitometry, bone mineral content, skeletal dysplasia, osteopenia
Neurofibromatosis type 1 (NF1) is a fully penetrant and relatively common autosomal dominant disorder (1/3500 individuals), and exhibits variable expression and pleiotropy. The phenotype of NF1 is well described, but the osseous manifestations are rarely emphasized in the clinical and genetic discussions of NF1. The clinical features of NF1 are classically thought of as neural crest in origin, but mesodermally-derived abnormalities are associated with NF1. In fact, one of the seven diagnostic criteria is a distinctive osseous defect.,1,2 and one NF Clinic reported that 38% of NF1 patients had an osseous abnormality.3 This suggests that in addition to its neural crest defects, NF1 is also a disorder of bone.
The skeletal abnormalities most commonly associated with NF1 include long bone dysplasia, sphenoid wing dysplasia, and scoliosis (both the short-angle dystrophic form and the more typical idiopathic non-dystrophic form).4–7 Long bone dysplasia, primarily of the tibia, often leads to fracture and non-union sometimes requiring amputation.4,5 Dystrophic scoliosis in NF1 is particularly difficult to treat and necessitates aggressive surgical stabilization. Other general osseous abnormalities include bone cysts, spinal canal widening, vertebral body narrowing, rib-penciling, and vertebral scalloping. The role the mutant NF1 gene plays in the development of these various osseous abnormalities is not known. NF1 is comprised of 60 exons spanning 350kb of DNA that encodes the protein called neurofibromin, a Ras-GAP protein8 that down-regulates Ras signaling by activating its intrinsic hydrolysis of Ras-GTP to Ras-GDP. As a tumor suppressor, inactivating NF1 mutations lead to aberrant Ras activity. This helps to explain the development of neurofibromas and malignancies in NF1, but currently does not fully explain the role of neurofibromin on the development of osseous abnormalities associated with NF1.
A generalized intrinsic abnormality could predispose some patients to develop a localized defect of the long bones (causing unilateral bowing, fracture and frank pseudarthrosis), the vertebrae (causing scoliosis), and the sphenoid wing. Elucidation of the bone mineral density in NF1 pediatric population will provide insight into the etiology of localized abnormalities and aid in development of potential therapeutic options. This report uses dual energy x-ray absorptiometry (DXA) to assess bone health in NF1 children and adolescents.
Methods
NF1 individuals were recruited from an NF1 clinic at the University of Utah; all fulfilled the diagnostic criteria.1,2 A total of 84 individuals with NF1 (ages 5–18) were included in the study. Those with other chronic illnesses known to influence bone health, e.g. illnesses requiring systemic steroids, anorexia, pregnancy, lactation, oral contraception or any hormone replacement were excluded. A cohort of 293 healthy children without NF1 (ages 3–21), collected by the Center for Pediatric Nutrition Research at the University of Utah were utilized as controls. Children <3 years were generally not included due to difficulty in cooperating with imaging procedures.
Medical histories were obtained and physical examinations were performed on all NF1 individuals. NF1 children were then classified into 2 groups: NF1 children with a skeletal abnormality and NF1 children without a skeletal abnormality. A skeletal abnormality in context with this study was defined as long bone dysplasia, scoliosis, and/or sphenoid wing dysplasia.
Pubertal maturation was determined by self-report, using a questionnaire.9 Calcium intake estimates10 and past-year physical activity11 were also obtained by questionnaire. The reported physical activity was used to estimate metabolic hours of weight-bearing physical activity, assigned a number representing metabolic cost (MET), for the previous year. Hours per week for each activity were multiplied by their estimated MET value to give MET hours per week.11 Height without shoes was measured for each participant using Seca height-Rite Stadiometer (Model 225, Culver City, California) and weight was measured by digital scale (Scan-Tronix Stand on Scale, Model 5002, Carol Stream, Illinois).
All study subjects had images obtained using a DXA instrument (Hologic QDR-4500A, Waltham, MA) to measure bone area (BA), bone mineral content (BMC), and areal bone mineral density (aBMD) under well-established standard protocols. NF1 may preferentially affect certain skeletal sites. Therefore, measurements were obtained at different sites: the hip, femoral neck, lumbar spine, and total body. Whole body scans were obtained with the patient supine with the toes adducted (≈45°) and fixed with tape with arms placed at one’s sides with palms down. The hip measurements were obtained with the non-dominant leg rotated inwards and the foot securely fastened in the hip-positioning fixture. The lumbar spine was measured with the back flat and feet elevated with a positioning cushion under the lower legs. Femoral neck and lumbar spine BMC and bone area values were used to determine bone mineral apparent density (BMAD, gm/cm3) as described by Katzman et al.12 The coefficient of variation for daily manufacturer-supplied phantom measurements was 0.1% and for reposition in adult volunteers using DXA was <1.0%. Imaging was performed by a densitometry technologist certified by the International Society for Clinical Densitometry.
Data from individuals with NF1 as a whole cohort were compared to data from local controls without NF1. Comparison of bone variables between groups was adjusted for sex, age, Tanner stage, weight and height using analysis-of-covariance with a fixed set of covariates. The comparisons are not adjusted for multiple tests, as the main interest was comparing the outcome measures separately. The NF1 group was subdivided into NF1 individuals with and without a skeletal abnormality. An analysis of covariance was used to compare equality of adjusted means between the three groups (controls, NF1 individuals without a skeletal abnormality, and NF1 individuals with a skeletal abnormality). Pair-wise comparisons between controls and NF1 individuals with and without a skeletal abnormality, and between the two NF1 groups (NF1 individuals with and without a skeletal abnormality) were performed. This study was approved by the Institutional Review Board at the University of Utah. Informed consent was obtained on all participants.
Results
Anthropometric data for the NF1 cohort are as follows: 45 boys and 39 girls; mean age 10.3 years, standard deviation (SD) ±4.1; mean height 131.4 cm, SD ±23.1; mean weight 35.2 kg, SD ±19.1; median Tanner stage 2, range 1–5. Anthropometric data for the controls (healthy individuals without NF1) are as follows: 132 boys and 161 girls; mean age 11.8 years, SD ±4.3; mean height 145.8 cm, SD ±22.5; mean weight 43.1 kg, SD ±19.7; median Tanner stage 2, range 1–5. Within the NF1 cohort 24/84 had a skeletal abnormality (18 with scoliosis, 3 with long bone dysplasia, 1 with sphenoid wing dysplasia, and 2 with scoliosis and long bone dysplasia). Anthropometric data for the 2 NF1 groups are as follows: NF1 individuals without a skeletal abnormality (35 boys and 25 girls; mean age 9.4 years, SD ±3.6; mean height 127.2 cm, SD ±23.5; mean weight 32.7 kg, SD ±19.2; median Tanner stage 1, range 1–5), and NF1 individuals with a skeletal abnormality (10 boys and 14 girls; mean age 12.4 years, SD ±4.3; mean height 141.5 cm, SD ±18.6; mean weight 41.4 kg, SD ±17.6; median Tanner stage 3, range 1–5).
Calcium intake estimations were >700 mg/d in all individuals with NF1 who completed the calcium intake estimation questionnaires (n=30).10 Past-year physical activity estimation was only available in 24 NF1 individuals. Data for individuals who completed the questionnaire11 were as follows: mean for individuals with NF1 = 32.7 MET/week (range 3.9–117.8; median 27.4; n=24); mean for individuals without NF1 = 38.1 MET/week (range 0.6–316.8; median 25.6; n=241).
Statistically significant decreases were observed in BMC (gm) and aBMD (gm/cm2) of the lumbar spine, hip, femoral neck, and whole body subtotal, and BMAD (gm/cm3) of the lumbar spine and femoral neck between the NF1 cohort and controls using analysis of covariance adjusting for age, weight, height, Tanner stage and sex. Results of these analyses are summarized in Table I.
Table I.
DXA Statistical Analysis (NF1 versus Controls)*
| Variable | NF1 Individuals | Healthy Controls | p-value | ||||
|---|---|---|---|---|---|---|---|
| Adjusted Mean | Adjusted SE | N | Adjusted Mean | Adjusted SE | N | ||
|
Hip
Bone Area (cm2) BMC (gm) aBMD (gm/cm2) |
23.11 17.51 0.697 |
0.44 0.54 0.011 |
81 81 81 |
25.77 21.48 0.779 |
0.29 0.36 0.007 |
290 290 290 |
p<0.0001 p<0.0001 p<0.0001 |
|
Femoral Neck
Bone Area (cm2) BMC (gm) aBMD (gm/cm2) BMAD (gm/cm3) |
4.21 2.81 0.646 0.154 |
0.04 0.06 0.010 0.003 |
81 81 81 81 |
4.24 3.16 0.720 0.17 |
0.03 0.04 0.007 0.002 |
290 290 290 290 |
p=0.6305 p<0.0001 p<0.0001 p<0.0001 |
|
Lumbar Spine
Bone Area (cm2) BMC (gm) aBMD (gm/cm2) BMAD (gm/cm3) |
43.8 31.5 0.674 0.101 |
0.54 0.85 0.011 0.0015 |
78 78 78 78 |
44.9 34.3 0.711 0.105 |
0.35 0.56 0.007 0.001 |
292 292 292 292 |
p=0.0629 p<0.0034 p<0.0025 p=0.0161 |
|
Whole Body Subtotal
Bone Area (cm2) BMC (gm) aBMD (gm/cm2) |
1127 909 0.731 |
16 21 0.007 |
75 75 75 |
1201 1021 0.777 |
10 13 0.004 |
292 292 292 |
p<0.0001 p<0.0001 p<0.0001 |
Comparison of the bone variables from DXA imaging between NF1 individuals and controls was adjusted for gender, Tanner stage, weight, height, and age using analysis-of-covariance with a fixed set of covariates. P-values are not adjusted for multiple comparisons. (DXA=dual energy x-ray absorptiometry; aBMD= areal bone mineral density; BMAD= bone mineral apparent density; BMC=bone mineral content; SE=standard error).
When the individuals with NF1 were separated into groups with and without a skeletal abnormality, the NF1 individuals without a skeletal abnormality had statistically significant decreases compared to controls (Table II). Decreases in most DXA variables for the NF1 individuals with a skeletal abnormality compared to NF1 individuals without a skeletal abnormality did not reach statistical significance (Table II). Therefore, in order to assess the downward trend between the three groups a trend ANOVA analysis was performed which showed a downward trend in BMC (gm) and aBMD (gm/cm2) of the lumbar spine (p=0.008 and p=0.025 respectively), hip (p<0.0001), femoral neck (p<0.0001), and whole body subtotal (p=0.0002 and p<0.0001 respectively) between the three groups. The Figure shows an example of this downward trend in one variable (femoral neck BMC).
Table II.
DXA Statistical Analysis (NF1 with and without osseous dysplasia, versus Controls)*
| Variable | adjusted mean | equality of adjusted means (p-value) | overall p-value | |||
|---|---|---|---|---|---|---|
| Controls | NF1 (no osseous dysplasia) | NF1 (osseous dysplasia) | Controls vs. NF1 (no osseous dysplasia) | NF1 (no osseous dysplasia vs. osseous dysplasia) | ||
|
Hip
Bone Area (cm2) BMC (gm) aBMD (gm/cm2) |
25.77 21.48 0.779 |
23.66 18.41 0.711 |
21.91 15.55 0.668 |
p<0.0003 p<0.0001 p<0.0001 |
p<0.0001 p=0.0099 p=0.0513 |
p<0.0001 p<0.0001 p<0.0001 |
|
Femoral Neck
Bone Area (cm2) BMC (gm) aBMD (gm/cm2) BMAD (gm/cm3) |
4.24 3.16 0.720 0.170 |
4.24 2.88 0.658 0.155 |
4.17 2.66 0.621 0.15 |
p=0.9940 p=0.0004 p<0.0001 p=0.0002 |
p=0.3971 p=0.0647 p=0.0823 p=0.3452 |
p=0.6222 p<0.0001 p<0.0001 p<0.0001 |
|
Lumbar Spine
Bone Area (cm2) BMC (gm) aBMD (gm/cm2) BMAD (gm/cm3) |
44.9 34.3 0.711 0.105 |
44 32.1 0.677 0.101 |
43 30 0.665 0.1 |
p=0.2198 p=0.0381 p=0.0152 p=0.0456 |
p=0.3657 p=0.2598 p=0.0253 p=0.7775 |
p=0.1180 p=0.0074 p=0.0092 p=0.0533 |
|
Whole Body Subtotal
Bone Area (cm2) BMC (gm) aBMD (gm/cm2) |
1201 1021 0.777 |
1133 935 0.735 |
1107 865 0.720 |
p=0.0011 p=0.0003 p<0.0001 |
p=0.4661 p=0.1946 p=0.3171 |
p=0.0003 p<0.0001 p<0.0001 |
Comparison of the bone variables from DXA imaging between groups was adjusted for gender, Tanner stage, weight, height, and age using analysis-of-covariance with a fixed set of covariates. Tests for equality of adjusted means between Controls and NF1 individuals without an osseous dysplasia, and between NF1 individuals with and without an osseous dysplasia are displayed in their respective columns. The column labeled “overall p-value” is the test for overall equality of adjusted means in the three groups from analysis of variance. P-values are not adjusted for multiple comparisons. (DXA=dual energy x-ray absorptiometry; aBMD= areal bone mineral density; BMAD= bone mineral apparent density; BMC=bone mineral content; SE=standard error).
Figure. Graph of Trend in Bone Mineral Content of the Femoral Neck.
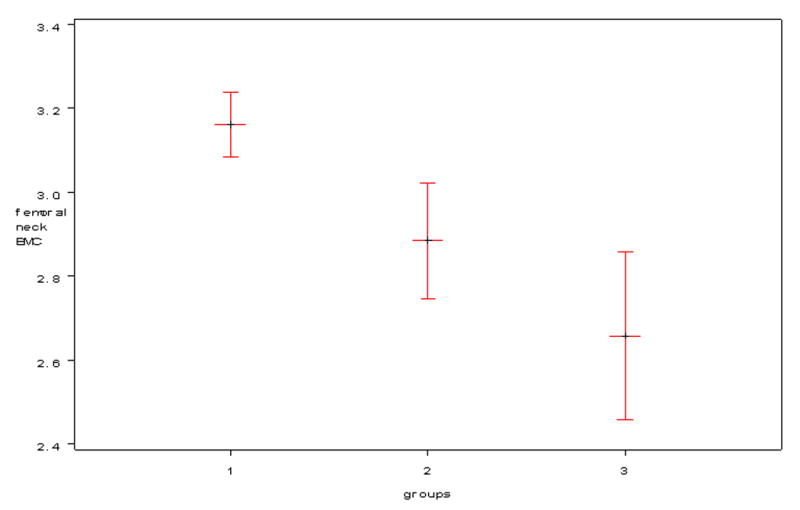
Graph illustrates a downward trend in bone mineral content (BMC) of the femoral neck (gm) in 3 groups. Group #1 = Controls (healthy individuals without NF1); Group #2 = NF1 individuals without a clinical skeletal abnormality; Group #3 = NF1 individuals with a clinical skeletal abnormality.
Discussion
Decreased bone mass accrual in the pediatric period can lead to osteoporosis and fracture in adulthood in the general population as peak bone density is generally reached by late adolescence.13 The data presented here suggest that the NF1 patient population is at an increased risk for the development of clinical complications related to osteoporosis. Previous studies have documented decreases in bone mineral density in NF1 adults, but there are no detailed studies in children with NF1. Illes et al. evaluated 12 NF1 patients, all with scoliosis, and showed a decrease in bone mineral density of the lumbar spine compared to the normal population.14 Another study of 26 adults with NF1 noted that all postmenopausal women with NF1 in the cohort had either osteoporosis or osteopenia.15 Quantitative ultrasonometry of the calcaneal bone by Lammert et al. documented decreased bone mineral density in this body region in a cohort of NF1 adults.16 Although these studies point to decreased bone mineral density in various skeletal sites in NF1, they focus on the adult NF1 population. Our data indicate decreases in bone mineral density during childhood, which could predispose adults with NF1 to the development of osteoporosis and fracture.
To our knowledge, no studies have evaluated fracture frequency in adults with NF1. Since osteoporosis is a common problem particularly in older women and NF1 individuals are known to have osseous abnormalities, clinical complications of osteoporosis in NF1 adults may have been overlooked. It is possible, however, that the observed decreases in bone mineral density in our cohort of children with NF1 and other cohorts of adults with NF1 may not have long term clinical implications. Investigation into osteoporosis related fractures in the NF1 population will be important to assess the need for intervention strategies in individuals with NF1.
If clinical consequences of decreased bone mineral density in the NF1 population are determined, then our data showing decreased bone mineral density in the pediatric period in NF1 individuals provides a target period for intervention as accrual of bone mass during childhood contributes to determining adult bone mass. Load-bearing activities and muscle strengthening have been shown to impact bone strength and cortical area.17,18 Past-year leisure activity estimation was available on only a small subset of the individuals with NF1 (N=24) making it difficult to assess the significance of the difference in means observed. Future studies will be needed to confirm if consistent decreases in metabolic hours of weight-bearing physical activity in individuals with NF1 are seen, and if they contribute to decreased BMD. This provides, however, an area to target intervention. Initiation of early exercise regimens focusing on load bearing activities should improve bone acquisition and help to ameliorate potential problems in adulthood.
In addition to the potential generalized complications of osteoporosis, we hypothesize that osteopenia through NF1 haploinsufficiency contributes to the progression of localized bone dysplasias in individuals with NF1. Bone mineral density is known to be significantly influenced by genetic factors, and differences in bone mineral density have been associated with polymorphisms of several genes including the vitamin D receptor, LRP5, APOE, COL1A1, COL1A2, MTHFR, RUNX2/CBFA1 and ESR1 genes.19–30 One study showed that TGFβ, a gene related to tissue remodeling, and CBFA1, a gene related to bone development, were down-regulated in NF1 blood samples.31 Although inactivation of NF1 contributes to the decrease in bone mineral density, other genes likely act as modifiers and, in concert with somatic genetic alterations, contribute to the development of localized defects. Our data show that NF1 individuals with localized skeletal abnormalities have decreased bone mineral density compared to individuals without a localized skeletal abnormality defined in this study as scoliosis, long bone dysplasia, and/or sphenoid wing dysplasia. Without prospective data prior to the development of the skeletal dysplasia it is difficult to determine if the subset of NF1 individuals with localized skeletal abnormalities developed further decreases in BMD as a consequence of the localized defect, or if significant decreases in BMD contribute to the development of localized skeletal defects. If low BMD correlates with an increased risk of a localized skeletal defect, this would allow clinicians to identify those individuals at risk allowing for early intervention strategies. It is however, likely that scoliosis and long bone dysplasia will contribute to further decreases in BMD due to decreased activity and mobility.
Even though an increased intrafamilial correlation of scoliosis versus interfamilial variability has been reported in NF1,32 there is still discordance in monozygotic twins. Therefore, it should be recognized that, in addition to modification of the generalized NF1 bone phenotype, stochastic changes or somatic mutations of important contributing genes likely lead to the localized defects.
The effect of neurofibromin on bone formation and remodeling is not well understood. Lammert et al. reported decreased 25-hydroxyvitamin D concentrations in a cohort of NF1 individuals although the etiology is unknown.33 Future studies to examine other markers of bone resorption and formation will potentially help in identifying whether or not bone resorption is increased, bone formation is decreased, or both in individuals with NF1. This will also give inferences to the role of neurofibromin on osteoblast and osteoclast function. We speculate that both osteoclast and osteoblast activity is dysregulated in individuals with NF1, and future studies investigating the biological function of NF1 haploinsufficient osteoclasts and osteoblasts and the signaling pathways that affect their activity may be insightful.
We also expect that prospective studies will help elucidate the contribution of bone mineral density to the development of localized skeletal defects in NF1. Furthermore, as the field of genetics expands, we will be able to investigate the role of modifier genes, in the background of NF1 haploinsuffiency, in the bone remodeling process in hopes of identifying targeted treatment protocols for the difficult to manage localized skeletal dysplasias of NF1.
Acknowledgments
We thank Stacy Maxwell, Diane Hartford, Amy Watkins, Bronte Clifford, and Ann Rutherford for their support as research coordinators. We thank Dr. Elizabeth Schorry and Dr. Charles Hoff for their discussion and insight. We thank the participants and their families.
Abbreviations
- aBMD
areal bone mineral density
- BA
bone area
- BMAD
bone mineral apparent density
- BMD
bone mineral density
- BMC
bone mineral content
- DXA
dual energy x-ray absorptiometry
- MET
metabolic cost
- NF1
neurofibromatosis type 1
- SD
standard deviation
Funding Sources: A Public Health Services research grant #M01-RR00064 from the National Center for Research Resources, research grant #1 K23 NS052500 from the National Institute of Neurological Disorders and Stroke, the Children’s Health Research Center at the University of Utah, the Clinical Genetics Research Program at the University of Utah, and the Primary Children’s Medical Center Research Foundation.
Publisher's Disclaimer: This is a PDF file of an unedited manuscript that has been accepted for publication. As a service to our customers we are providing this early version of the manuscript. The manuscript will undergo copyediting, typesetting, and review of the resulting proof before it is published in its final citable form. Please note that during the production process errors may be discovered which could affect the content, and all legal disclaimers that apply to the journal pertain.
References
- 1.Stumpf DA, Alksne JF, Annegers JF, Brown SS, Conneally PM, Housman D, et al. Neurofibromatosis conference statement national institutes of health consensus development conference. Arch Neurol. 1988;45:575–8. [PubMed] [Google Scholar]
- 2.Gutmann DH, Aylsworth A, Carey JC, Korf B, Marks J, Pyeritz RE, et al. The diagnostic evaluation and multidisciplinary management of neurofibromatosis 1 and neurofibromatosis 2. JAMA. 1997;278:51–57. [PubMed] [Google Scholar]
- 3.Crawford AH, Schorry EK. Neurofibromatosis in children; the role of the orthopaedist. J Am Academy of Orthopaedic Surgeons. 1999;7:217–30. doi: 10.5435/00124635-199907000-00002. [DOI] [PubMed] [Google Scholar]
- 4.Friedman JM, Birch PH. Type 1 Neurofibromatosis: A descriptive analysis of the disorder in 1728 patients. Am J Med Genet. 1997;70:138–43. doi: 10.1002/(sici)1096-8628(19970516)70:2<138::aid-ajmg7>3.0.co;2-u. [DOI] [PubMed] [Google Scholar]
- 5.Stevenson DA, Birch PH, Friedman JM, Viskochil DH, Balestrazzi P, Buske A, et al. Descriptive analysis of tibial pseudarthrosis in patients with neurofibromatosis 1. Am J Med Genet. 1999;84:413–9. doi: 10.1002/(sici)1096-8628(19990611)84:5<413::aid-ajmg5>3.0.co;2-1. [DOI] [PubMed] [Google Scholar]
- 6.Vitale MG, Guha A, Skaggs DL. Orthopaedic manifestations of neurofibromatosis in children: an update. Clin Orthop. 2002;401:107–18. doi: 10.1097/00003086-200208000-00013. [DOI] [PubMed] [Google Scholar]
- 7.Young H, Hyman S, North K. Neurofibromatosis 1: Clinical review and exceptions to the rules. J Child Neurol. 2002;17:613–21. doi: 10.1177/088307380201700812. [DOI] [PubMed] [Google Scholar]
- 8.Viskochil D. Genetics of neurofibromatosis 1 and the NF1 gene. J Child Neurol. 2002;17:562–70. doi: 10.1177/088307380201700804. [DOI] [PubMed] [Google Scholar]
- 9.Taylor SJWP, Hindmarsh PC, Lampe F, Odoki K, Cook DG. Performance of a new pubertal self-assessment questionnaire; a preliminary study. Paediatr Perinat Epidemiol. 2001;15:88–94. doi: 10.1046/j.1365-3016.2001.00317.x. [DOI] [PubMed] [Google Scholar]
- 10.Rockett HR, Breitenbach M, Frazier AL, Witschi J, Wolf AM, Field AM, et al. Validation of a youth/adolescent food frequency questionnaire. Prev Med. 1997;26:808–16. doi: 10.1006/pmed.1997.0200. [DOI] [PubMed] [Google Scholar]
- 11.Ainsworth BE, Haskell WL, Leon AS, Jacobs DR, Montoye HJ, Sallis JF, et al. Compendium of physical activities: classification of energy cost of human physical activities. Med Sci Sports Exerc. 1993;25:71–80. doi: 10.1249/00005768-199301000-00011. [DOI] [PubMed] [Google Scholar]
- 12.Katzman DBL, Carter D, Marcus R. Clinical and anthropometric correlates of bone mineral acquisition in healthy adolescent girls. J Clin Endocrinol Metab. 1991;73:1332–9. doi: 10.1210/jcem-73-6-1332. [DOI] [PubMed] [Google Scholar]
- 13.Ellis KJ, Shypailo RJ, Hardin DS, Perez MD, Motil KJ, Wong WW, et al. Z score prediction model for assessment of bone mineral content in pediatric diseases. J Bone Miner Res. 2001;9:1658–64. doi: 10.1359/jbmr.2001.16.9.1658. [DOI] [PubMed] [Google Scholar]
- 14.Illes T, Halmai V, de Jonge T, Dubousset J. Decreased bone mineral density in neurofibromatosis-1 patients with spinal deformities. Osteoporos Int. 2001;12:823–7. doi: 10.1007/s001980170032. [DOI] [PubMed] [Google Scholar]
- 15.Kuorilehto T, Pöyhönen M, Bloigu R, Heikkinen J, Väänänen K, Peltonen J. Decreased bone mineral density and content in neurofibromatosis type 1: lowest local values are located in the load-carrying parts of the body. Osteoporos Int. 2004;16:928–36. doi: 10.1007/s00198-004-1801-4. [DOI] [PubMed] [Google Scholar]
- 16.Lammert M, Kappler M, Mautner VF, Lammert K, Störkel S, Friedman JM, et al. Decreased bone mineral density in patients with neurofibromatosis 1. Osteoporos Int. 2005;16:1161–6. doi: 10.1007/s00198-005-1940-2. [DOI] [PubMed] [Google Scholar]
- 17.Klein CS, Allman BL, Marsh GD, Rice CL. Muscle size, strength, and bone geometry in the upper limbs of young and old men. J Gerontol A Biol Sci Med Sci. 2002;57:M455–459. doi: 10.1093/gerona/57.7.m455. [DOI] [PubMed] [Google Scholar]
- 18.Janz KF, Burns TL, Levy SM, Torner JC, Willing MC, Beck TJ, et al. Everyday activity predicts bone geometry in children: the iowa bone development study. Med Sci Sports Exerc. 2004;36:1124–1131. doi: 10.1249/01.mss.0000132275.65378.9d. [DOI] [PubMed] [Google Scholar]
- 19.Grant SF, Reid DM, Blake G, Herd R, Fogelman I, Ralston SH. Reduced bone density and osteoporosis associated with a polymorphic Sp1 binding site in the collagen type I alpha 1 gene. Nat Genet. 1996;14:203–205. doi: 10.1038/ng1096-203. [DOI] [PubMed] [Google Scholar]
- 20.Sainz J, Van Tornout JM, Loro ML, Sayre J, Roe TF, Gilsanz V. Vitamin D-receptor gene polymorphisms and bone density in prepubertal American girls of Mexican descent. N Engl J Med. 1997;337:77–82. doi: 10.1056/NEJM199707103370202. [DOI] [PubMed] [Google Scholar]
- 21.Sainz J, Van Tornout JM, Sayre J, Kaufman F, Gilsanz V. Association of collagen type 1 alpha1 gene polymorphism with bone density in early childhood. J Clin Endocrinol Metab. 1999;84:853–855. doi: 10.1210/jcem.84.3.5575. [DOI] [PubMed] [Google Scholar]
- 22.Vaughan T, Pasco JA, Kotowicz MA, Nicholson GC, Morrison NA. Alleles of RUNX2/CBFA1 gene are associated with differences in bone mineral density and risk of fracture. J Bone Miner Res. 2002;17:1527–1534. doi: 10.1359/jbmr.2002.17.8.1527. [DOI] [PubMed] [Google Scholar]
- 23.Willing MC, Torner JC, Burns TL, Janz KF, Marshall T, Gilmore J, et al. Gene polymorphisms, bone mineral density and bone mineral content in young children: The Iowa Bone Development Study. Osteoporos Int. 2003;14:650–658. doi: 10.1007/s00198-003-1416-1. [DOI] [PubMed] [Google Scholar]
- 24.Boot AM, van der Sluis IM, de Muinck Keizer-Schrama SM, van Meurs JB, Krenning EP, Pols HA, et al. Estrogen receptor alpha gene polymorphisms and bone mineral density in healthy children and young adults. Calcif Tissue Int. 2004;74:495–500. doi: 10.1007/s00223-003-0168-4. [DOI] [PubMed] [Google Scholar]
- 25.Ferrari SL, Deutsch S, Choudhury U, Chevalley T, Bonjour JP, Dermitzakis ET, et al. Polymorphisms in the low-density lipoprotein receptor-related protein 5 (LRP5) gene are associated with variation in vertebral bone mass, vertebral bone size, and stature in whites. Am J Hum Genet. 2004;74:866–875. doi: 10.1086/420771. [DOI] [PMC free article] [PubMed] [Google Scholar]
- 26.Ioannidis JP, Ralston SH, Bennett ST, Brandi ML, Gringerg D, Karassa FB, et al. Differential genetic effects of ESR1 gene polymorphisms on osteoporosis outcomes. JAMA. 2004;292:2105–2114. doi: 10.1001/jama.292.17.2105. [DOI] [PubMed] [Google Scholar]
- 27.Liu PY, Lu Y, Long JR, Xu FH, Shen H, Recker RR, et al. Common variants at the PCOL2 and Sp1 binding sites of the COL1A1 gene and their interactive effect influence bone mineral density in Caucasians. J Med Genet. 2004;41:752–757. doi: 10.1136/jmg.2004.019851. [DOI] [PMC free article] [PubMed] [Google Scholar]
- 28.Long JR, Liu PY, Liu YJ, Lu Y, Shen H, Zhao LJ, et al. APOE haplotypes influence bone mineral density in Caucasian males but not females. Calcif Tissue Int. 2004;75:299–304. doi: 10.1007/s00223-004-0034-z. [DOI] [PubMed] [Google Scholar]
- 29.Tinkle BT, Wenstrup RJ. A genetic approach to fracture epidemiology in childhood. Am J Med Genet C Semin Am Genet. 2005;139:38–54. doi: 10.1002/ajmg.c.30073. [DOI] [PubMed] [Google Scholar]
- 30.Macdonald HM, McGuigan FE, Fraser WD, New SA, Ralston SH, Reid DM. Methylenetetrahydrofolate reductase polymorphism interacts with riboflavin intake to influence bone mineral density. Bone. 2004;35:957–964. doi: 10.1016/j.bone.2004.05.018. [DOI] [PubMed] [Google Scholar]
- 31.Tang Y, Lu A, Ran R, Aronow BJ, Schorry EK, Hopkin RJ, et al. Human blood genomics: distinct profiles for gender, age and neurofibromatosis type 1. Brain Res Mol Brain Res. 2004;132:155–167. doi: 10.1016/j.molbrainres.2003.10.014. [DOI] [PubMed] [Google Scholar]
- 32.Easton DF, Ponder MA, Huson SM, Ponder BAJ. An analysis of variation in expression of neurofibromatosis (NF) type I (NFI): Evidence for modifying genes. Am J Hum Genet. 1993;53:305–313. [PMC free article] [PubMed] [Google Scholar]
- 33.Lammert M, Friedman JM, Roth HJ, Friedrich RE, Kluwe L, Atkins D, et al. Vitamin D deficiency associated with number of neurofibromas in neurofibromatosis 1. J Med Genet. 2006 doi: 10.1136/jmg.2006.041095. [Epub ahead of print]. [DOI] [PMC free article] [PubMed] [Google Scholar]