

Abstract
PURPOSE
To compare relative reduction of retinal ganglion cell (RGC) function and retinal nerve fiber layer (RNFL) thickness in early glaucoma by means of steady-state pattern electroretinogram (PERG) and optical coherence tomography (OCT), respectively.
METHODS
Eighty-four persons with suspected glaucoma due to disc abnormalities (GS: mean age 56.6 ± 13.8 years, standard automated perimetry [SAP] mean deviation [MD] -0.58 ± 1.34 dB) and 34 patients with early manifest glaucoma (EMG, mean age 65.9 ± 10.7 years, SAP MD -2.7 ± 4.5 dB) were tested with PERG and OCT. Both GS and EMG patients had small refractive errors, corrected visual acuity ≥20/25, and no systemic or retinal disease other than glaucoma.
RESULTS
MDs from age-predicted normal values were larger for PERG amplitude (GS: -1.113 dB; EMG: -2.352 dB) compared with the PERG-matched RNFL thickness (GS: -0.217 dB; EMG: -0.725 dB). Deviations exceeding the lower 95% tolerance intervals of the normal population were more frequent for PERG amplitude (GS: 26%; EMG: 56%) than PERG-matched RNFL thickness (GS: 6%; EMG: 29%).
CONCLUSIONS
In early glaucoma, reduction in RGC electrical activity exceeds the proportion expected from lost RGC axons, suggesting that a population of viable RGCs in the central retina is dysfunctional. By combining PERG and OCT it is, in principle, possible to obtain unique information on reduced responsiveness of viable RGCs.
Glaucoma is an optic neuropathy characterized by progressive loss of retinal ganglion cells (RGCs) and their axons, changes in optic disc topography, and associated deficits of visual function. The current hypothesis regarding the structure-function relationship in early clinical glaucoma is that of an RGC functional reserve or RGC redundancy. This hypothesis is consistent with the finding that as many as half of RGCs and their axons1,2 may be lost before there is detectable loss in visual function as measured by standard threshold visual field testing (white-on-white standard automated perimetry, SAP). The hypothesis assumes that psychophysical sensitivity is determined by the most sensitive detectors and that there is enough redundancy of RGCs that a subpopulation of them can retain normal sensitivity, even though many other RGCs may be dysfunctional or lost.
Experimental studies of structure-function relationships in primate models of glaucoma may suggest a radically different hypothesis from the “functional-reserve” model; namely, RGCs may undergo a stage of reversible dysfunction before dying. In their seminal work in monkeys with experimental glaucoma, Harwerth et al.3,4 reported progressive sensitivity losses in the SAP, with increasing RGC loss above 50%. In some locations, however, SAP sensitivity losses of 6 to 12 dB were found even for no or minimal RGC losses (0%-10%). In creating a model based on the data of Harwerth et al.,3 Swanson et al.5 proposed that RGC dysfunction may play a role in addition to RGC loss. Marx et al.6,7 compared the pattern electroretinogram (PERG) with optic disc cupping in eight monkeys with monocular laser-induced experimental glaucoma. Substantial PERG amplitude losses (of approximately 50% compared with the control eye) were seen in all eyes after a sustained increase in IOP. Despite PERG amplitude losses, no sign of disc cupping was evident in photographic pictures of optic nerves taken during a follow-up period of 3 months in eyes with average IOP levels of 30 to 40 mm Hg. For higher IOP levels, however, clear increases of optic disc cupping as well as PERG amplitude reductions were evident as early as 2 weeks after surgery, and progressed during the follow-up period. Taken together, the results of both Harwerth et al.3 and Marx et al.6,7 suggest that RGC dysfunction precedes RGC death in glaucoma, at least in glaucoma models with acutely induced IOP elevation.
A possibility generated by this hypothesis is that RGC dysfunction is reversed with decreasing IOP. Recent results8 provide proof of concept that this may indeed be the case, since PERG abnormalities in patients with glaucoma (with both normal and high baseline IOP) may significantly improve after IOP reduction. By contrast, normal PERG amplitude of control subjects is unchanged after IOP reduction. Psychophysical measurements may also improve after IOP reduction.9
If the dysfunction-preceding-death hypothesis were correct, one would expect that in early glaucoma, RGC dysfunction exceeds the proportion expected from lost RGCs. The present study tests this prediction by comparing PERG amplitude and retinal nerve fiber layer (RNFL) thickness as surrogate measures of RGC function and structure, respectively. It will be shown that, in patients with suspected glaucoma and in patients with manifest glaucoma in the early stages, PERG losses are relatively larger than RNFL thickness losses. This finding suggests that reduction of RGC electrical activity exceeds the proportion expected from lost RGCs, thereby supporting the hypothesis of RGC dysfunction preceding RGC death.
METHODS
Evaluating RGC Function with PERG
The most studied direct index of RGC function is the PERG, which is a special kind of ERG in response to contrast-reversal of patterned stimuli, rather than uniform flashes of light.10 RGCs are necessary for the PERG generation, because their selective loss after optic nerve transection in mammals abolishes the response.11,12 In diseases that presumably damage RGCs selectively, such as ocular hypertension and glaucoma (for review, see Refs. 13,14) and diseases of the anterior visual pathway,15,16 the PERG is also altered, whereas the conventional flash-ERG is unaffected.
In experimental primate models of optic nerve transection12 and glaucoma,17 the amount of PERG amplitude reduction is consistent with the degree of damage apparent by counting either RGCs or optic nerve fibers. Relevant to the goals of this study are several properties of the human PERG (for review, see Ref. 18): (1) for a given retinal eccentricity, the PERG amplitude shows linear spatial summation19 (i.e., the PERG amplitude doubles when the stimulus area is doubled); (2) the PERG amplitude is band-pass spatially tuned19,20 (i.e., the PERG amplitude displays a maximum at a specific spatial frequency); (3) the peak spatial frequency decreases with increasing retinal eccentricity,19,21 and at any eccentricity its absolute value is consistent with the expected size of the receptive field center of RGCs22; and (4) for a given retinal eccentricity and stimulus area, the PERG amplitude to the peak spatial frequency is linearly proportional to the expected volume of RGCs.23
An important distinguishing characteristic of the PERG is that it requires the physiological integrity of viable RGCs to be generated. The PERG amplitude can be reversibly reduced by intravitreal injections of tetrodotoxin which block the spiking activity in the inner retina.24,25 Temporarily increasing the IOP to 30 mm Hg or above has the effect of progressively and reversibly reducing the PERG amplitude.26,27 Pharmacological reduction of IOP may improve the abnormal PERG amplitude of patients with ocular hypertension and glaucoma.8 Taken together, these findings indicate that reduction in PERG amplitude may reflect both the reduced activity of dysfunctional RGCs, as well as the lack of activity of lost RGCs. By comparing relative losses of PERG amplitude (due to both reduced activity of dysfunctional RGCs and absent activity of lost RGCs) with those of RNFL thickness (due to absent axons of lost RGCs) it is theoretically possible to infer the proportion of RGC dysfunction that exceeds that expected from RGC death.
PERG Technique
The PERG has been recorded simultaneously from both eyes using skin electrodes according to a user-friendly PERGLA paradigm recently described.28 The paradigm has been incorporated into a commercially available instrument (Glaid; Lace Elettronica, Pisa, Italy). In brief, standard 9-mm diameter, flat-cup electrodes were taped on the lower eyelids, whereas reference and ground electrodes were taped on the ipsilateral temples and central forehead, respectively. The pattern stimulus consisted of horizontal gratings (1.7 cyc/deg, 25° circular field, 95% contrast, 40 cd/m2 mean luminance), reversed in counter-phase at 8.14 Hz (16.28 reversals/s). Signals were band-pass filtered (1-30 Hz), amplified (100,000-fold), and averaged (600 sweeps). Subjects with undilated pupils were optically corrected for the viewing distance (30 cm) and were asked to fixate on a target at the center of the stimulus. Subjects were allowed to blink freely. Sweeps contaminated by eye blinks or gross eye movements were automatically rejected over a threshold voltage of 25 μV. The recording time was approximately 3 minutes. Under these conditions, the noise level obtained by recording a response to an occluded stimulus is 0.08 ± 0.03 μV in both normal subjects and patients.28
An example of a PERG waveform is shown in Figure 1A. Since the stimulus pattern reverses in contrast at a relatively fast rate, the wave-form (continuous tracings) has an approximately sinusoidal shape and a frequency corresponding to the contrast-reversal rate (steady state response). PERG waveforms are automatically analyzed by discrete Fourier transform (DFT) to isolate the sinusoidal component at the contrast-reversal frequency (dashed tracings) from unwanted electrical activity and measure its amplitude in microvolts and phase lag in π rad. The PERG amplitude is evaluated as one half of peak-to-trough amplitude, and the PERG phase is evaluated relative to the reversal period (vertical grid: 61.4 ms = 2 π rad). This steady state paradigm differs to some extent from the more conventional PERG to slow-reversing checkerboards that result in a transient response characterized by a P50 and N95 components.29-32 The main advantage of the steady state paradigm is that of a more robust averaging per unit of time (improved reduction of the noise), thereby allowing reliable recording from skin electrodes.28 In addition, steady state PERG is reported to be relatively more altered than the transient PERG in glaucoma (e.g., Ref. 13) possibly because an optimally high temporal frequency is a metabolically challenging stimulus that causes increased optic nerve head blood flow (Logean E, et al. IOVS 2002;43:ARVO E-Abstract 3314) and RGC habituation.33 Checkerboards, compared to gratings, have a much more complex spatial structure. However, gratings and checkerboards generate PERGs of comparable amplitude for equivalent spatial frequencies (i.e., Ref. 34).
FIGURE 1.
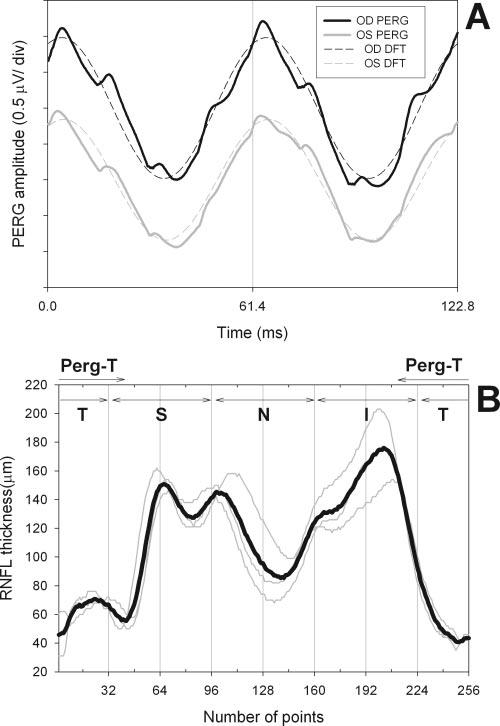
(A) Example of steady state PERG recorded simultaneously from both eyes of a subject with suspicion of glaucoma due to increased optic disc cupping (right eye: black, left eye: gray). Dashed tracings superimposed on the PERG waveforms represent the response component at the contrast-reversal frequency isolated by means of digital Fourier transform (DFT) analysis. (B) Example of RNFL thickness profile recorded from the right eye of a patient with suspected glaucoma. Thin gray lines: four consecutive scans. Thick black line: average of four scans. The vertical grid defines different quadrants of the scan (T, temporal; S, superior; N, nasal; I, inferior). PERG-T represents a temporal sector (60° above and 75° the horizontal meridian) recipient of the RGC axons originating from the area subtended by the PERG stimulus.
Evaluating the Number of RGC Axons with OCT
Optical coherence tomography (OCT) produces high-resolution, crosssectional images of the retina using the optical backscattering of light produced by individual longitudinal A-scans.35 Reduction of RNFL thickness as measured by OCT is related to increased severity of RNFL damage assessed photographically36 as well as to histomorphometric RNFL thickness in primates.37 OCT-determined RNFL has been shown to decrease with age,38,39 with increasing severity of glaucoma,40-42 and with progression of glaucoma.43
Other imaging techniques such as confocal scanning laser ophthalmoscopy (CSLO) and scanning laser polarimetry (SLP) also provide an index of decreasing RGC axons in glaucoma with sensitivity comparable to that of OCT.44 In this study, OCT was preferred to both CSLO and SLP, because it seems to have a more direct relationship with the number of RGC axons. CSLO measures the neuroretinal rim area, which has a complex relationship with the number of RGC axons.45 In addition, changes in the rim area may reflect posterior bowing of the connective tissue of the lamina cribrosa that are not necessarily associated with changes in the number of RGC axons. SLP measures the birefringence due to the oriented cylindrical structure of RGC axons, and SLP-determined RNFL thickness is roughly proportional to the thickness of the histologically measured RNFL thickness.46 Birefringence, however, also depends on the density and/or composition of axonal organelles, which varies around the optic nerve head and may vary in different stages of disease.47
Peripapillary RNFL thickness was evaluated with the fast RNFL program of the Stratus OCT (Carl Zeiss Meditec, Dublin, CA) and analyzed with software version 3.0. RNFL thickness is determined at 256 points in a circular scan (diameter 3.4 mm) around the center of the optic disc that is repeated three consecutive times. For each eye, RNFL scans were repeated four times and exported on an electronic worksheet, and an average scan was computed. The scan is shown unwrapped in a horizontal plane to (Fig. 1B). RNFL thickness was evaluated from the average scan (Fig. 1B).
The PERG is recorded in response to a circular stimulus with a radius of 12.5° centered on the fovea. Based on known retinal topography,48-51 axons of RGCs recruited by the PERG stimulus are expected to enter the disc in the temporal sector which subtends approximately 60° above and 75° below the horizontal axis. The diagram shown in Figure 2 depicts the retinal location and the relative proportions of the PERG stimulus and the RNFL scan. The RNFL thickness of the temporal sector corresponding to 60° above and 75° below the horizontal axis can be calculated from the appropriate portions of the average scan (PERG-matched temporal thickness). Mean RNFL thickness and quadrant thicknesses were also evaluated.
FIGURE 2.
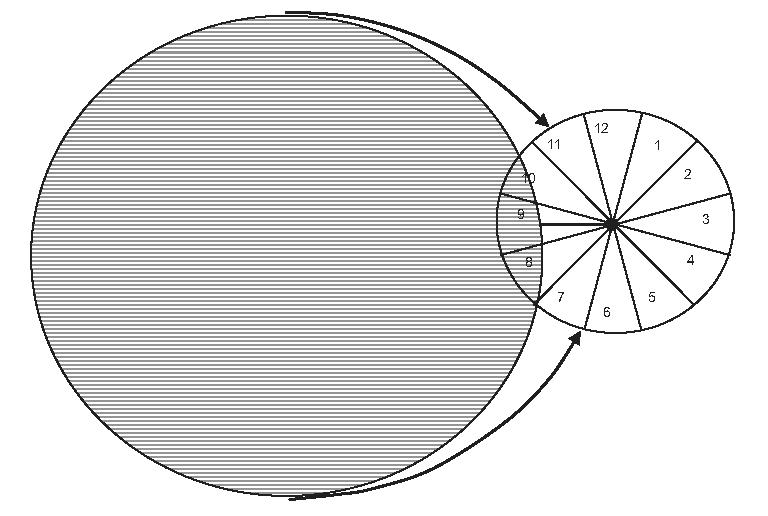
Relative size of retinal area covered by the PERG stimulus (circular pattern of horizontal bars centered on the fovea) and the RNFL scan (clock-hour circle centered on optic disc). Axons originating from ganglion cells covered by the PERG stimulus spread over a temporal sector of the RNFL scan approximately corresponding to clock-hour sectors 7, 8, 9, to 10 plus one half of 11.
The research adhered to the tenets of the Declaration of Helsinki. The study was approved by the Institutional Review Board of the University of Miami. Informed written consent was obtained by all subjects after the nature of the test and possible risks were explained in detail.
Statistics
In each patient, only the right eye was analyzed. Pearson correlations between PERG amplitudes and RNFL thicknesses for different sectors were calculated. To determine whether PERG amplitude was relatively more altered than OCT, PERG amplitude, and RNFL thickness were expressed as signed deviations in decibels from age-predicted normal values. Deviations in decibels have the advantage of providing a normalized measure of change for PERG amplitude, RNFL thickness, and SAP. For both PERG amplitude and RNFL thickness, observed-to-predicted ratios were calculated, log transformed to obtain equivalent numbers independently of whether the observed or predicted value was larger, and multiplied by 10 to convert them to decibel units [10 · log (observed/predicted)].
Age-predicted normal values for PERG amplitude, as well as one-sided 95% lower tolerance intervals, were calculated by using previously reported data14,28 obtained in a population of 114 normal control subjects of different age (range, 22-85 years; mean, 46.4 ± 18.2 years) including 14% African Americans. Age-predicted PERG amplitude was calculated according to the formula [log (amplitude) = 0.612-0.374 · log (age)]. Residuals around the regression of PERG amplitude with age are normally distributed.14 We used this relationship between PERG amplitude and age to adjust the amplitudes of our normal control subjects to the population average and compared this distribution with our Gaussian tolerance interval. This tolerance interval would classify 8.6% of subjects as abnormally low, which is close to the ideal 5%. Further, the 95% confidence interval around this proportion ranges from 4% to 16%, which includes the ideal 5%. The age-predicted, one-sided lower 95% tolerance limit of normal PERG amplitude was: .
An assumption of our analysis is that the Gaussian approximation is appropriate for the OCT data as well. Normal values for RNFL thickness, were obtained from recently published data52 obtained in a population of 109 normal subjects of different age (range, 23-90 years; mean, 42.8 ±14.6 years) including 27% African-Americans. The normal RNFL thickness for the PERG-matched temporal sector was calculated by averaging appropriate clock-hour RNFL sectors (7, 8, 9, and 10, plus one half of 11) as depicted in Figure 2. Based on this calculation, the average RNFL thickness of the PERG-matched temporal sector was 96.3 ± 13.5 μm. Because OCT-determined RNFL thickness shows a slight physiological decrease with age, data were age-adjusted by a factor of -0.2 μm/year (0.18%/year) based on recent data obtained in a large number (n > 140) of normal subjects.38,39 The age-predicted RNFL thickness was: [RNFL = 104.9 - 0.2 * age]. The one-sided 95% lower tolerance interval for the PERG-matched temporal sector was: [RNFL = 104.9 - 0.2 · age -1.645 * 13.5].
Differences between PERG and RNFL deviations were calculated, and the means were compared with two-way repeated-measures ANOVA and Holm-Sidak post hoc multiple-comparison tests. Classification of GS and EMG patients as below the 95% limit of normal by PERG and OCT criteria was also performed.
RESULTS
Results were obtained from 84 subjects with suspected glaucoma (GS, mean age 56.6 ± 13.8 years, 27% of African-American descent), and 34 patients with early manifest glaucoma (EMG, mean age 65.9 ± 10.7 years, 23% of African-American descent). Eligibility was determined by a comprehensive eye examination and medicalocular history. Eye examination included IOP evaluation with Goldmann applanation tonometry, gonioscopy, dilated fundus examination, and stereophotographs of the optic disc, from which vertical cup-to-disc (C/D) ratios were evaluated. GS patients had small refractive errors (-0.68 ± 2.3 spherical diopters), normal corrected visual acuity (≥20/25), normal SAP (Humphrey Visual Field Analyzer II; Carl Zeiss Meditec, 24-2 SITA Standard: mean deviation [MD] -0.58 ±1.34 dB), but optic disc abnormalities (vertical cup-to-disc [C/D] ratio > 0.5, C/D asymmetry ≥ 0.2, localized thinning of the disc, splinter hemorrhages), and one or more risk factors for glaucoma (family history positive for glaucoma, old age, African descent, increased IOP (>21 mm Hg). EMG patients also had small refractive errors (-0.82 ± 2.3 spherical diopters), normal corrected visual acuity (≥20/25) and optic disc abnormalities, but in addition had repeatable defects of SAP (glaucoma hemifield test outside normal limits, pattern SD of P < 5%, or a cluster of ≥3 points in the pattern deviation plot in the superior or inferior hemifield with P < 5%, one of which reached P < 1%) and/or progressive glaucomatous changes of the optic disc. The average SAP MD was -2.7 ± 4.5 dB.
Exclusion criteria were the presence of ocular disease other than glaucoma, and presence of systemic disease that may cause nonspecific PERG abnormality such as diabetes, Parkinson’s disease, and multiple sclerosis. Patients with previous intraocular surgery, except for uncomplicated cataract extraction, were excluded. Patients with high myopia (>5 D) were also excluded, because the ERG may be nonspecifically reduced in high myopia.53 Eight (10%) of 84 GS patients and 24 (71%) of 34 EMG patients were on various topical medications to reduce IOP.
Raw Data
PERG amplitudes and RNFL thicknesses for the PERG-matched temporal sector measured in the right eyes of all patients are summarized in Figure 3A as scattergrams. Despite large data scattering, it is possible to appreciate that PERG amplitude tends to decrease with decreasing RNFL thickness. The Pearson correlation between PERG amplitude and RNFL thickness for age-adjusted data is reported in Table 1. Correlation is also reported for the mean RNFL thickness.
FIGURE 3.
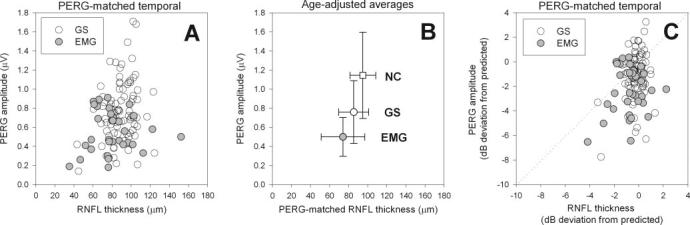
A) PERG amplitude as a function of RNFL thickness of the PERG-matched temporal sector in GS and EMG patients. (B) Average PERG amplitude as a function of average RNFL thickness of the PERG-matched temporal sector in NCs (□), GS, and EMG. Averages have been adjusted to the mean age of the whole subject population. Bidirectional errors bars represent standard deviations. (C) Signed deviations in dB from age-predicted normal values of PERG amplitude and RNFL thickness of the PERG-matched temporal sector in GS and EMG patients.
TABLE 1.
Age-Adjusted Correlations
| n | R | P | |
|---|---|---|---|
| Suspected glaucoma | |||
| PERG vs. mean RNFL | 84 | 0.309 | 0.004 |
| PERG vs. PERG-matched RNFL | 84 | 0.285 | 0.009 |
| Early manifest glaucoma | |||
| PERG vs. mean RNFL | 34 | 0.165 | 0.35 |
| PERG vs. PERG-matched RNFL | 34 | 0.089 | 0.62 |
Overall, the PERG amplitude correlated weakly with both mean RNFL thickness and PERG-matched RNFL thickness in the GS group, and was nonsignificant in the EMG group. The correlation coefficients are not significantly different from each other, however. (GS, r = 0.285 vs. r = 0.089; EMG, P = 0.33 and r = 0.309 vs. r = 0.165; P = 0.47).54 The lower correlation in the EMG group, compared with the GS group, may reflect differences in ranges of PERG amplitudes (GS: 0.12-1.68 μV; EMG: 0.16-0.87 μV). If PERG amplitude range in the GS group is truncated by removing amplitudes ≥1.0 μV, the correlation coefficients are similar.54
Group Averages
Raw data for PERG amplitude and RNFL thickness measured in the right eyes of GS and EMG patients were averaged to calculate group means and SDs. Corresponding means and SDs for normal control subjects (NCs) were obtained from previously published data as detailed in the Methods section. Since GS and EMG patients and NCs have different mean ages, mean PERG amplitude and RNFL thickness for NC and GS were age-adjusted to the average age (50.2 years) using the correction factors described in the Methods section. The results are depicted in Figure 3B as scattergrams showing the mean ± bidirectional SDs. It can be seen that age-adjusted average PERG amplitude and mean RNFL thickness decrease with increasing disease severity in an approximately linear fashion. The difference in PERG amplitude between NC and EMG is 0.645 μV, whereas the corresponding difference in RNFL thickness is 20.9 μm. This would correspond to a loss of 0.03 μV of PERG amplitude per 1.0 μm loss of RNFL thickness in the severity range of our patient population. Differences between group means (Bonferroni-corrected two-sample t-test) are significant for both PERG amplitude and mean RNFL thickness (NC versus GS: PERG P ≤ 0.001, t = 6.48, RNFL P =< 0.001, t = 4.47; GS versus EMG: PERG P = 0.001, t = 4.37; RNFL P = 0.005, t = 3.07). Relative changes are larger for the PERG than for OCT: NC versus GS, PERG -34%, RNFL -10%; NC versus EMG: PERG -56%, RNFL -22%).
Figure 3B also shows that the variance (size of error bars) of PERG amplitude decreases substantially with increasing severity of disease (NC: 0.45; GS: 0.33; EMG: 0.21, P < 0.001, Levene’s test), whereas the variance of RNFL thickness does not.
Deviations from Age-Predicted Values
Signed deviation from age-predicted normal values are summarized in Figure 3C as scattergrams. It can be noted that deviations tended to be relatively larger for PERG amplitude compared with RNFL thickness—particularly in EMG patients compared with GS patients. In Figure 4 average deviations are expressed as histograms ± SE bars. Average signed deviations for GS and EMG were compared using a two-way repeated measures ANOVA. Results showed significant effects for severity of disease (EMG > GS: P < 0.001), difference between kind of measurement (PERG amplitude deviation > regional RNFL thicknesses deviation: P < 0.001), and a relatively small interaction effect between severity of disease and kind of measurement (P = 0.012). The significant interaction is probably due to differences in deviations between EMG and GS groups. Further, Holm-Sidak post hoc comparisons within each group demonstrated that PERG amplitude deviations are significantly (P < 0.005) greater than deviations of all regional RNFL measurements. Average deviations for PERG amplitude (GS: -1.113 dB; EMG: -2.352 dB) and mean RNFL thickness (GS: -0.217 dB; EMG: -0.725 dB) were very similar to those calculated in Figure 3 by age-adjusting mean PERG amplitude and RNFL thickness. Overall, PERG amplitude deviation significantly exceeded PERG-matched RNFL thickness deviation (by 0.896 dB in GS patients and by 1.627 dB in EMG patients).
FIGURE 4.
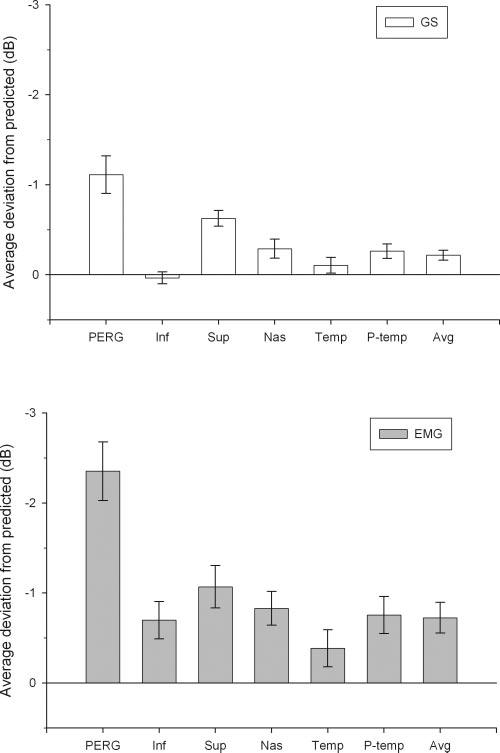
Average deviations from predicted ± SEM for PERG amplitude and RNFL thickness of different regions of the optic nerve. Note that PERG deviation is larger than RNFL deviation for all regions of the optic nerve. Also note that deviations of both PERG amplitude and RNFL thickness are larger in EMG than in GS subjects.
Frequency of Significant Abnormalities
A further comparison between PERG amplitude and RNFL thickness may be performed by evaluating the number of abnormal measures (i.e., those smaller than the 95% lower tolerance intervals of the normal population obtained as detailed in the Methods section). Comparisons have been made for the PERG-matched temporal sector and the superior sector, which is the most affected sector in our patient population. The results are summarized in Table 2.
TABLE 2.
Number of Normal and Abnormal Measures for PERG Amplitude and RNFL Thickness
| PERG-Matched Temporal Sector |
Superior Sector |
|||||
|---|---|---|---|---|---|---|
| RNFL Nor. | RNFL Abn. | Total | RNFL Nor. | RNFL Abn. | Total | |
| Suspected Glaucoma | ||||||
| PERG nor. | 59 | 3 | 62 | 38 | 24 | 62 |
| PERG abn. | 20 | 2 | 22 | 13 | 9 | 22 |
| Total | 79 | 5 | 84 | 51 | 33 | 84 |
| Early Manifest Glaucoma | ||||||
| PERG nor. | 10 | 5 | 15 | 7 | 8 | 15 |
| PERG abn. | 14 | 5 | 19 | 6 | 13 | 19 |
| Total | 24 | 10 | 34 | 13 | 21 | 34 |
Data were obtained from the PERG-matched temporal sector and superior sector, evaluated in 84 right eyes with GS and 34 right eyes with EMG. Nor., normal; abn, abnormal.
PERG-matched Temporal Sector
The number of GS found abnormal by PERG and not OCT (n = 20) was significantly higher than the number found by OCT and not PERG (n = 3, P = 0.001, McNemar’s exact test). The number of EMG found abnormal by PERG and not OCT (n = 14) is also higher than the number found by OCT and not PERG (n = 5); however, the difference is not significant (P = 0.064, Mc-Nemar’s exact test).
Superior Sector
In the GS group, OCT identified more subjects as abnormal when PERG amplitude was normal (n = 24) than the PERG found abnormal with normal OCT (n = 13), though the difference is not statistically significant (P = 0.099, McNemar’s test). Among the EMG patients, there was an approximately even split of patients detected as abnormal by one instrument but not the other (P = 0.79).
Relationship between Deviations of PERG, OCT, and SAP
Expressing deviations of PERG amplitude and RNFL thickness in decibels allowed a straightforward comparison with SAP MDs. Correlations (Pearson’s) between PERG and SAP and OCT and SAP are summarized in Table 3.
TABLE 3.
Correlation between Deviations from Expected of PERG Amplitude and PERG-Matched RNFL Thickness with SAP MD
| n | R | P | |
|---|---|---|---|
| Suspected glaucoma | |||
| PERG vs. SAP | 84 | 0.225 | 0.042 |
| PERG-matched RNFL vs. SAP | 84 | -0.079 | 0.479 |
| Early manifest glaucoma | |||
| PERG vs. SAP | 34 | 0.390 | 0.025 |
| PERG-matched RNFL vs. SAP | 34 | 0.194 | 0.289 |
Altogether, the PERG amplitude correlated significantly but weakly with SAP in the GS and EMG subgroups.14,45 In the same subgroups, the correlation between PERG-matched RNFL thickness and SAP was not significant. Of note, the average PERG deviations (GS: -1.13 dB; EMG: -2.352 dB) were of the same order of magnitude of the average SAP MDs (GS: -0.58 dB; EMG: -2.7 dB). These results may suggest that, on average, RGC functional losses are reflected to some extent in psycho-physical losses of visual sensitivity in early glaucoma.
DISCUSSION
In this study, we investigated whether, in early glaucoma, loss of electrophysiological RGC function is relatively larger than expected from anatomic loss of RGC axons. If so, it suggests that a population of viable RGCs respond with reduced activity, thus signaling a stage of distress that may lead to premature death.
In subjects with suspected glaucoma (GS) and in patients with manifest glaucoma in the early stages (EMG), we compared PERG- and OCT-determined RNFL thicknesses as surrogate measures of RGC function and structure, respectively. OCT and PERG are gross indices of RGC structure and function; nevertheless, these techniques are noninvasive, objective, and readily available. They may provide a powerful means of investigating structure-function relationships of RGCs in individual patients on a large scale.
Loss of PERG Amplitude and RNFL Thickness in Early Glaucoma
Our results confirm that both PERG amplitude and RNFL thickness significantly decrease with increasing severity of glaucoma.13,14,40-42 PERG amplitude correlated weakly with OCT-determined RNFL thickness in early glaucoma, in agreement with previous reports.55,56 This further supports the notion that the presence of RGCs and their axons is necessary for the generation of the PERG11,17: the lower the number of RGC axons, the smaller the PERG amplitude. The weakness of the correlation, however, suggests that structure-function relationships of RGCs in glaucoma may include additional terms and effects. One factor may be that reduction in PERG amplitude is caused in part by the reduced responsiveness of RGCs rather than loss of RGCs. Indeed, our results indicate that PERG amplitude is relatively more reduced or more frequently reduced than PERG-matched RNFL thickness. In GS the PERG amplitude deviation from age-predicted normal exceeded RNFL deviation by approximately 0.9 dB in GS and by approximately 1.6 dB in EMG. These differences are consistent with the hypothesis of RGC dysfunction preceding cell death. This hypothesis also predicts that the worse the glaucomatous damage, the fewer the RGCs in play, and the smaller the PERG variance. Indeed, the PERG amplitude variance, but not the RNFL variance, decreases with increasing severity of disease.
Significance of PERG Amplitude and RNFL Loss
Reduced activity of viable RGCs is compatible with the observation that in experimental glaucoma due to chronic elevation of IOP, visual responses may be substantially impaired in the presence of minor RGC loss3 or loss of optic nerve head tissue.6,7 In experimental glaucoma, RGC somata and dendritic harbors may undergo significant shrinkage,57,58 resulting in a diminished responsiveness. Such structural changes are not likely to be detected by current OCT programs.
Interpreting the excess PERG deviation as a proportion of dysfunctional RGCs may be an oversimplification and/or underestimation of the facts. First, it is impossible to distinguish between the various alternatives, (1) a proportion of RGCs have responses reduced by a given amount, (2) all RGCs are dysfunctional, and the amount of dysfunction varies with severity of disease, (3) the amount of dysfunction varies among different cell subpopulations. Second, the excess PERG deviation may not represent the true extent of RGC dysfunction. The difference between PERG and OCT deviations assumes a linear decrease of measures with increasing severity of disease, which has not been demonstrated. The problem of linearity is likely minimized for small deviations from normal, such as those occurring on average in GS and EMG patients. As shown in Figure 3B, PERG amplitude and RNFL thickness appear to decrease rather linearly with increasing severity of disease in the early stages.
Dynamic Range of PERG Amplitude and RNFL Thickness
With linear extrapolation of data to the x-y coordinates, a PERG amplitude equal to zero corresponds to approximately 50 μm mean RNFL thickness. Little is known about the linearity of PERG and OCT signals for more advanced stages of glaucoma, however. The lower limit of dynamic range of the PERG amplitude is represented by the noise level. With our paradigm, advanced glaucoma may reduce the PERG amplitude to the noise level,59 which in our recording conditions is 0.08 ± 0.03 μV.28
In principle, the noise level for RNFL thickness should be represented by the resolution of the system (approximately 10 μm). It is likely, however, that the actual lower limit of the RNFL dynamic range be represented by nonaxonal remnants (i.e., glia, vessels). The proportion of glia in nerve fiber bundles in primate retina is reported to be 20% to 30% and in some locations as much as 42%.60 In eyes with absolute glaucoma the histologically determined mean RNFL thickness is reported to be approximately 40 μm.61 It is also possible that gliosis may replace axons62-65 and show a thicker than expected residual RNFL thickness in advanced stages of glaucoma, where few RGC axons are expected to be present. Assuming that in absolute glaucoma the PERG amplitude were at the noise level14,28 and the residual mean RNFL thickness were at 40 μm,61 the lower limits of the dynamic ranges of the PERG amplitude and mean RNFL thickness are expected to be approximately 90% and 62%, respectively, smaller than the agepredicted normal values (see the Methods section). If the percentage of amplitude losses is rescaled on the corresponding dynamic range, then the PERG appears to have lost approximately 20% of its dynamic range in GS and approximately 40% in EMG. When the percentage of mean RNFL thickness losses are rescaled on the dynamic range, then the mean RNFL thickness appears to have lost approximately 5% of its dynamic range in GS and approximately 18% in EMG.
CONCLUSIONS
The present results indicate that in patients with early stages of glaucoma the total amount of RGC electrophysiological activity is, on average, less than expected from the loss of RGC axons. This suggests that an undefined proportion of central RGCs is dysfunctional and may undergo premature death if the causes of dysfunction are not reduced or blocked. The magnitude of disproportionate PERG amplitude loss ranges between ∼19% in GS and ∼33% in EMG. For the reasons outlined earlier, these percentages may not represent the actual proportion of dysfunctional RGCs. We also cannot exclude that the percentage of disproportionate PERG amplitude loss could have been larger, given that most EMG patients received IOP-lowering treatment. Indeed, it has been shown in an independent group of patients with early stages of glaucoma that abnormal PERG amplitude may substantially increase after IOP-lowering treatment.8
That the PERG amplitude is relatively more altered or more frequently altered than PERG-matched RNFL thickness does not mean that the PERG is a clinical test more efficient than OCT in detecting early glaucoma. RNFL thickness often shows focal defects that may not be reflected in the summed activity of PERG generators in the central retina. Indeed, our study shows that superior RNFL thickness may be even more altered than the PERG amplitude. In addition, the PERG may have a high rate of false positives.13 Likewise, the fact that the patients tested had greater functional damage (SAP MD, dB) compared with structural (OCT RNFL, dB) damage does not contradict the published data showing evidence of greater sensitivity of structural damage compared with functional (SAP) measures in detecting early glaucomatous changes.66 The ability of OCT and SAP in detecting early damage also reflects the relative variability and extent of tolerance intervals, which are known to be quite large for SAP MD (dB) compared with RGC loss (dB) in early stages of glaucoma.67
In conclusion, this study indicates that by combining PERG and OCT it is in principle possible to obtain unique information on reduced responsiveness of viable RGCs. Future studies will show whether, and how much, disproportionate PERG amplitude losses may be actually restored in individual patients.
Acknowledgments
The authors thank William Buchser for writing the MatLab program (The MathWorks, Natick, MA) for compiling exported OCT data.
Footnotes
Supported by National Eye Institute Grant R01-EY14957, The Glaucoma Foundation, National Eye Institute Center Grant P30-EY14801, an unrestricted grant to the University of Miami from Research to Prevent Blindness, Inc., and Alpha Omega Alpha (NS).
Disclosure: L.M. Ventura, None; N. Sorokac, None; R. De Los Santos, None; W.J. Feuer, None; V. Porciatti, Lace Elettronica (C), P
The publication costs of this article were defrayed in part by page charge payment. This article must therefore be marked “advertisement” in accordance with 18 U.S.C. §1734 solely to indicate this fact.
References
- 1.Kerrigan-Baumrind LA, Quigley HA, Pease ME, et al. Number of ganglion cells in glaucoma eyes compared with threshold visual field tests in the same persons. Invest Ophthalmol Vis Sci. 2000;41:741–748. [PubMed] [Google Scholar]
- 2.Quigley HA, Katz J, Derick RJ, et al. An evaluation of optic disc and nerve fiber layer examinations in monitoring progression of early glaucoma damage. Ophthalmology. 1992;99:19–28. doi: 10.1016/s0161-6420(92)32018-4. [DOI] [PubMed] [Google Scholar]
- 3.Harwerth RS, Carter-Dawson L, Shen F, et al. Ganglion cell losses underlying visual field defects from experimental glaucoma. Invest Ophthalmol Vis Sci. 1999;40:2242–2250. [PubMed] [Google Scholar]
- 4.Harwerth RS, Crawford ML, Frishman LJ, et al. Visual field defects and neural losses from experimental glaucoma. Prog Retin Eye Res. 2002;21:91–125. doi: 10.1016/s1350-9462(01)00022-2. [DOI] [PubMed] [Google Scholar]
- 5.Swanson WH, Felius J, Pan F. Perimetric defects and ganglion cell damage: interpreting linear relations using a two-stage neural model. Invest Ophthalmol Vis Sci. 2004;45:466–472. doi: 10.1167/iovs.03-0374. [DOI] [PubMed] [Google Scholar]
- 6.Marx MS, Podos SM, Bodis-Wollner I, et al. Flash and pattern electroretinograms in normal and laser-induced glaucomatous primate eyes. Invest Ophthalmol Vis Sci. 1986;27:378–386. [PubMed] [Google Scholar]
- 7.Marx MS, Podos SM, Bodis-Wollner I, et al. Signs of early damage in glaucomatous monkey eyes: low spatial frequency losses in the pattern ERG and VEP. Exp Eye Res. 1988;46:173–184. doi: 10.1016/s0014-4835(88)80075-7. [DOI] [PubMed] [Google Scholar]
- 8.Ventura LM, Porciatti V. Restoration of retinal ganglion cell function in early glaucoma after intraocular pressure reduction: a pilot study. Ophthalmology. 2005;112:20–27. doi: 10.1016/j.ophtha.2004.09.002. [DOI] [PMC free article] [PubMed] [Google Scholar]
- 9.Gandolfi SA, Cimino L, Sangermani C, et al. Improvement of spatial contrast sensitivity threshold after surgical reduction of intraocular pressure in unilateral high-tension glaucoma. Invest Ophthalmol Vis Sci. 2005;46:197–201. doi: 10.1167/iovs.04-0199. [DOI] [PubMed] [Google Scholar]
- 10.Riggs LA, Johnson EP, Schick AML. Electrical responses of the human eye to moving stimulus pattern. Science. 1964;144:567–568. doi: 10.1126/science.144.3618.567. [DOI] [PubMed] [Google Scholar]
- 11.Maffei L, Fiorentini A. Electroretinographic responses to alternating gratings before and after section of the optic nerve. Science. 1981;211:953–955. doi: 10.1126/science.7466369. [DOI] [PubMed] [Google Scholar]
- 12.Maffei L, Fiorentini A, Bisti S, Hollander H. Pattern ERG in the monkey after section of the optic nerve. Exp Brain Res. 1985;59:423–425. doi: 10.1007/BF00230925. [DOI] [PubMed] [Google Scholar]
- 13.Bach M. Electrophysiological approaches for early detection of glaucoma. Eur J Ophthalmol. 2001;11(suppl 2):S41–S49. doi: 10.1177/112067210101102s05. [DOI] [PubMed] [Google Scholar]
- 14.Ventura LM, Porciatti V, Ishida K, et al. Pattern electroretinogram abnormality and glaucoma. Ophthalmology. 2005;112:10–19. doi: 10.1016/j.ophtha.2004.07.018. [DOI] [PMC free article] [PubMed] [Google Scholar]
- 15.Fiorentini A, Maffei L, Pirchio M, et al. The ERG in response to alternating gratings in patients with diseases of the peripheral visual pathway. Invest Ophthalmol Vis Sci. 1981;21:490–493. [PubMed] [Google Scholar]
- 16.Holder GE. Pattern electroretinography (PERG) and an integrated approach to visual pathway diagnosis. Prog Retin Eye Res. 2001;20:531–561. doi: 10.1016/s1350-9462(00)00030-6. [DOI] [PubMed] [Google Scholar]
- 17.Johnson MA, Drum BA, Quigley HA, et al. Pattern-evoked potentials and optic nerve fiber loss in monocular laser-induced glaucoma. Invest Ophthalmol Vis Sci. 1989;30:897–907. [PubMed] [Google Scholar]
- 18.Zrenner E. The physiological basis of the pattern electroretinogram. Prog Retin Res. 1990;9427:464. [Google Scholar]
- 19.Hess RF, Baker CL., Jr. Human pattern-evoked electroretinogram. J Neurophysiol. 1984;51:939–951. doi: 10.1152/jn.1984.51.5.939. [DOI] [PubMed] [Google Scholar]
- 20.Porciatti V, Burr DC, Morrone MC, Fiorentini A. The effects of aging on the pattern electroretinogram and visual evoked potential in humans. Vision Res. 1992;32:1199–1209. doi: 10.1016/0042-6989(92)90214-4. [DOI] [PubMed] [Google Scholar]
- 21.Drasdo N, Thompson DA, Thompson CM, Edwards L. Complementary components and local variations of the pattern electroretinogram. Invest Ophthalmol Vis Sci. 1987;28:158–162. [PubMed] [Google Scholar]
- 22.Thompson DA, Drasdo N. Computation of the luminance and pattern components of the bar pattern electroretinogram. Doc Ophthalmol. 1987;66:233–244. doi: 10.1007/BF00145237. [DOI] [PubMed] [Google Scholar]
- 23.Drasdo N, Thompson DA, Arden GB. A comparison of pattern ERG amplitudes and nuclear layer thickness in different zones of the retina. Clin Vision Sciences. 1990;5:415–420. [Google Scholar]
- 24.Trimarchi C, Biral G, Domenici L, et al. The flash and pattern electroretinogram generators in the cat: a pharmacological approach. Clin Vision Sci. 1990;6:19–24. [Google Scholar]
- 25.Viswanathan S, Frishman LJ, Robson JG. The uniform field and pattern ERG in macaques with experimental glaucoma: removal of spiking activity. Invest Ophthalmol Vis Sci. 2000;41:2797–2810. [PubMed] [Google Scholar]
- 26.Kothe AC, Lovasik JV. A parametric evaluation of retinal vascular perfusion pressure and visual neural function in man. Electroencephalogr Clin Neurophysiol. 1990;75:185–199. doi: 10.1016/0013-4694(90)90172-g. [DOI] [PubMed] [Google Scholar]
- 27.Kremmer S, Tolksdorf-Kremmer A, Stodtmeister R. Simultaneous registration of VECP and pattern ERG during artificially raised intraocular pressure. Ophthalmologica. 1995;209:233–241. doi: 10.1159/000310622. [DOI] [PubMed] [Google Scholar]
- 28.Porciatti V, Ventura LM. Normative data for a user-friendly paradigm for pattern electroretinogram recording. Ophthalmology. 2004;111:161–168. doi: 10.1016/j.ophtha.2003.04.007. [DOI] [PMC free article] [PubMed] [Google Scholar]
- 29.Bach M, Hawlina M, Holder GE, et al. for the International Society for Clinical Electrophysiology of Vision Standard for pattern electroretinography. Doc Ophthalmol. 2000;101:11–18. doi: 10.1023/a:1002732114721. [DOI] [PubMed] [Google Scholar]
- 30.Graham SL, Wong VA, Drance SM, Mikelberg FS. Pattern electroretinograms from hemifields in normal subjects and patients with glaucoma. Invest Ophthalmol Vis Sci. 1994;35:3347–3356. [PubMed] [Google Scholar]
- 31.Bayer AU, Maag KP, Erb C. Detection of optic neuropathy in glaucomatous eyes with normal standard visual fields using a test battery of short-wavelength automated perimetry and pattern electroretinography. Ophthalmology. 2002;109:1350–1361. doi: 10.1016/s0161-6420(02)01100-4. [DOI] [PubMed] [Google Scholar]
- 32.Hood DC, Xu L, Thienprasiddhi P, et al. The pattern electroretinogram in glaucoma patients with confirmed visual field deficits. Invest Ophthalmol Vis Sci. 2005;46:2411–2318. doi: 10.1167/iovs.05-0238. [DOI] [PubMed] [Google Scholar]
- 33.Porciatti V, Sorokac N, Buchser W. Habituation of retinal ganglion cell activity in response to steady state pattern visual stimuli in normal subjects. Invest Ophthalmol Vis Sci. 2005;46:1296–1302. doi: 10.1167/iovs.04-1242. [DOI] [PMC free article] [PubMed] [Google Scholar]
- 34.Armington JC, Corwin TR, Marsetta R. Simultaneously recorded retinal and cortical responses to patterned stimuli. J Opt Soc Am. 1971;61:1514–1521. doi: 10.1364/josa.61.001514. [DOI] [PubMed] [Google Scholar]
- 35.Huang D, Swanson EA, Lin CP, et al. Optical coherence tomography. Science. 1991;254:1178–1181. doi: 10.1126/science.1957169. [DOI] [PMC free article] [PubMed] [Google Scholar]
- 36.Zangwill LM, Williams J, Berry CC, et al. A comparison of optical coherence tomography and retinal nerve fiber layer photography for detection of nerve fiber layer damage in glaucoma. Ophthalmology. 2000;107:1309–1315. doi: 10.1016/s0161-6420(00)00168-8. [DOI] [PubMed] [Google Scholar]
- 37.Huang L, Schuman J, Wang N. Comparison of nerve fiber layer thickness between optical coherence tomography and histomorphometry in glaucomatous monkey eyes [in Chinese] Chung Hua Yen Ko Tsa Chih. 2001;37:188–192. [PubMed] [Google Scholar]
- 38.Kanamori A, Escano MF, Eno A, et al. Evaluation of the effect of aging on retinal nerve fiber layer thickness measured by optical coherence tomography. Ophthalmologica. 2003;217:273–278. doi: 10.1159/000070634. [DOI] [PubMed] [Google Scholar]
- 39.Sony P, Sihota R, Tewari HK, et al. Quantification of the retinal nerve fibre layer thickness in normal Indian eyes with optical coherence tomography. Indian J Ophthalmol. 2004;52:303–309. [PubMed] [Google Scholar]
- 40.Schuman JS, Hee MR, Puliafito CA, et al. Quantification of nerve fiber layer thickness in normal and glaucomatous eyes using optical coherence tomography. Arch Ophthalmol. 1995;113:586–596. doi: 10.1001/archopht.1995.01100050054031. [DOI] [PubMed] [Google Scholar]
- 41.Medeiros FA, Zangwill LM, Bowd C, et al. Evaluation of retinal nerve fiber layer, optic nerve head, and macular thickness measurements for glaucoma detection using optical coherence tomography. Am J Ophthalmol. 2005;139:44–55. doi: 10.1016/j.ajo.2004.08.069. [DOI] [PubMed] [Google Scholar]
- 42.Nouri-Mahdavi K, Hoffman D, Tannenbaum DP, et al. Identifying early glaucoma with optical coherence tomography. Am J Ophthalmol. 2004;137:228–235. doi: 10.1016/j.ajo.2003.09.004. [DOI] [PubMed] [Google Scholar]
- 43.Wollstein G, Schuman JS, Price LL, et al. Optical coherence tomography longitudinal evaluation of retinal nerve fiber layer thickness in glaucoma. Arch Ophthalmol. 2005;123:464–470. doi: 10.1001/archopht.123.4.464. [DOI] [PMC free article] [PubMed] [Google Scholar]
- 44.Greaney MJ, Hoffman DC, Garway-Heath DF, et al. Comparison of optic nerve imaging methods to distinguish normal eyes from those with glaucoma. Invest Ophthalmol Vis Sci. 2002;43:140–145. [PubMed] [Google Scholar]
- 45.Garway-Heath DF, Holder GE, Fitzke FW, Hitchings RA. Relationship between electrophysiological, psychophysical, and anatomical measurements in glaucoma. Invest Ophthalmol Vis Sci. 2002;43:2213–2220. [PubMed] [Google Scholar]
- 46.Weinreb RN, Dreher AW, Coleman A, et al. Histopathologic validation of Fourier-ellipsometry measurements of retinal nerve fiber layer thickness. Arch Ophthalmol. 1990;108:557–560. doi: 10.1001/archopht.1990.01070060105058. [DOI] [PubMed] [Google Scholar]
- 47.Huang XR, Bagga H, Greenfield DS, Knighton RW. Variation of peripapillary retinal nerve fiber layer birefringence in normal human subjects. Invest Ophthalmol Vis Sci. 2004;45:3073–3080. doi: 10.1167/iovs.04-0110. [DOI] [PubMed] [Google Scholar]
- 48.Radius RL, Anderson DR. The course of axons through the retina and optic nerve head. Arch Ophthalmol. 1979;97:1154–1158. doi: 10.1001/archopht.1979.01020010608021. [DOI] [PubMed] [Google Scholar]
- 49.Fitzgibbon T, Taylor SF. Retinotopy of the human retinal nerve fibre layer and optic nerve head. J Comp Neurol. 1996;375:238–251. doi: 10.1002/(SICI)1096-9861(19961111)375:2<238::AID-CNE5>3.0.CO;2-3. [DOI] [PubMed] [Google Scholar]
- 50.Sanchez RM, Dunkelberger GR, Quigley HA. The number and diameter distribution of axons in the monkey optic nerve. Invest Ophthalmol Vis Sci. 1986;27:1342–1350. [PubMed] [Google Scholar]
- 51.Garway-Heath DF, Poinoosawmy D, Fitzke FW, Hitchings RA. Mapping the visual field to the optic disc in normal tension glaucoma eyes. Ophthalmology. 2000;107:1809–1815. doi: 10.1016/s0161-6420(00)00284-0. [DOI] [PubMed] [Google Scholar]
- 52.Budenz DL, Michael A, Chang RT, et al. Sensitivity and specificity of the Stratus OCT for perimetric glaucoma. Ophthalmology. 2005;112:3–9. doi: 10.1016/j.ophtha.2004.06.039. [DOI] [PubMed] [Google Scholar]
- 53.Hidajat R, Mclay J, Burley C, et al. Influence of axial length of normal eyes on PERG. Doc Ophthalmol. 2003;107:195–200. doi: 10.1023/a:1026282425885. [DOI] [PubMed] [Google Scholar]
- 54.Snedecor GW, Cochran WG. Statistical Methods. 8th ed. Iowa State University Press; Ames, IA: 1989. Test of difference between two correlation coefficients; pp. 177–195. [Google Scholar]
- 55.Parisi V, Manni G, Gandolfi SA, et al. Visual function correlates with nerve fiber layer thickness in eyes affected by ocular hypertension. Invest Ophthalmol Vis Sci. 1999;40:1828–1833. [PubMed] [Google Scholar]
- 56.Parisi V, Manni G, Centofanti M, et al. Correlation between optical coherence tomography, pattern electroretinogram, and visual evoked potentials in open-angle glaucoma patients. Ophthalmology. 2001;108:905–912. doi: 10.1016/s0161-6420(00)00644-8. [DOI] [PubMed] [Google Scholar]
- 57.Morgan JE, Uchida H, Caprioli J. Retinal ganglion cell death in experimental glaucoma. Br J Ophthalmol. 2000;84:303–310. doi: 10.1136/bjo.84.3.303. [DOI] [PMC free article] [PubMed] [Google Scholar]
- 58.Weber AJ, Kaufman PL, Hubbard WC. Morphology of single ganglion cells in the glaucomatous primate retina. Invest Ophthalmol Vis Sci. 1998;39:2304–2320. [PubMed] [Google Scholar]
- 59.Fredrette MJ, Porciatti V, Feuer W, Anderson D. Reproducibility of the PERG in glaucomatous patients with the new PERGLA paradigm. American Academy of Ophthalmology; Chicago: 2005. Presented at the. [Google Scholar]
- 60.Ogden TE. Nerve fiber layer of the primate retina: thickness and glial content. Vision Res. 1983;23:581–587. doi: 10.1016/0042-6989(83)90063-9. [DOI] [PubMed] [Google Scholar]
- 61.Dichtl A, Jonas JB, Naumann GO. Retinal nerve fiber layer thickness in human eyes. Graefes Arch Clin Exp Ophthalmol. 1999;237:474–479. doi: 10.1007/s004170050264. [DOI] [PubMed] [Google Scholar]
- 62.Neufeld AH. Microglia in the optic nerve head and the region of parapapillary chorioretinal atrophy in glaucoma. Arch Ophthalmol. 1999;117:1050–1056. doi: 10.1001/archopht.117.8.1050. [DOI] [PubMed] [Google Scholar]
- 63.Wang L, Cioffi GA, Cull G, et al. Immunohistologic evidence for retinal glial cell changes in human glaucoma. Invest Ophthalmol Vis Sci. 2002;43:1088–1094. [PubMed] [Google Scholar]
- 64.Wang X, Tay SS, Ng YK. An immunohistochemical study of neuronal and glial cell reactions in retinae of rats with experimental glaucoma. Exp Brain Res. 2000;132:476–484. doi: 10.1007/s002210000360. [DOI] [PubMed] [Google Scholar]
- 65.Naskar R, Wissing M, Thanos S. Detection of early neuron degeneration and accompanying microglial responses in the retina of a rat model of glaucoma. Invest Ophthalmol Vis Sci. 2002;43:2962–2968. [PubMed] [Google Scholar]
- 66.Artes PH, Chauhan BC. Longitudinal changes in the visual field and optic disc in glaucoma. Prog Retin Eye Res. 2005;24:333–354. doi: 10.1016/j.preteyeres.2004.10.002. [DOI] [PubMed] [Google Scholar]
- 67.Harwerth RS, Carter-Dawson L, Smith EL, 3rd, et al. Neural losses correlated with visual losses in clinical perimetry. Invest Ophthalmol Vis Sci. 2004;45:3152–3160. doi: 10.1167/iovs.04-0227. [DOI] [PubMed] [Google Scholar]