

Abstract
Pretargeting with phosphorodiamidate morpholino oligomers (MORFs) involves a MORF-conjugated anti-tumor antibody such as MN14 as pretargeting agent administered before that of the radiolabeled complementary MORF (cMORF) as the effector. The dosages of the pretargeting agent and effector, the pretargeting interval, and the detection time are the four pretargeting variables. The goal of this study was to develop a semiempirical description capable of predicting the biodistribution of the radiolabeled effector in pretargeted mice and then compare predictions with experimental results from pretargeting studies in tumored animals in which the pretargeting interval and the detection time were both fixed but the dosages of both the effector and pretargeting agent were separately varied.
Methods
Pretargeting studies in LS174T tumored mice were performed using the anti-CEA antibody MN14 conjugated with MORF and the cMORF radiolabeled with 99mTc. A description was developed based on our previous observations in the same mouse model of the blood and tumor levels of MORF-MN14, accessibility of MORF-MN14 to labeled cMORF, the tumor accumulation of labeled cMORF relative to MORF-MN14 levels therein, and the kidney accumulation of labeled cMORF. The predicted values were then compared with the experimental values.
Results
The predicted biodistribution of the radiolabeled effector and the experimental data were in gratifying agreement in normal organs, suggesting that the description of the pretargeting process was reliable. The tumor accumulations occasionally fell outside two standard deviations of that predicted, but after tumor size correction, good agreement between prediction and experimental values was observed as well.
Conclusion
A semiempirical description of the biodistribution of labeled cMORF was capable of predicting the biodistribution of the radiolabeled effector in the pretargeted tumored mouse model, demonstrating that the underlying pretargeting concepts are correct. We believe that the approach described herein may be applied to any of the alternative pretargeting approaches and animal tumor models currently under investigation. Furthermore, appreciation of the concepts may provide a rationale for selecting dosages and timings in human pretargeting studies as an alternative to pure empirical means.
Keywords: Pretargeting, Tumor, Immunodetection, Technetium, Drug delivery
INTRODUCTION
Pretargeting is an alternative to conventional tumor targeting and is under development to improve radioactivity delivery to tumors for radioimaging and radiotherapy. Pretargeting consists of a tumor-specific pretargeting agent (usually an anti-tumor antibody) administered first and localized primarily in the tumor at a time when a radiolabeled effector is administered. Two pretargeting approaches using (strept)avidin/biotin [1] and bispecific antibody/hapten [2] have been extensively investigated with encouraging results. An alternative approach using DNAs was first proposed by Kuijpers et al [3] and is now being developed using DNA analogues. Each approach has its own advantages and disadvantages [4, 5].
The DNA analogues used herein are phosphorodiamidate morpholino oligomers (MORFs). Thus a MORF oligomer is conjugated to an antibody (in this case the MN14 anti-CEA IgG antibody) and administered to tumored mice as the pretargeting agent. At a time when the concentration of antibody in tumor is high and the concentration in normal organs is low, the radiolabeled complement (i.e. cMORF) is administered as effector. Proof-of concept of MORF pretargeting has been reported [6], the influence of MORF base sequence and chain length has been investigated [7, 8], and superior base sequences for this application have been selected [9]. Most recently, the pharmacokinetics of the MORF-MN14 pretargeting age nt and radiolabeled effector were evaluated and an attempt was made to identify the relationship of the effecter accumulation in tumor with the pretargeting variables [10].
Tumor pretargeting is complicated by the multiple variables. After the pretargeting system (i.e. tumor model, conjugated antibody and radiolabeled effector) has been selected and characterized, at least four variables remain to be adjusted: the dosage of the pretargeting agent, the pretargeting interval (time between injections of the pretargeting agent and radiolabeled effector), the dosage of effector, and the detection time (time to image or sacrifice postinjection of radiolabeled effector). Although at least one mathematical model of pretargeting has been reported, because of its complexity [11–12], a concise semiempirical description of the pretargeting process capable of predicting the biodistribution of the radiolabel is still needed. A fairly simple and intuitive semiempirical description of MORF pretargeting is now reported and demonstrated to be capable of predicting the biodistribution of radiolabeled cMORF in MORF-MN14 pretargeted tumored mice.
While any description of pretargeting in a mouse model will not be directly transferable to the clinical situation, an understanding of the underlying concepts, such as the relationship between antibody and effector dosages, may prove helpful by providing a rationale for selecting dosages in human studies. For example, in the case of radiotherapy by pretargeting, a preliminary imaging study with the antibody radiolabeled for quantitation would help select the optimum dosage of the therapeutic effector and thereby provide minimum radiation exposure to normal tissue and maximum exposure to the tumor.
In our recent studies [9, 10], the pharmacokinetics of both MORF-MN14 and labeled cMORF were quantitatively investigated. Because the same pretargeting system was used herein, the following observations from our previous investigations are relevant:
The biodistribution of the MORF-MN14 antibody is independent of dosages at least in the range of 10–100 μg. In this dosage range, blood clearance was fitted empirically to the following expression: The MORF-MN14 in blood (%ID/g) = 8.35exp[−2.06T] + 8.09exp[−0.17T] + 7.09exp[−0.03T] where T is time in h. It was also observed that the antibody is not internalized in tumor cells during this period and therefore fully accessible. Tumor accumulation of MORF-MN14 at 36–60 h was 8.70 %ID/g for tumors of about 1 g.
At least in the dosage range of 0.5–3.0 μg, 99mTc-cMORF administered alone (i.e. not in pretargeted mice) is excreted rapidly through the kidneys and does not accumulate at important levels in any other organ. The blood clearance of 99mTc-cMORF was fitted empirically to the following expression: The 99mTc-cMORF in blood (%ID/g) = 5.60exp[−0.094T] + 3.41exp[−0.026T] where T is time in min. The kidney accumulation at 3 h was 5.44 ± 1.51 %ID/g while radioactivity in other normal organs was essentially cleared at this time.
In pretargeted mice, a quantitative relationship that must be known is the “delivery efficiency” of 99mTc-cMORF to tumor. Delivery efficiency is defined as the percentage of the administered dosage of the effector that reaches the tumor whether retained or not. If the accessible MORF-MN14 in tumor is sufficient, all the 99mTc-cMORF reaching tumor will be retained by combining to the MORF-MN14. Therefore, in this case, the tumor accumulation of the effector will reach a maximum and the delivery efficiency may be easily measured as equal to the %ID/g. For a LS174T tumor of 1 g in the thigh, this value is 4.40 ± 0.74 %ID/g. The delivery efficiency will be unchanged even if the accessible MORF-MN14 is less than sufficient but, in this case, the tumor accumulation of the effe ctor will be less than the maximum since excess effector will not be retained even though it was delivered. The delivery efficiency of an effector will depend on the tumor blood supply and the residence time of effector.
The kidney accumulation of 99mTc-cMORF in MN14 pretargeted mice is independent of the antibody administration.
The accessibility of MORF-MN14 to labeled cMORF in tumor and in blood is unimpeded at 100% at all times. However, accessibility in other normal organs rapidly diminishes probably due to antibody internalization and metabolism.
The labeled cMORF in normal organs is the sum of free unbound cMORF and antibody bound cMORF. When the contribution of the former is subtracted, the organ to blood ratio of the antibody bound cMORF accumulation is found to be a constant as shown in Table 1. Therefore the blood levels of antibody bound cMORF may be directly used to predict the accumulation of antibody bound cMORF in these organs.
Table 1.
Percent accumulations (%ID/g) of 99mTc-cMORF in blood and several organs at 3 h post administration. The accumulations of free 99mTc-cMORF (i.e. not in pretargeted mice) are presented along with seven pretargeted accumulations (i.e. in mice pretargeted with MORF-MN14). Organ to blood ratios are also presented after correction for contributions of free 99mTc-cMORF and are shown to be remarkably constant over a variety of pretargeting conditions.
| Organs | Free a | Study 1 a | Study 2 a | Study 3 a | Study 4 a | Study 5 b | Study 7 b | Average |
|---|---|---|---|---|---|---|---|---|
| Blood | 0.04 | 5.44 ± 1.07 | 5.20 ± 0.48 | 3.34 ± 1.03 | 3.10 ± 0.46 | 1.27 ± 0.17 | 0.93 ± 0.08 | |
| Liver | 0.27 | 1.90 ± 0.24 | 1.93 ± 0.18 | 1.33 ± 0.11 | 1.23 ± 0.15 | 0.60 ± 0.05 | 0.54 ± 0.03 | |
| Liver/Blood | 0.30 | 0.32 | 0.32 | 0.31 | 0.27 | 0.30 | 0.31 | |
| Spleen | 0.17 | 1.09 ± 0.26 | 0.94 ± 0.22 | 0.70 ± 0.12 | 0.63 ± 0.08 | 0.33 ± 0.06 | 0.29 ± 0.05 | |
| Spleen/Blood | 0.17 | 0.15 | 0.16 | 0.15 | 0.13 | 0.13 | 0.15 | |
| Lung | 0.12 | 2.04 ± 0.42 | 1.95 ± 0.19 | 1.37 ± 0.24 | 1.20 ± 0.30 | 0.74 ± 0.16 | 0.41 ± 0.07 | |
| Lung/Blood | 0.36 | 0.35 | 0.48 | 0.35 | 0.50 | 0.33 | 0.40 | |
| Heart | 0.06 | 1.23 ± 0.18 | 1.05 ± 0.07 | 0.75 ± 0.07 | 0.71 ± 0.20 | 0.30 ± 0.07 | 0.22 ± 0.03 | |
| Heart/Blood | 0.22 | 0.19 | 0.21 | 0.21 | 0.20 | 0.18 | 0.20 | |
| Muscle | 0.03 | 0.49 ± 0.08 | 0.45 ± 0.04 | 0.42 ± 0.09 | 0.36 ± 0.04 | 0.19 ± 0.02 | 0.13 ± 0.02 | |
| Muscle/Blood | 0.09 | 0.08 | 0.12 | 0.11 | 0.13 | 0.11 | 0.11 |
In the present study, the conjugation of MN14 has been improved by increasing the average number of MORF groups per molecule (gpm) from 0.17–030 in our previous investigations [9, 10] to 1.00 using an alternative conjugation method (Hydralink™). The labeling of cMORF with 99mTc was also improved to obviate the need for post-labeling purification. With these reagents, we show that pretargeting results can be predicted using a semiempirical description.
MATERIALS AND METHODS
As before, both MORF and its complement (cMORF) were purchased with primary amines on the 3′-equivalent end and were analyzed by size exclusion HPLC and MALDI- TOF by the manufacturer (GeneTools, Philomath, OR). The base sequences and molecular weights were 5′-TCTTCTACTTCACAACTA- linker-amine, 6198 Da (MORF) and 5′-TAGTTGTGAAGTAGAAGA- linker-amine, 6331 Da (cMORF). The high affinity murine anti-CEA antibody MN14 (IgG 1 subtype, MW 160 kDa) was a gift from Immunomedics (Morris Plains, NJ). The S-acetyl NHS-MAG3 was synthesized in house [13] and the structure confirmed by elemental analysis, proton NMR and mass spectroscopy. The P4 resin (Bio-Gel P4 Gel, medium) was purchased (Bio-Rad Laboratories, Hercules, CA). All other chemicals were reagent grade and were used without purification. The 99mTc-pertechnetate was eluted from a 99Mo-99mTc generator (Perkin Elmer Life Science Inc, Boston, MA).
The MAG3-cMORF was prepared and labeled as described earlier [14]. The MORF-MN14 was synthesized using a commercial Hydralink™ method (Solulink Biosciences, San Diego, CA) [15]. The average gpm of MORF-MN14 used in this study was 1.00 ± 0.03 compared to an average gpm of only 0.17 to 0.30 when an earlier method of conjugation was used [9, 10]. A new lot of MN14 antibody was used to investigate the influence the dosage of MORF-MN14. A small difference in pharmacokinetics was observed with this new lot and was taken into account as described below.
Tumor model
Swiss NIH nude mice (Taconic Farms, Germantown, NY) were administered 106 LS174T colon cancer cells intramuscularly in the left thigh. The animals were used when tumors reached a convenient size (0.75–1.5 g) about 12 d later. Two days after IV administration of MORF-MN14, radiolabeled cMORF was administered IV and 3 h later the mice were killed by exsanguination following heart puncture under halothane anesthesia. Tissues were harvested, weighed, and counted in a NaI(Tl) well counter (Cobra II automatic gamma counter, Packard Instrument Company, CT) along with a standard of the injectate. Blood and muscle were assumed to constitute 7% and 40% of body weight respectively. The tumored thigh was also excised for counting but the skin and as much as possible the muscle and bone were removed. The radioactivity was attributed to tumor because radioactivity in the bone and muscle were found to be negligible. After the tumor thigh was counted, the soft tumor was dissected away. The remaining bone and muscle were weighed and this weight was subtracted to provide the net tumor weight for the calculation of radioactivity accumulation per gram of tumor. Radioactivity remaining in the carcass was measured in a dose calibrator. Summation of radioactivity in all organs sampled and in the remaining carcass was taken as the whole body radioactivity. All animal studies were performed with the approval of the UMMS Institutional Animal Care and Use Committee.
Timing
Pretargeting interval
Earlier experience indicated that a pretargeting interval of 2 d was reasonable [10].
Sacrifice and/or imaging time
Since excess free labeled cMORF will continue to clear, the longer the int erval between the 99mTc-cMORF administration and sacrifice/imaging, the lower will be the radioactive background in normal tissues. However, since the level of free 99mTc-cMORF in blood was previously found to be essentially negligible at 3 h post administration at less than 0.05 %ID/g [9], this interval was again selected.
Dosage of labeled cMORF
Since no difference was observed previously in the pharmacokinetics of MORF-MN14 administered IV in the range 10–100 μg, the influence of 99mTc-cMORF dosage was investigated in tumored mice receiving a convenient 30 μg dosage of MORF-MN14.
As mentioned, the accessibility of MORF-MN14 in tumor to radiolabeled cMORF is 100%, 8.70 %ID/g of MORF-MN14 will accumulate in a 1 g tumor and 4.40 %ID/g of labeled cMORF will be delivered and retained in a tumor of this size. The dosage of labeled cMORF that just saturate the MORF-MN14 in a 1.0 g tumor pretargeted 2 d earlier with 30 μg of MORF-MN14 (1.00 gpm) can be calculated as 2.35 μg by the following equation:
where McMORF and Mantibody are the molecular weights of cMORF and MORF-MN14 respectively
The tumor size in this phase of the study was about 1.0 g. A dosage range of labeled cMORF of 0.89–2.28 μg was used and therefore was just below the saturation dosage of 2.35 μg. In addition to the 30 μg of MORF-MN14, other fixed pretargeting variables were the 2 d of pretargeting interval and the 3 h of sacrifice time. Thus, 2 d after MORF-MN14 injection, 1.48 MBq (40 μCi) of 99mTc-cMORF adjusted to the proper dosage with unlabeled cMORF was injected intravenously. All mice were killed 3 h later and biodistributions were performed as described above.
Predictions
Basic relationships from the previous studies can be used to develop the semiempirical description. In the following analysis, Ptissue is the percent accumulation per gram of tissue (%ID/g), and d is the dosage (μg) of administered cMORF. Agreement with theoretical predictions will be assumed if the experimental values obtained fall within two standard deviations of the predicted result (i.e. 96% probability level).
Tumor
As described above and previously [10], the percent accumulation of labeled cMORF in a 1 g tumor will be 4.40 ± 0.74 %ID/g (mean ± SD) and will be constant with the dosage of cMORF, provided that this dosage does not exceed that required to saturate the MORF-MN14 therein (i.e. 2.35 μg). Since the dosages of cMORF were below that required for tumor saturation in this phase of the study, the predicted values of its tumor accumulation with 2 SD are given by: Ptumor (% ID/g) = 4.40 ± (2 × 0.74). Dosages of cMORF above tumor saturation are not considered in this analysis. Furthermore, the influence of the “free” labeled cMORF accumulated nonspecifically in tumor is 0.12 %ID/g and may be ignored.
Blood
As described above and previously [10], the accessibility of MORF-MN14 to labeled cMORF in blood is 100%. The blood level of MORF-MN14 at 2 d is 2.20 %ID/g (by the expression 8.35exp[−2.06T] + 8.09exp[−0.17T] + 7.09exp[−0.03T]). The 2.20 %ID/g can be used together with the gpm value of 1.00 and the antibody dosage of 30 μg to calculate the blood level of labeled cMORF bound to the circulating MORF-MN14. Thus Pblood (%ID/g) = [2.20 ×30 × 1.00 × (MMORF /MAntibody)]/d = 2.61/ d. Previous experience of this laboratory indicates that the standard deviation of labeled cMORF in blood can be as large as 25% [10]. As shown in Table 1, the blood background of free unbound labeled cMORF previously obtained in control studies at 3 h is 0.04 %ID/g [9]. Taking 25% as the standard deviation, the predicted blood levels of labeled cMORF are therefore given by:
Kidney
Labeled cMORF is exclusively cleared through the kidney. As mentioned above, our previous studies have shown that the kidney accumulation of cMORF is independent of the administration of MORF-MN14 [9, 10]. At 3 h post administration of labeled cMORF, its average kidney accumulation was 5.44 ±1.51 %ID/g (n=20) and the predicted kidney levels are given by:
Liver, spleen, lung, heart, and muscle
As mentioned and shown in Table 1, when corrected for the free labeled cMORF, the ratios of labeled cMORF accumulation in these organs to that of blood is a constant. Accordingly, levels of cMORF in these organs may be calculated from that in blood.
The largest standard deviations in the accumulations of labeled cMORF observed in liver is 15% while those in spleen, lung, heart, and muscle are approximately 25% [9, 10]. Again using 2.61/d %ID/g as the blood level of bound labeled cMORF, the percent accumulation in a normal organ is: 2.61/d × the organ/blood ratio of labeled cMORF from Table 1 plus the nonspecific accumulation. For example in liver, accumulation of free labeled cMORF is 0.27 %ID/g. The prediction of percent liver accumulation is therefore the percent blood level of 2.61/d %ID/g multiplied by the liver to blood ratio of 0.31 plus 0.27 %ID/g. Therefore, the levels of labeled cMORF in normal organs with 2 SD are given by:
Dosage of MORF-MN14
Each animal received from 4 to 40 μg of MORF-MN14 IV followed 2 d later with 1.61 μg (100 μCi) of 99mTc-cMORF IV and was killed 3 h later under halothane anesthesia and biodistributions were performed as described above. Tumor size was 0.53 ± 0.11 g.
Since no difference was observed previously in the pharmacokinetics of MORF-MN14 administered IV in the range 10–100 μg, a convenient and practical range of 4–40 μg for the dosage of MORF-MN14 was selected for this phase of the investigation. It was calculated above that the administration of 2.35 μg of labeled cMORF will saturate tumor levels of MORF-MN14 when 30 μg MORF-MN14 was administered, therefore the cMORF dosage of 1.61 μg used in this phase of the investigation must be well below the dosage needed to saturate the MORF-MN14 in tumor at the highest 40 μg dosage, but this dosage of 1.61 μg labeled cMORF will saturate the MORF-MN14 in tumor at some of the lower dosages of MORF-MN14. While tumor size in the first phase of this investigation concerning cMORF dosage was about 1.0 g, the tumor size used in this second phase concerning MORF-MN14 dosage was approximately 0.5 g. One additional difference was the use of a different lot of MN14. Determined in preliminary tracer studies with the 111In- labeled antibody (data not presented), the blood level at 2 d was 3.45 ± 0.58 %ID/g, slightly higher compared to the value of 2.20 %ID/g observed earlier.
Predictions
Tumor
In a preliminary tracer studies with the 111In-labeled antibody, it was determined that the tumor accumulation of MN14 at 2 d in this phase of this study was 17.5 %ID/g for tumors averaging 0.53 g (data not presented). As before, the percent tumor accumulation of MN14 in this animal model is constant at least within the dosage range of 10–100 μg.
As shown below, the delivery efficiency was measured for different size tumors in the mouse model. The empirical linear correlation between the delivery efficiency of labeled cMORF and tumor size is described by: delivery efficiency (%ID/g) = −3.43 × tumor size (g) + 8.54. Based on this linear relationship, it may be estimated that the delivery efficiency of labeled cMORF (i.e. the maximum percent tumor accumulation) in this study was 6.72 %ID/g for tumor at size of 0.53 g.
It is possible to work backwards from this value of 6.72 %ID/g for labeled cMORF to calculate the dosage of antibody that must be administered to accumulate in tumor just to be saturated by the 6.72 %ID/g of labeled cMORF, given that the percentage of antibody localizing in tumor is 17.5 %ID/g as measured above for a 0.53 g tumor and the delivery of labeled cMORF is independent of MORF-MN14 dosage. Thus the 6.72 % of the 1.61 μg of 99mTc-cMORF delivered per gram of tumor will just saturate the MORF-MN14 therein when the antibody is administered at a 15.2 μg dosage, given by:
where 1.00 is the average gpm, Mantibody and McMORF are the molecular weights of cMORF and MN14 respectively, and 6.72 %ID/g and 17.5 %ID/g are the delivery efficiency of labeled cMORF and the tumor accumulation of MN14 respectively.
Above 15.2 μg MORF-MN14, sufficient antibody has accumulated in tumor to retain the 6.72 %ID/g of labeled cMORF. Therefore the percent cMORF accumulation with 2 SD is given by:
where Ptumor (% ID/g) is the percent accumulation of labeled cMORF in tumor and 0.34 is twice the standard deviation of 17 % (calculated from 4.40 ± 0.74 %ID/g).
Below 15.2 μg, the MORF-MN14 in tumor will be saturated by the 1.61 μg of labeled cMORF administered, but, since the labeled cMORF delivered to tumor will be in excess, a fraction of the 6.72%ID/g will wash out. The percent tumor accumulation of 99mTc-cMORF will then be less than the maximum and will be given by:
where D is the dosage of MORF-MN14.
Therefore under these circumstances:
Blood
As mentioned earlier, the blood level of MORF-MN14 in this phase of the investigation was 3.45 ± 0.58 %ID/g at 2 d. Following administration of 1.61 μg of 99mTc-cMORF, the percent accumulation of labeled cMORF in blood may be predicted by calculating saturation of MORF-MN14 in circulation:
After 2 times the standard deviation of 25% is taken into account:
Kidney
Kidney accumulation is independent of the antibody administration and therefore the prediction remains the same as before:
Liver, spleen, lung, heart, and muscle
As before, the cMORF accumulations in these organs can be predicted by multiplying the blood level by the organ to blood ratios, adding the free labeled cMORF and taking into account the standard deviations of 15% for liver and 25% for all other tissues:
RESULTS
Predictions under varying dosage of labeled cMORF
Biodistributions of the 99mTc-cMORF in mice pretargeted with MORF-MN14 are provided in Table 2. The percent accumulations of 99mTc-cMORF in tumor, blood, kidneys, liver, lung, heart, spleen, and muscle are reproduced in Figure 1. The bold lines show the predicted values and each is bracketed with thinner lines showing the limits of two standard deviations from the prediction line. It may be seen that radioactivity accumulations in all normal organs fall well within the range of the predicted values. The scatter is mainly due to animal to animal variations.
Table 2.
Biodistribution (%ID/g or %ID) of 99mTc-cMORF in individual tumored mice receiving 30 μg MORF-MN14 followed at 2 d by injection of different dosages of 99mTc-cMORF and then sacrificed at 3 h thereafter.
| %ID/g | %ID | ||||||||||||
|---|---|---|---|---|---|---|---|---|---|---|---|---|---|
| Mouse No. | 99m Tc-cMORF Dosage (μg) | Tumor size (g) | Tumor | Blood | Kidney | Liver | Spleen | Lung | Heart | Muscle | Stomach | Sm. Int. | Lg. Int. |
| 1 | 0.89 | 1.07 | 5.80 | 2.13 | 5.96 | 1.09 | 0.56 | 0.68 | 0.49 | 0.24 | 0.44 | 0.87 | 1.92 |
| 2 | 0.96 | 0.63 | 7.38 | 2.86 | 4.58 | 1.21 | 0.71 | 0.91 | 0.64 | 0.22 | 0.29 | 0.62 | 1.74 |
| 3 | 0.97 | 1.19 | 4.82 | 1.90 | 4.06 | 0.84 | 0.47 | 0.67 | 0.41 | 0.18 | 0.25 | 1.35 | 1.95 |
| 4 | 0.98 | 0.74 | 6.51 | 3.11 | 5.70 | 1.30 | 0.56 | 0.89 | 0.81 | 0.53 | 0.26 | 1.08 | 6.48 |
| 5 | 0.99 | 0.79 | 6.77 | 2.68 | 4.62 | 1.28 | 0.63 | 0.97 | 0.49 | 0.27 | 3.58 | 5.87 | 1.36 |
| 6 | 1.02 | 0.33 | 8.57 | 3.03 | 4.32 | 1.32 | 0.74 | 0.97 | 0.71 | 0.30 | 0.30 | 0.60 | 1.31 |
| 7 | 1.06 | 0.78 | 5.51 | 2.49 | 5.37 | 1.14 | 0.63 | 0.89 | 0.49 | 0.31 | 0.34 | 1.20 | 0.61 |
| 8 | 1.11 | 1.07 | 5.98 | 1.65 | 4.40 | 0.92 | 0.45 | 0.58 | 0.38 | 0.18 | 0.21 | 0.58 | 1.42 |
| 9 | 1.23 | 0.84 | 5.70 | 1.81 | 4.90 | 0.87 | 0.53 | 0.57 | 0.46 | 0.26 | 0.25 | 0.35 | 1.52 |
| 10 | 1.31 | 1.19 | 3.92 | 1.57 | 4.98 | 0.83 | 0.50 | 0.56 | 0.42 | 0.15 | 0.28 | 0.40 | 1.35 |
| 11 | 1.38 | 0.74 | 6.93 | 2.26 | 4.12 | 1.04 | 0.59 | 0.84 | 0.59 | 0.18 | 0.26 | 0.37 | 1.59 |
| 12 | 1.49 | 0.92 | 3.88 | 1.79 | 3.93 | 0.91 | 0.42 | 0.75 | 0.48 | 0.19 | 0.26 | 0.42 | 1.57 |
| 13 | 1.76 | 1.51 | 3.79 | 0.94 | 5.13 | 0.64 | 0.25 | 0.33 | 0.19 | 0.12 | 0.17 | 0.37 | 1.75 |
| 14 | 1.80 | 1.62 | 3.01 | 0.71 | 4.66 | 0.53 | 0.24 | 0.24 | 0.13 | 0.19 | 0.63 | 1.14 | 1.84 |
| 15 | 1.89 | 0.65 | 5.95 | 1.77 | 5.25 | 1.00 | 0.48 | 0.72 | 0.43 | 0.18 | 0.34 | 0.59 | 1.09 |
| 16 | 1.97 | 0.98 | 4.29 | 1.16 | 3.53 | 0.80 | 0.36 | 0.46 | 0.23 | 0.19 | 0.26 | 0.46 | 1.41 |
| 17 | 2.05 | 0.74 | 4.66 | 1.35 | 5.21 | 0.67 | 0.33 | 0.45 | 0.29 | 0.16 | 0.28 | 0.47 | 1.62 |
| 18 | 2.07 | 0.51 | 5.70 | 1.64 | 3.83 | 0.89 | 0.39 | 0.54 | 0.29 | 0.28 | 0.35 | 0.71 | 1.25 |
| 19 | 2.26 | 0.40 | 7.00 | 1.85 | 3.84 | 0.91 | 0.44 | 0.69 | 0.44 | 0.57 | 0.81 | 0.69 | 1.51 |
| 20 | 2.28 | 0.95 | 4.08 | 1.17 | 3.88 | 0.69 | 0.33 | 0.42 | 0.21 | 0.14 | 0.36 | 0.56 | 1.16 |
Fig 1.
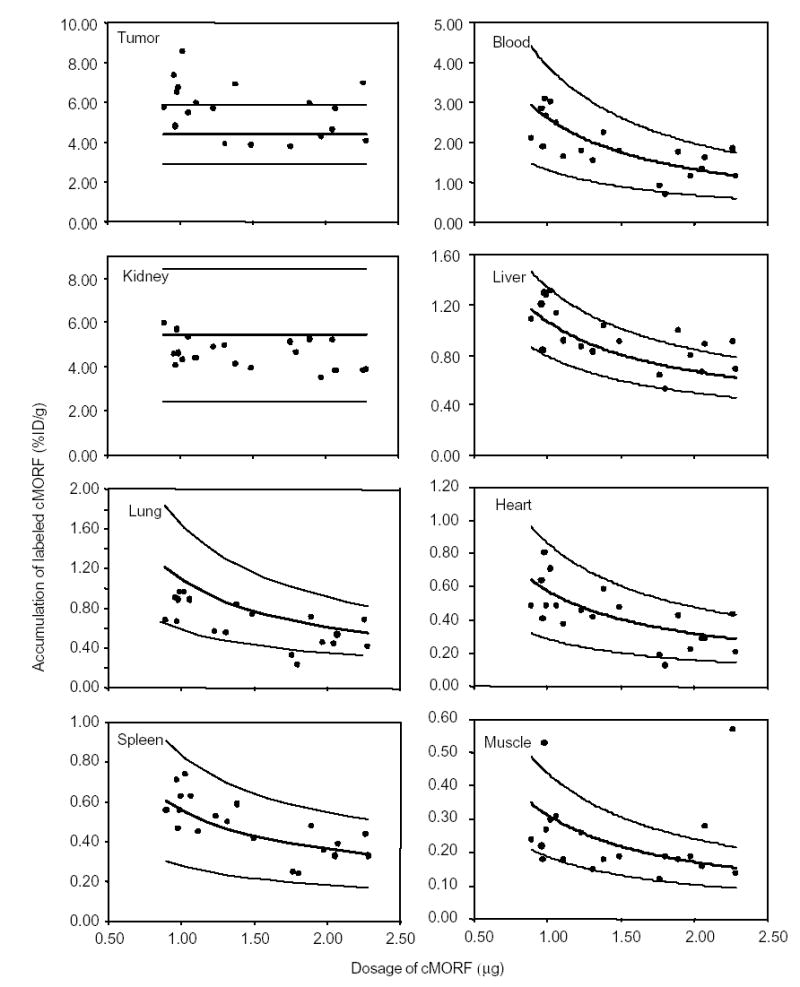
The radioactivity accumulations of 99mTc-cMORF in % ID/g in tumor and normal organs vs. 99mTc-cMORF dosage at 3 h in tumored mice pretargeted 2 d earlier with 30 μg MORF-MN14. The solid lines show the predicted values and are bracketed in each case with thinner lines showing the limits of two standard deviations from the prediction line.
The largest variation is found in tumor accumulation and may be attributed to variances in tumor size. The predicted value of 4.40 ± 0.74 %ID/g for labeled cMORF was obtained from a study of four mice bearing tumors with an average size of 1.09 ± 0.13 g (0.98–1.27 g) [10]. Herein, the average tumor size was 0.88 ± 0.33 g (from 0.33 to 1.70 g). Figure 2A presents values of % ID/g vs. tumor size. The solid line in the figure is the result of a linear regression fit given by %ID/g = −3.43 × tumor size (g) + 8.54. The curve clearly shows that the percent tumor accumulation decreases with increasing tumor size. Figure 2B shows that scatter seen in the previous figure for tumor accumulations is greatly reduced when the tumor accumulations are corrected to values at a tumor size of 1.09 g by using the expression: corrected tumor accumulation = original tumor accumulation + 3.43 × (original tumor size − 1.09).
Fig 2.
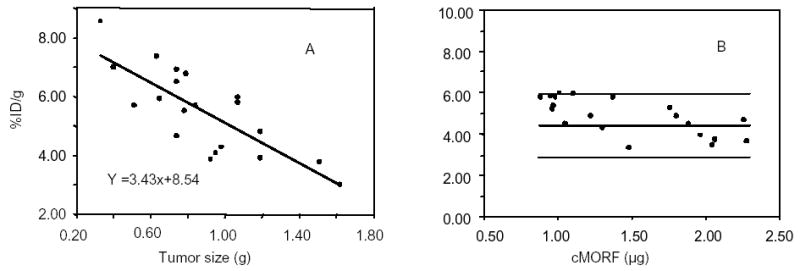
Tumor accumulations of 99mTc-cMORF vs. tumor size showing a decreasing percent tumor accumulation with increasing tumor size with the solid line representing the linear regression fit (panel A). Also presented is corrected accumulation of 99mTc-cMORF vs. 99mTc-cMORF dosage (panel B) showing reduced scatter after correction for tumor size by comparison to Figure 1.
Predictions under varying dosage of MORF-MN14
Table 3 lists the dosage, tumor size, and the biodistribution of 99mTc-cMORF individually for each animal. Figure 3 reproduces the percent experimental accumulation levels of 99mTc-cMORF in tumor and each normal tissue as a function of MORF-MN14 dosage. In each case, a bold line represents the predicted values while two additional bracketing lines define the ± 2 SD range. As is evident, the experimental data points for each organ fall within the predicted range providing gratifying agreement between experimental results and predications.
Table 3.
Biodistribution (%ID/g or %ID) at 3 h following administration of 1.61 μg 99mTc-cMORF in individual tumored mice receiving variable dosages of MORF-MN14 2 d earlier.
| %ID/g | %ID | ||||||||||||
|---|---|---|---|---|---|---|---|---|---|---|---|---|---|
| Mouse No | MORF-MN14 Dosage (μg) | Tumor size (g) | Tumor | Blood | Kidney | Liver | Spleen | Lung | Heart | Muscle | Stomach | Sm. Int. | Lg. Int. |
| 1 | 4.28 | 0.45 | 1.60 | 0.45 | 3.03 | 0.31 | 0.18 | 0.24 | 0.11 | 0.06 | 0.17 | 0.54 | 1.64 |
| 2 | 5.72 | 0.52 | 1.69 | 0.48 | 4.43 | 0.40 | 0.19 | 0.27 | 0.18 | 0.08 | 0.12 | 0.18 | 1.10 |
| 3 | 7.02 | 0.56 | 2.45 | 0.65 | 3.69 | 0.37 | 0.22 | 0.30 | 0.21 | 0.11 | 0.12 | 0.18 | 1.33 |
| 4 | 8.96 | 0.45 | 2.62 | 0.92 | 3.77 | 0.53 | 0.26 | 0.37 | 0.27 | 0.12 | 0.13 | 0.24 | 1.54 |
| 5 | 9.97 | 0.59 | 3.14 | 1.00 | 3.23 | 0.56 | 0.31 | 0.39 | 0.24 | 0.13 | 0.23 | 0.31 | 1.25 |
| 6 | 11.84 | 0.49 | 4.24 | 1.10 | 2.69 | 0.59 | 0.33 | 0.43 | 0.28 | 0.12 | 0.11 | 0.28 | 1.22 |
| 7 | 13.03 | 0.51 | 3.86 | 1.13 | 3.62 | 0.51 | 0.31 | 0.46 | 0.26 | 0.15 | 0.14 | 0.23 | 1.39 |
| 8 | 15.44 | 0.56 | 4.38 | 1.53 | 3.24 | 0.86 | 0.40 | 0.53 | 0.39 | 0.19 | 0.18 | 0.32 | 1.36 |
| 9 | 17.53 | 0.48 | 4.36 | 1.47 | 3.83 | 0.67 | 0.37 | 0.53 | 0.38 | 0.24 | 0.13 | 0.33 | 1.20 |
| 10 | 18.43 | 0.52 | 5.31 | 2.00 | 4.07 | 0.93 | 0.55 | 0.74 | 0.59 | 0.25 | 0.23 | 0.50 | 1.52 |
| 11 | 21.06 | 0.61 | 4.94 | 1.94 | 2.83 | 0.81 | 0.43 | 0.78 | 0.54 | 0.21 | 0.17 | 0.30 | 1.29 |
| 12 | 22.18 | 0.29 | 7.78 | 2.86 | 3.96 | 1.09 | 0.64 | 1.01 | 0.65 | 0.29 | 0.30 | 0.65 | 1.74 |
| 13 | 24.88 | 0.52 | 5.65 | 2.83 | 3.04 | 1.20 | 0.70 | 1.34 | 0.68 | 0.26 | 0.98 | 1.56 | 1.42 |
| 14 | 27.68 | 0.46 | 6.43 | 2.85 | 3.37 | 1.10 | 0.72 | 1.17 | 0.65 | 0.26 | 0.30 | 0.39 | 1.54 |
| 15 | 29.02 | 0.71 | 5.95 | 2.44 | 3.66 | 1.02 | 0.64 | 0.93 | 0.70 | 0.24 | 0.22 | 0.40 | 1.32 |
| 16 | 30.42 | 0.56 | 6.29 | 2.73 | 3.46 | 1.18 | 0.60 | 1.26 | 0.56 | 0.30 | 0.18 | 0.50 | 1.84 |
| 17 | 32.33 | 0.55 | 6.60 | 3.37 | 3.96 | 1.44 | 0.80 | 1.36 | 0.83 | 0.34 | 0.50 | 0.60 | 1.14 |
| 18 | 36.90 | 0.78 | 5.41 | 3.15 | 3.28 | 1.21 | 0.74 | 1.11 | 0.86 | 0.60 | 0.17 | 0.34 | 1.24 |
Fig 3.
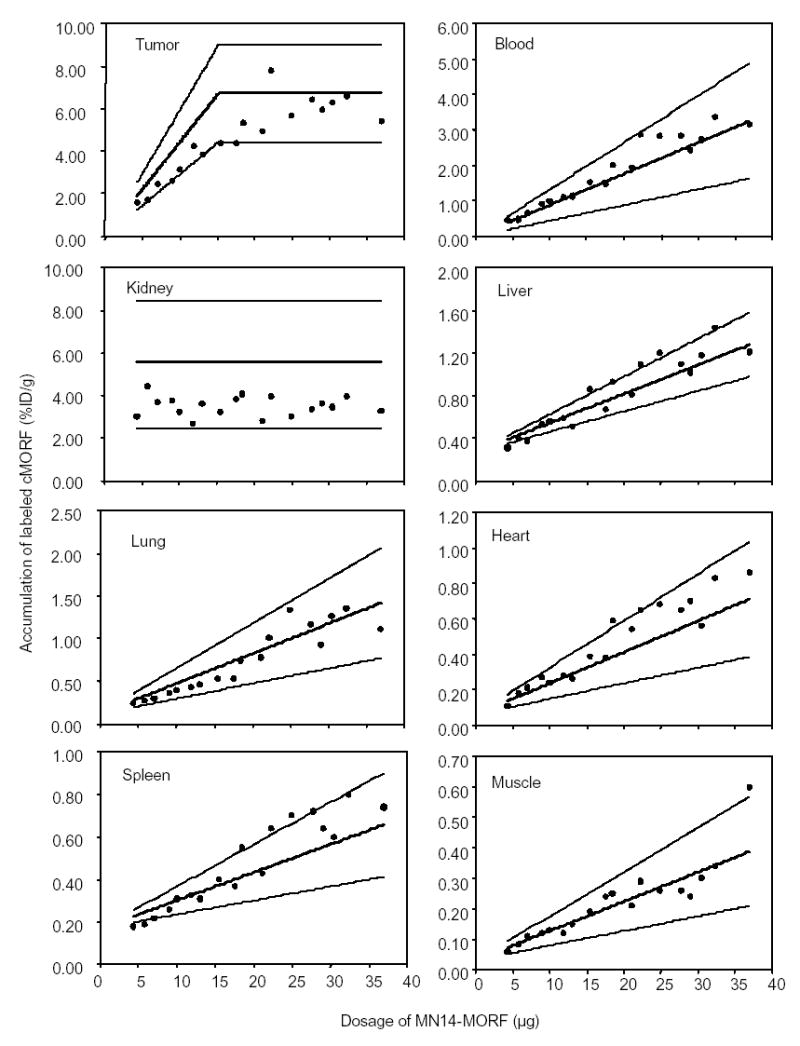
The radioactivity accumulations of 99mTc-cMORF in % ID/g in tumor and normal organs vs. dosage of MORF-MN14 at 3 h post administration of 1.61 μg of 99mTc-cMORF in tumored mice pretargeted 2 d earlier. The solid lines show the predicted values and are bracketed in each case with thinner lines showing the limits of two standard deviations from the prediction line.
DISCUSSION
An obvious disadvantage of pretargeting over conventional targeting is the need for multiple injections and, usually, a lower percentage of radioactivity localized in tumor since the low molecular weight effector clears rapidly from the circulation and whole body as intended. However the advantages offered by pretargeting are improvements in tumor to normal tissue ratios such that the same tumor to blood ratio requiring days by conventional imaging can be achieved in hours with pretargeting. When used with therapeutic radionuclides, this property will greatly reduce subject radiation exposure. An additional advantage of MORF pretargeting is the loss of MORF expression in normal tissues leading to improved tumor to tissue ratios over conventional targeting (except blood and possibly kidney). A comparison of the results obtained in this investigation by pretargeting and the results of 111In-MN14 by conventional targeting from our earlier investigation in the same mouse model [10] is listed in Table 4. Even in kidneys, the only normal tissue with prominent accumulation of labeled cMORF, the accumulation at 3 h (5.44 ± 1.51 %ID/g) is still lower than that of 111In labeled MN14 at 2 d (11.7 %ID/g) [10]. The tumor to kidney ratio is superior for pretargeting as well.
Table 4.
Comparison of tumor to tissue ratios between conventional targeting and pretargeting
| Organ | Conventional a | Pretargeting b |
|---|---|---|
| Blood | 3.8 ± 1.4 | 3.0 ± 0.7 |
| Liver | 0.5 ± 0.2 | 5.1 ± 0.7 |
| Heart | 8.7 ± 2.9 | 14 ± 6 |
| Lung | 4.7 ± 1.2 | 7.8 ± 2.1 |
| Spleen | 1.2 ± 0.4 | 10 ± 2 |
| Muscle | 18 ± 5 | 25 ± 4 |
| Kidney | 0.7 ± 0.3 | 1.0 ± 0.2 |
. Calculated from the biodistribution data at 2 d in mice receiving 30 μg 111In-MN14 (10). Tumor size: 1.00 ± 0.25 g. (N = 4).
. Calculated from the biodistribution data in mice selected for similar tumor size (1.01 ± 0.12 g) (Mouse No. 10, 12, 16 and 20 in Table 2) also receiving 30 μg MORF-MN14 and also a 2 d pretargeting interval.
The agreement between predicted and experimental results for the accumulation of labeled cMORF in tumor and other organs demonstrates that certain assumptions and conclusion are valid. Secondly, an earlier conclusion that MORF-MN14 in tumor and blood is quantitatively accessible to labeled cMORF has been now reinforced [10]. Finally, an earlier assumption that MORF-MN14 is largely sequestered in liver, spleen and inaccessible to labeled cMORF [7, 10] has been supported by the results of this study.
A comparison of the previous results [10] using MORF-MN14 with an average of 0.17–0.30 gpm to the results in this study with an average of 1.00 gpm confirms that higher gpm can improve the absolute tumor accumulation but not the percent tumor accumulation just as predicted by the semiempirical description. However, a higher level of conjugation at the same dosage of MORF-antibody will permit the administration of a higher dosage of labeled cMORF. Because it has not been difficult to radiolabeled cMORF at high specific activity, this advantage of a higher level of antibody conjugation may ultimately be more important in radiotherapy applications of pretargeting since, for example, it is more difficult to reach a required specific activity of labeled cMORF with rhenium-188.
We had earlier performed a pretargeting study with a varying pretargeting interval and had examined the agreement between the experimental and predicted blood levels (10). It is now possible to apply the semiempirical description to the biodistribution data in several normal organs from that investigation. As reported, blood predictions after correction of free labeled cMORF are 1.30 %ID/g at 2 d, 0.69 %ID/g at 3 d and 0.36 %ID/g at 4 d. Therefore, equations for prediction are similarly obtained from these blood levels.
As shown in Table 5, the predicted accumulations of 99mTc-cMORF in normal organs at different intervals are also in agreement with experimental values.
Table 5.
The experimental values for 99mTc-cMORF accumulation in normal organs as a function of the pretargeting interval based on experimental results obtained earlier (10) compared with predicted values (Mean ± 2SDs.
| 2d | 3d | 4d | ||||
|---|---|---|---|---|---|---|
| Normal organ | Experimental | Predicted | Experimental | Predicted | Experimental | Predicted |
| Liver | 0.60 ± 0.10 | 0.67 ± 0.20 | 0.54 ± 0.06 | 0.48 ± 0.14 | 0.37 ± 0.04 | 0.38 ±0.12 |
| Heart | 0.30 ± 0.14 | 0.37 ± 0.18 | 0.22 ± 0.06 | 0.27 ± 0.14 | 0.14 ± 0.04 | 0.22 ± 0.12 |
| Kidney | 4.96 ± 2.78 | 5.44 ± 3.02 | 5.28 ± 0.70 | 5.44 ± 3.02 | 4.87 ± 1.72 | 5.44 ± 3.02 |
| Lung | 0.74 ± 0.32 | 0.64 ± 0.32 | 0.41 ± 0.14 | 040 ± 0.20 | 0.37 ± 0.18 | 0.26 ± 0.14 |
| Spleen | 0.33 ± 0.12 | 0.32 ± 0.16 | 0.29 ± 0.10 | 0.20 ± 0.10 | 0.22 ± 0.08 | 0.13 ± 0.06 |
| Muscle | 0.19 ± 0.04 | 0.17 ± 0.08 | 0.13 ± 0.04 | 0.11 ± 0.06 | 0.09 ± 0.02 | 0.07 ± 0.04 |
| Blood | 1.27 ± 0.17 | 1.38 ± 0.69 | 0.93 ± 0.08 | 0.77 ± 0.38 | 0.58 ± 0.13 | 0.44 ± 0.22 |
Thus among the four pretargeting variables (dosages of pretargeting agent and labeled effector, pretargeting interval and detection time), only the detection time has not yet been subjected to prediction. As yet we do not have a quantitative model to predict the influence on biodistribution of detection time. However, the detection time has relevance only to diagnostic but not to radiotherapeutic applications of pretargeting.
CONCLUSION
A fairly simple and intuitive semiempirical description of MORF pretargeting has been developed that is capable of predicting accurately the accumulations of 99mTc-cMORF in tumor and normal tissues of mice pretargeted by MORF-MN14, demonstrating that the underlying pretargeting concepts are correct. Appreciation of these concepts may provide a rationale for selecting dosages in human pretargeting studies as an alternative to empirical means.
Acknowledgments
The authors are grateful to Dr. Gary L Griffiths of Immunomedics (Morris Plains, NJ.) for providing the MN14. Financial support for this investigation was provided in part by the National Institutes of Health (CA107360).
Footnotes
Financial support: (CA107360).
References
- 1.Hnatowich DJ, Virzi F, Rusckowski M. Investigations of avidin and biotin for imaging applications. J Nucl Med. 1987;28:1294–1302. [PubMed] [Google Scholar]
- 2.Goodwin DA, Meares CF, McTigue M, et al. Rapid localization of haptens in sites containing previously administrated antibody for immunoscintigraphy with short half- life tracers [abstract] J Nucl Med. 1986;27(suppl):959. [Google Scholar]
- 3.Kuijpers WH, Bos ES, Kaspersen FM, Veeneman GH, van Boeckel CA. Specific recognition of antibody-oligonucleotide conjugates by radiolabeled antisense nucleotides: a novel approach for two-step radioimmunotherapy of cancer. Bioconj Chem. 1993;4(1):94–102. doi: 10.1021/bc00019a013. [DOI] [PubMed] [Google Scholar]
- 4.Goldenberg DM, Chang CH, Sharkey RM, Rossi EA, Karacay H, McBride W, et al. Radioimmunotherapy: is avidin-biotin pretargeting the preferred choice among pretargeting methods? Eur J Nucl Med Mol Imaging. 2003;30:777–780. doi: 10.1007/s00259-002-1089-6. [DOI] [PubMed] [Google Scholar]
- 5.Paganelli G, Chinol M. Radioimmunotherapy: is avidin-biotin pretargeting the preferred choice among pretargeting methods? Eur J Nucl Med Mol Imaging. 2003;30:773–776. doi: 10.1007/s00259-002-1090-0. [DOI] [PubMed] [Google Scholar]
- 6.Liu G, Mang’era K, Liu N, Gupta S, Rusckowski M, Hnatowich DJ. Tumor pretargeting in mice using 99mTc-labeled morpholino, a DNA analog. J Nucl Med. 2002;43:384–391. [PubMed] [Google Scholar]
- 7.Liu G, Zhang S, He J, Liu N, Gupta S, Rusckowski M, et al. The influence of chain length and base sequence on the pharmacokinetic behavior of 99mTc-Morpholinos in mice. Quarterly J Nucl Med. 2002;46:233–243. [PubMed] [Google Scholar]
- 8.Liu G, He J, Zhang S, Liu C, Rusckowski M, Hnatowich DJ. Cytosine residues influence kidney accumulations of 99mTc-labeled morpholino oligomers. Antisense Nucleic Acid Drug Dev. 2002;12:393–398. doi: 10.1089/108729002321082465. [DOI] [PubMed] [Google Scholar]
- 9.Liu G, He J, Dou S, Gupta S, Vanderheyden J-L, Rusckowski M, et al. Pretargeting in tumored mice with radiolabeled morpholino oligomer showing low kidney uptake. Eur J Nucl Med Mol Imaging. 2004;31:417–424. doi: 10.1007/s00259-003-1393-9. [DOI] [PubMed] [Google Scholar]
- 10.Liu G, He J, Dou S, Gupta S, Rusckowski M, Hnatowich DJ. Further investigations of morpholino pretargeting in mice - establishing quantitative relations in tumor. Eur J Nucl Med Mol Imaging. 2005;32:1115–1123. doi: 10.1007/s00259-005-1853-5. [DOI] [PMC free article] [PubMed] [Google Scholar]
- 11.Yuan F, Baxter LT, Jain RK. Pharmacokinetic analysis of two-step approaches using bifunctional and enzyme-conjugated antibodies. Cancer Res. 1991;51:3119–3130. [PubMed] [Google Scholar]
- 12.Sung C, van Osdol WW. Pharmacokinetic comparison of direct antibody targeting with pretargeting protocols based on streptavidin-biotin binding. J Nucl Med. 1995;36:867–876. [PubMed] [Google Scholar]
- 13.Winnard P, Jr, Chang F, Rusckowski M, Mardirossian G, Hnatowich DJ. Preparation and use of NHS-MAG3 for technetium-99m labeling of DNA. Nucl Med Biol. 1997;24:425–432. doi: 10.1016/s0969-8051(97)00027-9. [DOI] [PubMed] [Google Scholar]
- 14.Liu G, Dou S, He J, Yin D, Gupta S, Zhang S, Wang Y, Rusckowski M, Hnatowich DJ. Radiolabeling of MAG3-Morpholino Oligomers with 188Re at High Labeling Efficiency and Specific Radioactivity for tumor pretargeting. Appl Radiat Isot. 2006 doi: 10.1016/j.apradiso.2006.04.005. in press. [DOI] [PMC free article] [PubMed] [Google Scholar]
- 15.He J, Liu G, Dou S, Gupta S, Rusckowski M, Hnatowich DJ. An improved method for covalently conjugating morpholino oligomers to antitumor antibodies (abstract) J Nucl Med. 2005;46:350P. doi: 10.1021/bc060208v. [DOI] [PMC free article] [PubMed] [Google Scholar]