

Abstract
Bone degradation by osteoclasts depends upon active transport of hydrogen ions to solubilize bone mineral. This transport is supported by the parallel actions of a proton ATPase and a chloride channel located in the osteoclast ruffled membrane. We have previously identified a novel chloride channel, p62, which appears to be the avian counterpart to CLIC-5b and is expressed coincident with the appearance of acid secretion as avian osteoclasts differentiate in culture. In this article, we show that suppression of CLIC-5b in differentiating avian osteoclasts results in decreased acidification by vesicles derived from these cells and decreased ability of the cells to resorb bone. Acidification is rescued by the presence of valinomycin, consistent with a selective loss of chloride channel but not proton pump activity. Osteoclast bone resorption is known to be dependent on the expression of the tyrosine kinase, c-Src. We show that CLIC-5b from osteoclasts has affinity for both Src SH2 and SH3 domains. We find that suppression of expression of Src in developing osteoclasts results in decreased vesicular acidification, which is rescued by valinomycin, consistent with the loss of chloride conductance in the proton pump-containing vesicles. Suppression of c-Src causes no change in the steady state level of CLIC-5b expression, but does result in failure of proton pump and CLIC-5b to colocalize in cultured osteoclast precursors. We conclude that suppression of c-Src interferes with osteoclast bone resorption by disrupting functional co-localization of proton pump and CLIC-5b.
Skeleton integrity requires that osteoclast-mediated bone resorption be intact and regulated (1). Osteoclasts can remodel bone because these multinucleated cells secret sufficient acid into the resorption compartment to solubilize bone mineral (2, 3), an alkaline salt that becomes increasingly soluble at pH values below 6 (4, 5). The resorption compartment is delineated by a circumferential tightly adherent sealing zone (6). The osteoclast plasma membrane enclosed within the sealing zone differentiates into a highly specialized structure, the ruffled border. Across this membrane the cell actively transports HCl, which dissolves bone mineral and activates acid hydrolases required for bone resorption (7, 8). The transport of HCl occurs in two steps. An electrogenic ATP-dependent proton pump (9–12), inserts H+ into the resorption compartment. Chloride ions follow passively through a parallel chloride conductance, short circuiting the electrogenic pump and allowing the massive HCl secretion necessary during bone resorption (10).
We had previously identified a 62-kDa protein, p62, from avian osteoclast ruffled border that could be reconstituted to form a DNDS2-sensitive chloride channel (13). This protein is antigenically related to bovine CLIC-5b, a chloride channel of bovine kidney microsomal membranes (14). Expression of avian p62 in differentiating avian osteoclasts is coincident with the appearance of outwardly rectifying chloride conductance, valinomycin-independent acidification, and the ability of cells to resorb bone (15), all consistent with the hypothesis that p62 is the ruffled border chloride channel.
Recently, a second protein, ClC-7, has been demonstrated to be important in bone resorption and proposed as being responsible for the ruffled border chloride conductance (16). ClC-7 is a member of the ClC family of proteins, several members of which are well known to function as plasma membrane chloride channels in a variety of cell types (17). The ClC channels are completely unrelated to the p64/CLIC family of proteins. Osteoclasts of animals in which ClC-7 was suppressed were abnormally elongated, had rudimentary ruffled borders and failed to resorb bone. Taken together, these data strongly support the identification of ClC-7 as a necessary component of the ruffled border acidification mechanism.
Osteopetrosis results when osteoclasts are underperforming. Defects in osteoclast differentiation yield animals with dramatic dysfunction in the metabolism of bone including osteopetrosis (18, 19). Many (~50%) of the patients with malignant osteopetrosis have a defective proton pump (20). A mild form of osteopetrosis has been associated with mutations in the chloride channel ClC-7 (16). Studies on CD14 cells differentiated from patients with osteopetrosis indicated that biallelic mutations in ClC-7 produced acidic resorption compartments but were impaired in the removal of organic matrix (21). The ability of these cells to acidify the resorption compartment suggests that ClC-7 may play a role other than serving as the shunt chloride channel necessary for robust acidification.
In addition to the proton pump and putative channel proteins, c-Src, the non-receptor-tyrosine kinase, is a key regulator of bone resorption (22). c-Src is highly expressed in osteoclasts (23) and concentrated at the ruffled border (24). c-Src negative transgenic mice develop osteopetrosis from decreased bone resorption (25). Microscopically, osteoclasts from these mice were described to be elongated and have rudimentary or absent ruffled borders (26). Therefore it appears that c-Src and its downstream signaling pathways support bone resorption by mature osteoclasts by allowing full development of the ruffled border (27–29). A direct role for Src in support of osteoclast acid transport has not been determined, but it is clearly required to develop a functional ruffled border (2, 30).
One mechanism by which c-Src could support the development of functional osteoclasts would be the targeting of proton pump, chloride channel, or both to the ruffled border (3, 10, 15). p64, the bovine kidney homolog of osteoclast p62, has been shown to be regulated by the Src homolog, Fyn (31). When co-expressed with Fyn, p64 becomes tyrosine-phosphorylated and the tyrosine-phosphorylated p64 is a ligand for the SH2 domain of Fyn. Furthermore, co-expression of p64 with Fyn results in increased p64-associated chloride channel activity. These observations led us to speculate that, like p64, the osteoclast chloride channel might be a ligand for c-Src and that c-Src actions in osteoclasts could be mediated, at least in part, by that interaction.
In this report, we separately disrupt expression of CLIC-5b and c-Src by avian osteoclasts differentiating in culture (15). We present evidence that the avian ruffle border chloride channel, p62, is the avian form of CLIC-5b. We observe that suppression of CLIC-5b expression with antisense oligonucleotides reduces osteoclast bone resorption and decreases acidification in vesicles prepared from cultured osteoclasts. Based on the response to valinomycin, we conclude that the reduced acidification results from a decrease in chloride channel activity. These observations support our proposal that CLIC-5b is a ruffled border chloride channel and further confirm the importance of ruffled border chloride conductance in acidification and bone resorption. We investigate the binding of CLIC-5b to Src and demonstrate that the native protein is a ligand for both the SH2 and SH3 domains of Src. Finally, we investigate the effects of antisense suppression of c-Src on acid transport by isolated vesicles. Our data indicate that c-Src may be necessary for the functional expression of active chloride channel in proton pump containing membrane domains of differentiating osteoclasts.
MATERIALS AND METHODS
Culture of Osteoclasts and the Preparation of Membrane Vesicles
Osteoclasts and bone marrow cells were isolated from the long bones of calcium-deprived laying hens (Gallus domesticus), cultured and membranes prepared as described (10, 15, 32). Membrane pellets were stored at −80 °C until analyzed.
Assay of Vesicle Acidification
Acidification of membrane vesicles was as previously described (10, 15). In brief, membrane vesicles formed in 140 mM KCl, 10 mM HEPES (pH 7.0) were diluted into the same buffer containing 3.3 μM acridine orange, 2.5 mM ATP, and other reagents as indicated. The reaction was started by adding 10 mM MgCl2 to the reaction mixture at 37 °C, and fluorescence was followed in an SPF500 spectrofluorometer (excitation 460 nm and emission 520 nm). At the end of each experiment 20 mM NH4Cl was added to determine the extent of intravesicular acidification. Protein concentration was determined using the BCA protein assay method (Pierce) and used to normalize results from different preparations. When studied in this manner the stimulated acidification of the reconstituted ruffled border membrane vesicles has an exponential time course. Therefore the quenching time course for each experiment was fitted to a single exponential using the Levenberg-Marquardt algorithm and Origin software. This analysis generated time constants for dequenching, t, and the size of the ATP-dependent exponential component of the total dequenching, These values were employed to compare the effects of antisense suppression of CLIC-5b or Src on reconstituted vesicle acidification.
Isolation of p64-related Sequences from Chicken
A commercially available chicken genomic library (Stratagene, La Jolla, CA) was screened at low stringency with a probe for the C-terminal portion of bovine p64, yielding a number of individual isolates. Restriction fragments hybridizing to the p64 probe were subcloned into plasmid vectors, random sequences generated and searched for homology with p64. One fragment corresponding to the C-terminal portion of p64 (15) and a second corresponding to the middle of the p64 coding region were found. Oligonucleotides from those genomic sequences were used to generate cDNA from chicken osteoclast mRNA by reverse transcription-polymerase chain reaction (RT-PCR). Northern blots of RNA from cultured differentiating osteoclasts was carried out as previously described (15), using the cloned PCR product as a probe. Several antisense oligonucleotides were selected from the sequence and assessed for ability to suppress expression of p62 in cultured cells. The most effective of these, 5′-CATCTGTCTTGACTTCTCC, was used in the following experiments. Phosphorothioate oligonucleotides containing this and matched complementary sense sequence was purchased from Midland Scientific (Midland, Texas).
Antisense Treatment of Osteoclasts
Marrow cells from calcium-deprived hens were isolated as described and cultured in the presence of devitalized bone particles (15, 32). After 24 h in culture, cells were exposed to phosphorothioate oligonucleotide using streptolysin-O permeabilization (33, 34). Cells were washed in permeabilization buffer at 37 °C (137 mM NaCl, 100 mM PIPES at pH 7.4, 5.6 mM glucose, 2.7 mM KCl, 2.7 mM EGTA, 0.1% bovine serum albumin) and then exposed to 50 μM oligonucleotide in the same buffer supplemented with 1 mM ATP, 5 mM dithiothreitol and 0.5 units/ml streptolysin-O at 37 °C for 15 min. The cells were returned to growth medium for 2 h, washed an additional time with growth medium and returned to culture. The cells were harvested for analysis from 20 to 100 h after exposure to oligonucleotide. Avian c-Src expression was suppressed using antisense oligonucleotides as previously described (33).
Bone Pitting Analysis
Marrow cells were plated directly onto ivory disks and exposed to oligonucleotide after 24 h exactly as described above. Forty-eight hours later the disks were stained using a toluidine blue-based two-stage procedure yielding the number of attached osteoclasts as well as the number of pits (35, 36).
Immunohistochemistry
Marrow cells were cultured onto thin microscope cover slips and exposed to oligonucleotide as described above. At 72 h in culture, the cells were fixed in 4% paraformaldehyde/PBS for 10 min, rinsed with PBS and permeabilized with 0.1% Triton X-100/PBS for 1 min. The cells were incubated overnight at 4 °C in 1:1000 dilution of AP656 (rabbit polyclonal antibody raised against an 18-amino acid peptide from CLIC-5b (15)), washed and incubated overnight in 1:1000 mouse E11 (mouse monoclonal antibody specific for proton ATPase (37)), washed and incubated overnight with species-specific fluorescent secondary antibodies. Cover slips were mounted in Prolong antifade medium. Samples were viewed on a Zeiss LSM510 confocal microscope and z-stacks of cells were taken at 0.3-micron steps. These stacks were used to construct three-dimensional images that were analyzed using NOEsys, Research Systems, Inc. and final figures produced with Photoshop.
Western Blotting
For detection of CLIC-5b, membrane preparations were analyzed by SDS-PAGE and probed with the AP656 antibody raised against a 18-amino acid peptide from CLIC-5b (15). For detection of Src, whole cell lysates were separated by SDS-PAGE, blotted, and probed with antibody raised against an avian Src (Upstate Biotechnology, Lake Placid, NY) using Supersignal detection reagents (Pierce).
Immobilized Src Homology Domain Binding Studies
Regions encoding chicken Src SH2 domain (amino acids 145–240) and SH3 domain (amino acids 86–140) were generated by RT-PCR from chicken osteoclast RNA using standard methods, and inserted into plasmid pGEX-KG. This resulted in plasmids encoding glutathione S-transferase (GST) fused to the N terminus of either Src SH2 or SH3 domains as reported previously for Fyn SH2/SH3 (38). Fusion proteins were purified from bacteria and 1 mg of each was immobilized on 1 ml of Affi-Gel-15 beads (Bio-Rad). Membrane fractions from mature osteoclasts were solubilized in 150 mM NaCl, 10 mM Tris, pH 8.0, 1.4% n-octyl glucoside and insoluble debris removed by centrifugation at 100,000 × g for 1 h. For phosphatase treatment, 5 units of alkaline phosphatase (Promega) were added per mg of solubilized protein and incubated at room temperature for 30 min. Solubilized protein, 350 μg, was incubated with 20 μl of 50% suspension of Affi-Gel-15 beads bearing either GST (control beads), GST-SH2 fusion protein, or GST-SH3 fusion protein for 1 h at 4 °C. The beads were washed four times with solubilization buffer, suspended in Laemmli loading buffer, separated by SDS-PAGE and probed for CLIC-5b with affinity-purified antibody 656 as described previously (15).
Immunoprecipitation and in Vitro Kinase Assay
1 ml of crude 656 antiserum or of preimmune serum was immobilized on 2 ml of resin using the carbolink system (Pierce). Nonspecific binding sites were blocked by incubation with 1 mg/ml bovine serum albumin in PBS for 1 h. Membrane fractions from freshly isolated mature osteoclasts were solubilized in 200 mM sucrose, 10% glycerol, 10 mM Tris, pH 8.0, 1 mM EDTA, 1.4% n-octyl glucoside, 0.1 mM phenylmethylsulfonyl fluoride, and 0.1 mM sodium orthovanadate. Insoluble debris was removed by centrifugation and protein concentration determined. Overnight 300 μg of solubilized protein were incubated with 20 μl of 50% suspension of immune or preimmune beads at 4 °C with gentle mixing. Beads were washed with three changes of solubilization buffer followed by three changes of 200 mM LiCl, 200 mM Tris (pH 8), and finally one change of 20 mM HEPES (pH 7.4), 5 mM MgCl2, and 0.1 mM Na3VO4. The washed beads were then suspended in 10 μl of the same buffer and 1 μl of [γ-32P]ATP (3000 Ci/mM, 20 mCi/ml) was added for a 20-min incubation at room temperature. Fifteen microliters of 2×Laemmli loading buffer was added, the samples separated by SDS-PAGE and 32P-labeled proteins detected by autoradiography. As a positive control, 1 μl of purified human Src (Upstate Biotechnology, Lake Placid, NY) was added to an identical reaction mixture without the antibody beads.
RESULTS
Proton Pump and Chloride Permeability in HCl Transport by Osteoclast Membrane Vesicles
Proton transport into membrane vesicles prepared from osteoclasts is electrogenic and therefore a compensating short circuit current is required for significant acidification (10, 11). In these vesicles, endogenous sodium and potassium permeabilities are absent but chloride in the extravesicular medium permits robust acidification (10, 13). The chloride requirement can be overcome by introducing potassium permeability with valinomycin, a potassium ionophore. In the presence of equal intra- and extravesicular potassium concentration, valinomycin will clamp vesicle membrane potential at zero, thus permitting acidification of the vesicle interior to proceed at the maximum rate supported by the proton pump. We have previously shown that an imbalance of chloride permeability and proton transport by osteoclast membrane vesicles can be revealed by the effect of valinomycin on acidification (15). If the chloride permeability of these vesicles is adequate to prevent generation of a membrane potential by the proton pump, valinomycin will have no additional effect on acidification. Conversely, if chloride permeability is limiting, valinomycin will collapse the membrane potential resulting from pump activity and thus enhance acidification.
To study membrane potential-limited acidification in osteoclast vesicles we apply valinomycin and determine whether the rate or extent of acidification is increased. The kinetics of vesicle acidification was determined using an acridine orange technique as previously described (10, 11). In this assay, acidification of intravesicular space leads to accumulation of acridine orange inside the vesicles and quenching of fluorescence (39). Under these conditions acidification is an exponential approach to the steady state resulting from a balance of v-H+-ATPase activity and vesicle proton leak (40). In the presence of extravesicular chloride, vesicles acidify rapidly, as detected by quenching of acridine orange fluorescence, Fig. 1. Addition of valinomycin in the presence of chloride had minimal effect, indicating that these vesicles have sufficient shunt permeability to allow maximal acidification by the amount of proton pump present (10, 15). Substitution for chloride with the impermeant anion, sulfate, or addition of the anion channel inhibitor, DNDS, reduced acidification. In either case electrogenic H+ transport by the pump generates a membrane potential, which increases proton leak and inhibits pump activity thereby raising the steady-state pH. Fig. 1, A and C show that acidification in the presence of sulfate or DNDS was completely rescued by valinomycin and that restoration of a charge compensation mechanism allows acidification to proceed. In Fig. 1B, acidification was blocked by the proton pump inhibitor, bafilomycin A1 and valinomycin had no effect. Thus the response to valinomycin can be used to distinguish between reduced anion permeability, which is valinomycin reversible, and reduced proton pump activity, which is valinomycin-resistant, as possible causes of reduced vesicle acidification. In subsequent experiments, we have used the presence or absence of a valinomycin-dependent component of acidification to discern if the chloride channel activity is limiting vesicle acidification.
FIGURE 1. Chloride and proton pump dependence of osteoclast vesicle acidification.
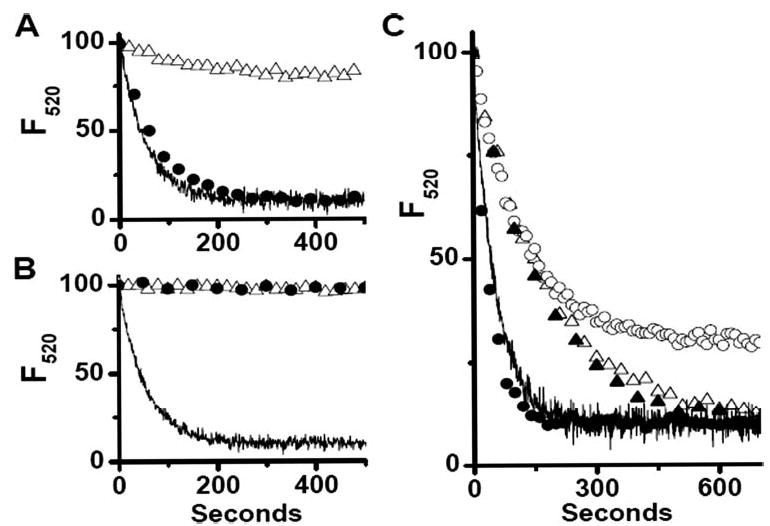
Acidification of vesicles prepared from osteoclasts differentiated in vitro was assayed using the acridine orange quenching technique as described under “Materials and Methods.” In 140 mM KCl vesicles rapidly acidified (solid line, n = 9). A, in 93 mM K2SO4 acidification was severely limited, (▵, n = 3). This inhibition was completely reversed by the addition of 1 μ Mvalinomycin, (•, n = 3) restoring acidification to that by vesicles in 140 mM KCl, (solid line). B, addition of 100 nM bafilomycin A1 30 s prior to MgSO4 completely blocked acidification (▵, n = 3). This inhibition was not affected by the addition of 1 μM valinomycin (•, n = 2). C, partial inhibition by 10 nM bafilomycin (▵, n = 3) was not reversed by valinomycin (▴, n = 2). However, these vesicles acidifiy more slowly and to the same extent as untreated vesicles. Vesicles treated with 100 nM DNDS also show a reduced extent of acidification (○, n = 3), which is completely reversed by 1 μM valinomycin (•, n = 3).
Expression of CLIC-5b during Osteoclast Differentiation
p62 is antigenically related to a microsomal chloride channel of bovine kidney, p64 (15), a member of the CLIC family of chloride channels (41). Mammals have 6 distinct CLIC genes, named CLIC 1 through 6. Bovine p64 is a product of the CLIC-5 gene (14, 42). We used bovine p64-specific probes to identify CLIC-related sequences in cDNA from avian osteoclasts. Using a combination of genomic library screening and mRNA-based RT-PCR, a 519-base pair PCR product named C2C3 was isolated and its sequence determined. The resulting sequence shows 80.2% identity to the corresponding region of bovine p64 and encodes a protein sequence which corresponds to amino acids 240–414 in the p64 sequence with 88% identity. The sequence exactly matches an avian genomic sequence on the long arm of chromosome 3, divided into 5 exons. This sequence is more closely related to mammalian CLIC-5 than to any other CLIC family member, and therefore is a putative avian version of CLIC-5.
To determine whether this sequence could encode p62, C2C3 was used to probe mRNA from cells at different stages of osteoclast differentiation as shown in Fig. 2. No message was detected with this probe in mononuclear cells isolated from chicken bone marrow and kept in culture for 1 day. In cells that had been cultured for 5 days and allowed to differentiate into multinucleated osteoclasts, two messages were detected, one of about 9.5 kb and one of about 4.4 kb. Culture in the presence of bone led to an increase in expression of both these messages. Thus, the C2C3 cDNA sequence hybridizes to two messages which, like p62 itself, appear as cells differentiate in culture, and are more abundant when cells are grown in the presence of bone.
FIGURE 2. Northern blot analysis of osteoclast mRNA for CLIC-5b message expression.
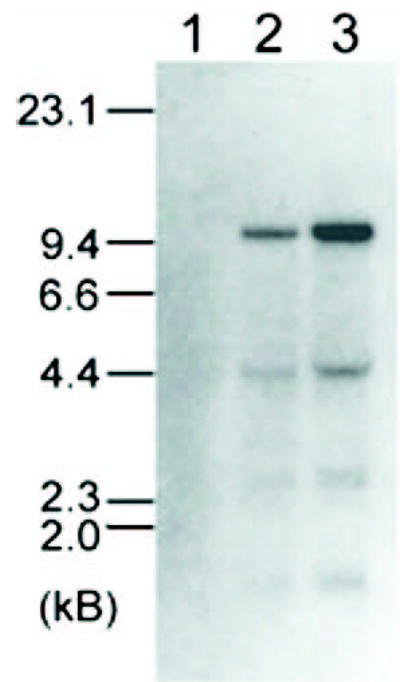
Three micrograms of poly(A) RNA from chicken bone marrow mononuclear cells after 1 day in culture (lane 1) or cells which had been allowed to differentiate for 5 days into multinucleated osteoclasts either in the absence (lane 2) or presence (lane 3) of bone particles were probed at high stringency using a 519-PCR product from the avian CLIC-5b genomic sequence, C2C3. The positions of molecular mass standards (kilobases) are indicated.
CLIC-5 is unique among the mammalian CLIC genes in that it is subject to alternate splicing with two distinct coding regions for the first exon. In humans, one (exon 1-A) encodes a short N-terminal domain, resulting in a protein with predicted molecular mass of 28179, and a second, upstream exon (exon 1-B) encodes much larger N-terminal domain, resulting in protein with predicted molecular mass of 46537 (CLIC5b). Based on size of the protein, we expect p62 to correspond to the longer version, CLIC-5b. Unlike the remainder of the highly conserved CLIC-5 coding regions, exon 1-B is not tightly conserved across species. We used bovine and human sequences to search for an upstream exon encoding the CLIC-5b and discovered a potential coding region lying about 38,000 bp upstream of exon 2. This sequence encodes an open reading frame encoding 158 amino acids that shows 25% identity, 50% similarity to the human exon 1b. The last 9 amino acids encoded in exon 1 are highly conserved among all CLICs. 7 of the last 9 amino acids encoded by the putative chicken 1-B are identical to the corresponding motif in human exon 1-B. A second motif of particular interest is the SH2 binding site which occurs at position 33 in the bovine CLIC-5b sequence, and is conserved at position 33 in the chicken sequence. A motif with consensus EDLPSPSSFTIQ present in all mammalian CLIC-5b sequences (occurring at position 133 in the human sequence) occurs in a partially corrupted version (EDpaSPSStTtm) at position 38 in the chicken sequence. On the basis of these sequence similarities and the Northern blot results, we believe this sequence encodes exon 1B of the chicken CLIC-5 gene and that the avian CLIC-5b protein is the chloride channel protein we had previously called p62. The sequence is displayed in Fig. 3. The predicted molecular mass of this protein is 43,970.
FIGURE 3. Amino acid sequence of chicken CLIC-5b.
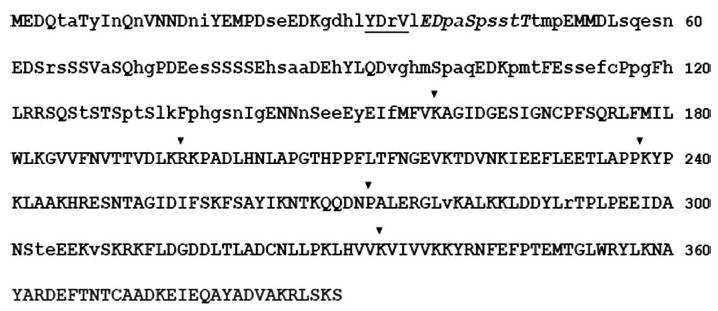
Sequence predicted from the genomic DNA is shown. Positions showing identity or similarity to the human sequence are in uppercase. The arrowheads denote position of introns within the coding region. The SH2 binding domain is underlined. The conserved CLIC-5b motif is in italics.
Antisense Suppression of p62 during in Vitro Osteoclast Differentiation
A sense-antisense pair of phosphorothioate oligonucleotides derived from position 649 to 667 in the avian CLIC-5b coding region were tested as follows. The results shown are for the most effective oligonucleotides. Oligonucleotide was introduced into differentiating osteoclast precursors using the streptolysin-O technique (33, 34). Twenty hours after exposure to oligonucleotide, membrane fractions from the cultured cells were prepared for immunoblotting and for characterization of proton transport activity (10, 15). For immunoblotting, equal amounts of protein were separated by SDS-PAGE, blotted, and probed with antibody to CLIC-5b as shown in Fig. 4A. Treatment of cells with antisense oligonucleotide (lane 2) clearly decreased the level of CLIC-5b compared with that of cells treated with the sense oligonucleotide (lane 1). The oligonucleotide treatment had no effect on lower molecular weight CLIC proteins also recognized by the antibody. These lower molecular weight CLIC proteins are expressed in many cell types and their expression does not change as osteoclasts differentiate (15, 43–45).
FIGURE 4. Analysis of p62 suppression on in vitro differentiated osteoclasts treated with CLIC-5b oligonucleotides.
A, equal quantities of membrane protein from cells treated with sense (lane 1) or antisense (lane 2) CLIC-5b oligonucleotide were separated by SDS-PAGE and probed with antibody AP656 as previously described (15). Migration position of molecular mass standards are marked in kDa. For comparison the integrated intensities of the gels were normalized to those of the sense-treated cells in lane 1. The integrated density of the CLIC-5b protein band was decreased 71% by treatment with antisense oligonucleotide, while the bands between 32 and 34 kDa were unchanged. B, comparison of acidification by membrane vesicles prepared from cells treated with streptolysin-O in the absence of CLIC-5b oligonucleotide (top), cells treated with sense nucleotide (center), or cells treated with antisense nucleotide (bottom). Each figure compares acidification, (line) with acidification in the presence of 1 μM valinomycin (○). In addition to the data shown, acidification by each preparation was completely inhibited by bafilomycin A1 and displayed valinomycin reversed inhibition by substitution of sulfate for chloride as in Fig. 1. For each preparation the acidification-dependent quenching was verified to be reversible by the addition of NH4Cl (3, 15). The data were analyzed by curve fitting as described under “Materials and Methods” to determine the time constant of acidification (τ) and extent of acidification dependent quenching (total Quench). The antisense suppression was studied in three independent experiments using parallel control and sense treatments in every case. Each oligonucleotide treatment (control, sense, and antisense) was done in triplicate, and the cell membrane vesicles prepared and analyzed independently. The acidification curves shown are the average of the replicates for one representative experiment (n = 3) with the standard deviation presented for every 50th point. C, comparison of the time constants, τ, for vesicle preparations from cells treated as follows: control cells, Cont; control cells and added valinomycin, Cont+V; sense oligonucleotide-treated cells, Sense; sense oligonucleotide-treated cells and added valinomycin, Sense+V; antisense oligonucleotide-treated cells, Anti; and antisense oligonucleotide-treated cells and added valinomycin, Anti-V. D, total quench, for vesicle preparations that are labeled as in C. C and D summarize our total results from three independent experiments where each oligonucleotide treatment was done in triplicate. Each column is the average of the successful replicates from the three experiments, and the error bars are the S.D. for n = 3–9 but never less than 3.
To determine whether suppression of CLIC-5b had an effect on acid transport, membranes prepared from control cells, and cells treated with sense or antisense oligonucleotide were assayed for acidification as shown in Fig. 4. We assessed whether chloride transport was limiting for each membrane preparation by determining acidification in the presence (open symbols) and absence (line) of valinomycin. A compares the time dependence of acidification for vesicles from control cells (top) that had been exposed to streptolysin-O but with no oligonucleotide to cells treated with sense oligonucleotides (middle) and cells treated with antisense oligonucleotides (bottom). As in Fig. 1, control and sense-treated vesicles show rapid acidification which is not enhanced by valinomycin indicating that chloride channel charge-compensation is not limiting proton pump dependent acidification. In contrast, the vesicle preparation from cells treated with antisense oligonucleotides shows reduced acidification that is rescued by valinomycin, Fig. 4B. Analysis of acidification by curve fitting was used to determine the time constant of acidification, t, and extent of acridine orange acidification-dependent fluorescence quenching. This analysis is summarized in Fig. 4, C and D. Compared with control and sense-treated cells, cells treated with antisense oligonucleotides display a significant reduction in both the rate and extent of acidification. This behavior is consistent with a loss in chloride channel activity in the vesicles from antisense-treated cells without a major change in proton pump activity and is the predicted outcome if the antisense oligonucleotide from CLIC-5b selectively suppressed expression of the ruffled membrane chloride channel.
Effect of CLIC-5b Suppression on Bone Resorption
A two stage toluidine blue staining method was used to study bone resorption (35). Chicken marrow mononuclear cells were plated on dentine slices. At specified time points, the number of attached cells and the number of resorption pits were determined (33, 46, 47). The ratio of resorption pits to attached cells was used to evaluate bone resorption. Without oligonucleotide treatment bone resorption was linear for 96 h (Fig. 5A) after which the number of bone attached cells begins to decline. All subsequent studies were done at 72 h when pit production was linear, and cell number was stable. To characterize pit formation when acid transport is reduced the potent proton pump inhibitor, bafilomycin A1, was applied to cultured osteoclasts (48). Bafilomycin A1 was added 24 h after cell attachment to dentine and followed with pit and cell number determination at 72 h (Fig. 5B). The bafilomycin effect saturated at ~50 nM producing a decrease in pits per cell from 0.9 to 0.6, reflecting the maximum inhibition of pit formation that can be achieved by blocking proton transport at 24 h. Because at 50 nM new pitting appears to be blocked, we used residual cell pitting to represent the ability of the cells to initiate a resorption pit within 24 h of culture on bone. To determine the effect of CLIC-5b suppression on pit generation, bone marrow mononuclear cells were plated directly on whale dentine slices. After 24 h in culture, the cells were subjected to streptolysin-O treatment with either sense or antisense oligonucleotide as above. In addition, some cultures received no treatment (control cells) and some were treated with 100 nM bafilomycin at 24 h as above. Cells were continued in culture for an additional 48 h after which the number of resorption pits per cell was determined (Fig. 5C). Control cells generated 0.79 ± 0.022 pits per cell (n = 346) while cells treated with bafilomycin generated 0.58 ± 0.049 pits per cell (n = 103). Cells treated with sense oligonucleotide generated 0.79 ± 0.029 pits per cell (n = 195) and cells treated with antisense oligonucleotide generated 0.68 ± 0.032 pits per cell (n = 206). The difference in pit formation between sense- and antisense-treated cells is significant (p = 0.012). Thus, suppression of expression of CLIC-5b in differentiating osteoclasts reduces the ability of these cells to resorb bone.
FIGURE 5. Inhibition of bone resorption by treatment of in vitro differentiated osteoclasts with antisense oligonucleotides that suppress CLIC-5b expression.
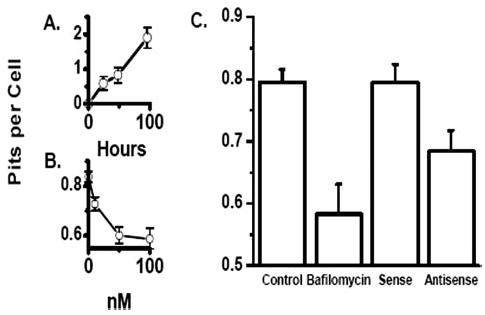
Osteoclast precursors were isolated and allowed to attach at low density to whale dentine disks. A, cells were incubated for the indicated times and number of resorption pits per cell determined as described (33, 35). B, after 24 h of culture bafilomycin A1 was added as indicated. Pitting and cell number was determined 48 h later. Panel C, at 24 h cells were treated with streptolysin-O as described under “Materials and Methods” and exposed to phosphorothioate nucleotides or not as indicated and returned to culture where bafilomycin A1 could be added for a non-pitting control as indicated in the figure. Pitting and cell number were determined 48-h later: control, 0.79 ± 0.022 pits per cell (n = 346); bafilomycin, 0.58 ± 0.049 pits per cell (n = 103); sense, 0.79 ± 0.029 pits per cell (n = 195); and antisense, 0.68 ± 0.032 pits per cell (n = 206). The difference between sense-and antisense-treated cells was significant at p = 0.012. These data were pooled from three independent experiments.
Binding of CLIC-5b by Immobilized SH2 or SH3 Regions
Because bovine CLIC-5b, p64, is known to bind to the SH2 region of the Src family member, Fyn (31), we investigated whether avian CLIC-5b could bind to the SH2 or SH3 domains of Src. Solubilized osteoclast membrane protein was incubated with immobilized GST fusion proteins containing Src SH2 or Src SH3 domains. After extensive washing the bound protein was separated by SDS-PAGE and probed with AP656 for high molecular weight CLIC-5b cross-reactive protein. Fig. 6 shows that CLIC-5b binds to both the SH2 and SH3 domains of Src. Typical SH2 binding is critically dependent on phosphorylation of a tyrosine residue within SH2 ligand but SH3 binding is independent of phosphorylation (49, 50). We treated the solubilized osteoclast membrane proteins with alkaline phosphatase prior to exposure to immobilized Src fusion proteins. The phosphatase treatment eliminated binding to the immobilized SH2 but not SH3 domains, Fig. 6.
FIGURE 6. High affinity binding of CLIC-5b by immobilized Src SH2 or SH3 domains and co-immunoprecipitation of kinase activity.
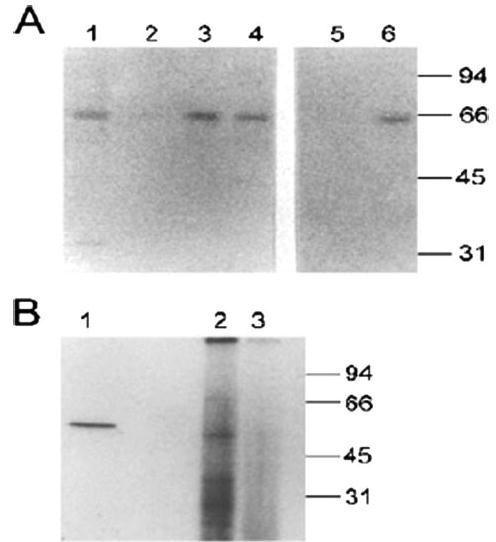
A, retention of CLIC-5b by immobilized SH2 and SH3 domains of Src. Twenty micrograms of solubilized osteoclast membranes (lane 1) or those proteins which bound to immobilized GST (control; lane 2), GST-srcSH2 fusion protein (lanes 3 and 5) or GST-srcSH3 fusion protein (lanes 4 and 6) were separated and probed with affinity-purified antibody AP656. Samples shown in lanes 5 and 6 were treated with alkaline phosphatase prior to binding to immobilized fusion protein. B, 300 μg of solubilized membrane protein from cultured in vitro differentiated osteoclasts were immunoprecipitated by preimmune sera (lane 3) or antisera 656 (lane 2) as described under “Materials and Methods.” The washed immunoprecipitates were incubated in kinase reaction media with [γ-32P]ATP and then separated by SDS-PAGE and labeled bands detected by autoradiography. In lane 1, 1 μg of purified human Src was incubated in the kinase reaction mixture before separation and autoradiography. Migration positions of molecular mass standards are shown in kilodaltons.
A tandem immunoprecipitation in vitro kinase assay was used to assess whether as isolated from cells CLIC-5b is associated with an osteoclast kinase. Solubilized osteoclast membrane protein was immunoprecipitated with the 656 antiserum or with preimmune serum. After extensive washing, the immunoprecipitates were suspended in a kinase reaction mixture containing g-32P-ATP to permit labeling by precipitated kinase activity. The reaction products were then separated by SDS-PAGE and phosphorylated proteins were detected by autoradiography (Fig. 6B). As a positive control, purified human Src was incubated in the kinase reaction mixture. As expected, the human Src labeled itself, resulting in a single labeled band of 60 kDa (Fig. 6B, lane 1). The immunoprecipitate displayed kinase activity (Fig. 6B, lane 2) that was not present in preimmune serum-treated sample (Fig. 6B, lane 3). The kinase activity immunoprecipitated with 656 antisera labeled protein bands of 60, 35, and 30 kDa in the immunoprecipitate. It is tempting to speculate that the 60 kDa protein could be c-Src, but we have not been able to characterize this band further. CLIC-5b itself, which would be expected to run above 60 kDa, does not appear to be labeled.
Antisense Suppression of Src during Osteoclast Differentiation
It has previously been shown that antisense suppression of Src or use of a tyrosine kinase inhibitor decreases the ability of osteoclasts to resorb bone (27, 28, 51). Whether disruption of c-Src affects acid transport by osteoclasts has not previously been investigated. The binding of CLIC-5b by immobilized SH2 or SH3 domains and co-immunoprecipitation with CLIC-5b of a kinase activity suggested to us that c-Src might regulate acid transport through effects on CLIC-5b. Using antisense oligonucleotides against c-Src we studied the effect of Src suppression on acid transport activity of membranes isolated from in vitro differentiated osteoclasts. Bone marrow mononuclear cells were plated in the presence of bone particles and after 24 h the cells were treated with sense or antisense Src oligonucleotides (33). Twenty hours later, membranes were prepared, and the levels of both c-Src and CLIC-5b protein expression were determined by Western blotting (Fig. 7, A and B). As expected, sense oligonucleotide had no effect upon levels of either protein. In contrast, antisense c-Src oligos greatly decreased the level of c-Src in these cells without a detectable effect on the level of CLIC-5b.
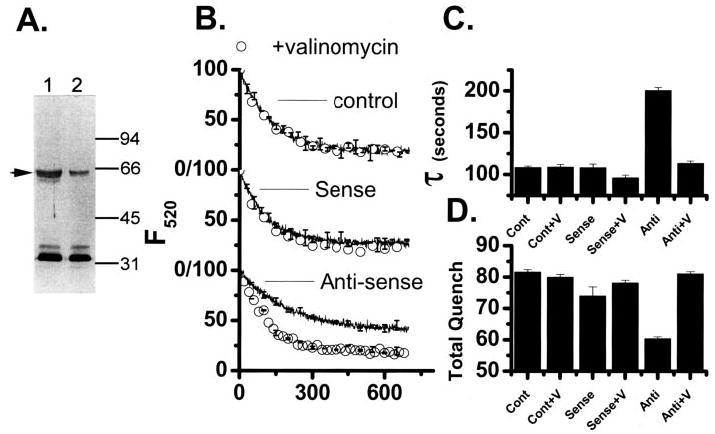
FIGURE 7. Analysis of Src reduction on CLIC-5b expression and acidification of vesicles from in vitro differentiated osteoclasts.
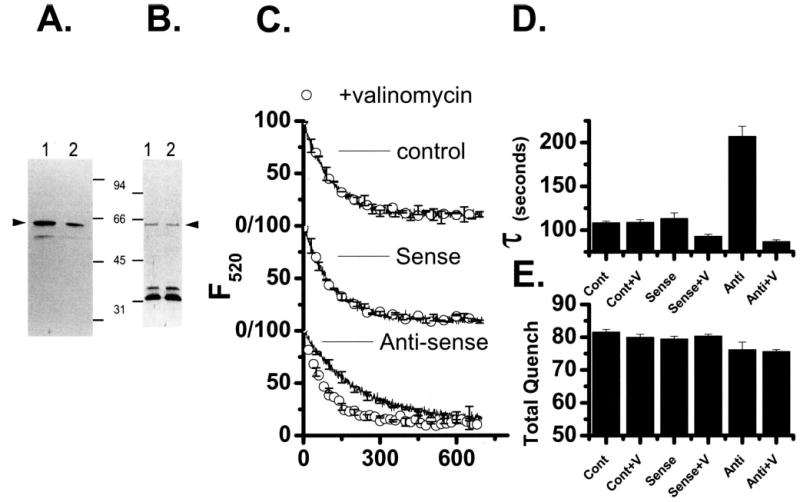
A, equal amounts of total cell protein from osteoclasts treated with sense (lane 1) or antisense (lane 2) Src phosphorothioate oligonucleotides were separated by SDS-PAGE, blotted and probed with avian Src antibodies. The integrated intensity was decreased by 65% in cells exposed to antisense Src oligonucleotide. B, equal amounts of membrane proteins from osteoclasts treated with sense (lane 1) or antisense (lane 2). Src oligonucleotides were separated by SDS-PAGE, blotted and probed with AP656 (15). The integrated intensity of the CLIC-5b band was unchanged (100 ± 1%) by sense or antisense oligonucleotide treatment. Molecular mass markers of 94, 66, 45, and 31 kDa are indicated. Arrowheads indicate the migration position of intact Src (A) and CLIC-5b (B). C, comparison of acidification by membrane vesicles prepared from cells treated with streptolysin-O in the absence of Src oligonucleotide (top), cells treated with sense oligonucleotide (center) or cells treated with antisense oligonucleotide (bottom). Each figure compares acidification (line) with acidification in the presence of 1 μM valinomycin (○). In addition to the data shown, acidification by each preparation was completely inhibited by bafilomycin A1 and displayed valinomycin-reversed inhibition by substitution of sulfate for chloride as in Fig. 1. For each preparation the acidification-dependent quenching was verified to be reversible by the addition of NH4Cl (3, 15). The data were analyzed by curve fitting as described under “Materials and Methods” to determine the time constant of acidification (τ) and extent of acidification-dependent quenching (Total Quench). The antisense suppression was studied in three independent experiments using parallel control and sense treatments in every case. Each oligonucleotide treatment (control, sense, and antisense) was done in triplicate, and the cell membrane vesicles prepared and analyzed independently. The acidification curves shown are the average of the replicates for one representative experiment (n = 3) with the standard deviation presented for every 50th point. D, comparison of the time constants, τ, for vesicle preparations from cells treated as follows: control cells, Cont; control cells and added valinomycin, Cont+V; sense oligonucleotide-treated cells, Sense; sense oligonucleotide-treated cells and added valinomycin, Sense+V; antisense oligonucleotide-treated cells, Anti; and antisense oligonucleotide-treated cells and added valinomycin, Anti-V. Each oligonucleotide treatment was done in triplicate, and the cell membrane vesicles prepared and analyzed independently (n = 3). The columns are the average of those three determinations and the error bars are the S.D., n = 3. E, total quench, for vesicle preparations, which are labeled as in B. D and E summarize our total results from three independent experiments where each oligonucleotide treatment was done in triplicate. Each column is the average of the successful replicates from the three experiments and the error bars are the S.D. for n = 3–9 but never less than 3.
Membrane vesicles were prepared from control cells and from cells treated with c-Src sense or antisense oligonucleotides, and vesicle acidification kinetics were determined (Fig. 7C). The acidification of vesicles from control cells was robust, as previously shown, and there was no significant enhancement of acidification by valinomycin. Vesicles from sense oligonucleotide treated cells are indistinguishable from the control cells. Vesicles from Src antisense oligonucleotide-treated cells show reduced acidification that is returned to control levels by valinomycin addition. Analysis by curve fitting shows that only the antisense-treated cells were significantly altered in acidification kinetics (Fig. 7, D and E). Furthermore, the decreased acidification was restricted to a slower rate of acidification, a pattern which was distinct from the changes we saw in the cells with CLIC-5b suppressed (Fig. 7D and see above). These results are consistent with short term suppression of Src resulting in loss of shunt chloride conductance in the osteoclast membranes with no significant loss of overall pump activity. Because the expression of CLIC-5b is not reduced, possible explanations are that c-Src affects the channel activity of CLIC-5b or that it affects the targeting of CLIC-5b to proton pump containing membranes.
Immunohistochemistry of Normal and Antisense Src-suppressed Osteoclasts
To determine whether c-Src effects co-localization of proton pump and CLIC-5b, we studied the sub-cellular distribution of CLIC-5b and H+-ATPase in osteoclasts using high affinity antibodies, fluorescent species-specific secondary antibodies and confocal microscopy. The cells were analyzed by optical sections of 0.3 microns and corresponding z-planes merged to determine overlap. The resulting images were normalized to cytoplasmic background intensity for comparison and the z-stack collapsed to one plane. In this way it is easy to see the difference in pump and channel overlap but the individual vesicles are not being displayed. Control cells are shown in Fig. 8A. These cells are cultured on glass and do not form a ruffled membrane but display enlarged intracellular compartments that have been reported to be acid (52–55). Identical patterns of staining were observed in untreated cells and cells treated with c-Src sense nucleotide or cells mock-treated with nucleotide, Fig. 8, A and B. A different pattern was observed in cells treated with c-Src antisense nucleotide as shown in Fig. 8C. These cells demonstrate a significant reduction in overlap of the proton pump and the CLIC staining. The remaining overlap varied among antisense-treated cells but was always significantly reduced. The overlap of pump and channel appeared to occur in localized regions of the cell but because the cells were not polarized to a bone surface a detailed morphological analysis seemed unwarranted. Thus, suppression of expression of c-Src results in failure to form the large intracellular compartment that contains both proton pump and chloride channel.
FIGURE 8. Immunohistochemistry of CLIC-5b and H+-ATPase in osteoclasts and the effect of Src suppression.
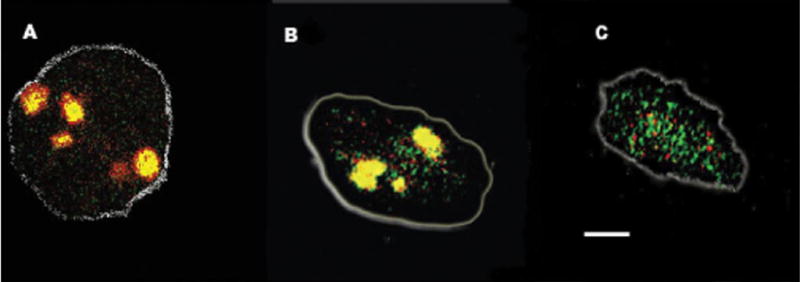
Osteoclasts were differentiated on coverslips and stained for CLIC-5b (green) and H+-ATPase (red ) as described. These panels are single osteoclasts recorded by confocal microscopy and processed as described under “Materials and Methods.” We processed five cells from each group (no nucleotide, sense, and antisense). The no nucleotide and sense cells were identical in appearance by this measure. The white bar in B is 10 microns, and the two panels have comparable magnification. The gray outline approximates the attachment border of the cells to the coverslip. Panel A, cells treated without nucleotide. Panel B, cells treated with sense nucleotide. Panel C, cells treated with antisense nucleotide.
DISCUSSION
In this article, we have explored the relationships between acid transport activity of membranes derived from avian osteoclast, bone pitting by avian osteoclasts and the expression of both p62 and c-Src. Our data lead to several major conclusions: 1) Chloride conductance indeed plays a critical role in osteoclast-mediated bone resorption acid transport; 2) expression of p62, now identified as avian CLIC-5b, is necessary for the functional expression of ruffled border chloride conductance and osteoclast bone resorption; 3) CLIC-5b is a ligand for the SH2 and SH3 domains of Src in vitro, and is associated with a kinase activity in vivo, and 4) suppression of c-Src in developing osteoclasts results in loss of charge-compensating chloride conductance in proton pump-containing vesicles and the loss of co-localization of proton pump and CLIC-5b in cultured osteoclasts. These results indicate for the first time that in addition to the many effects of c-Src upon osteoclast differentiation and survival it has a direct effect upon acid transport in the ruffled border membrane.
Importance of Chloride Conductance in Osteoclast Acid Transport and Bone Resorption
The molecular mechanism of bone resorption requires massive acid secretion (2–5). It has been established that the resorption compartment acidifies through the action of a bafilomycin-sensitive electrogenic v-type proton ATPase (56, 57). This requires charge neutralization which is proposed to be provided by a chloride channel activity in avian and mammalian osteoclasts (15, 16). Fig. 1 shows that acidification of membrane vesicles reconstituted from avian osteoclasts is inhibited both by bafilomycin and by substitution of an impermeant ion, sulfate, for chloride. A key observation for this article is that the inhibition caused by decreasing anion-mediated charge compensation (in this case, by substituting sulfate for chloride) is completely overcome by valinomycin while inhibition caused by suppressing proton pump activity directly (i.e. with bafilomycin) is not. Thus, the acidification in the presence of valinomycin is a measure of the level of proton pump activity in the membranes. The difference between acidification in the absence and presence of valinomycin is a direct reflection of the degree to which the chloride conductance compensates for the proton pump electrogenic activity in the acidifying vesicles. If valinomycin has no effect on acidification, it follows that there is sufficient chloride conductance to allow acidification to the full capacity of the proton pump activity available. If valinomycin enhances acidification, the chloride conductance is not adequate for the available level of proton pump activity. We used this assessment of chloride channel activity in acidifying vesicles to compare vesicle preparations from cells in which we manipulated p62 or Src expression levels.
Identification of p62 as Avian CLIC-5b
Although we have not yet demonstrated the expression of p62 channel activity from recombinant avian CLIC-5b, the evidence that CLIC-5b and p62 are one and the same is persuasive. First, we had previously raised antisera against a peptide derived from a partial cDNA sequence, which has proven to be the avian CLIC-5, and found that this antisera recognizes p62 (15). Second, the developmental regulation of p62 protein in osteoclasts parallels that of CLIC-5b mRNA presented in this article (15). Third, CLIC-5b has a predicted molecular mass of 43,970 Da but the apparent molecular mass on SDS-PAGE is ~62,000 Da. This anomolous electrophoretic mobility has been previously reported and is a feature of several CLIC family proteinses (14, 43, 44, 58 – 63). Finally, the sequence of CLIC-5b contains potential Src homology domain interaction motifs that could account for the observed binding of p62 to these domains. Therefore, we conclude that p62 is the avian version of CLIC-5b.
Suppression of p62 Expression
Antisense oligonucleotides derived from the avian CLIC-5 gene sequence suppressed expression of p62 without affecting the levels of other CLIC family members recognized by our antibody. Suppression was transient and not secondary to cell death or disruption of the osteoclast phenotype (not shown). We examined the effect of antisense suppression of osteoclast p62 in two ways: we characterized acid transport activity of vesicles derived from treated cells, and we assessed the ability of the treated cells to generate resorption pits on bone. Acidification of vesicles was assayed in the presence or absence of valinomycin as outlined above. We found that suppression of expression of p62 resulted in decreased valinomycin-independent acidification with rescue of acidification to control levels in the presence of valinomycin. This finding is diagnostic of a loss in short-circuiting chloride conductance without a change in proton pump activity. To assay the capacity of cells to resorb bone, we used a simple determination of number of pits per cell as has been previously reported (35, 36). With this assay, we found that the rate of appearance of pits per cell is linear up to 100 h of culture. Pit formation is inhibited in a saturable manner by addition of bafilomycin after 24 h of culture, down to a minimum of about 0.6 pits per cell. The residual pit formation in the presence of saturating bafilomycin represents the pitting, which cannot be prevented by inhibition of acid transport starting after 24 h of culture and thus would represent the minimal level one would expect from complete inactivation of the ruffled border chloride conductance. Because bone resorption is dependent on acid transport, we presume this residual pit formation in the presence of bafilomycin is caused by the ability of a fraction of the cells to initiate a pit within 24 h. It is important to note that this method of assessing pit formation makes no measure of pit area or depth. Thus, large differences in total bone resorbed may be masked if an inhibited cell is capable of initiating a pit, no matter how shallow. The comparison of bone pitting by cells exposed to oligonucleotides, bafilomycin, or control, indicates that antisense suppression of p62 results in a decrease in the ability of the cells to generate pits on bone to about 50% of the maximal extent of inhibition seen with bafilomycin. These data demonstrate that antisense suppression of p62 not only decreases acid transport activity in isolated membrane vesicles, but also has a meaningful effect on the integrated function of osteoclasts.
CLIC-5b, ClC-7, and the Ruffled Border Chloride Conductance
Prior evidence had led us to hypothesize that p62 is the ruffled border chloride channel: p62 co-purifies with chloride channel activity isolated ruffled border (13); expression of p62 is correlated with the appearance of short circuiting chloride conductance in differentiating osteoclasts in culture (15); and p62 is antigenically related to a family of known chloride channels (14, 15). The experiments reported here, that is, the identification of p62 as CLIC-5b, and the suppression of CLIC-5b using antisense oligonucleotides with the coincident loss of short circuiting chloride conductance and decrease in bone resorption, further support the proposed role of CLIC-5b in osteoclasts. However, recent reports indicate that a different lysosomal chloride channel protein, ClC-7, is required for normal bone resorption by mammalian osteoclasts (16, 64). Subsequently, osteoclasts from one patient with mutations of ClC-7 were reported to have normal acidification of the bone resorption compartment in culture (21). In ClC-7−/− mice lysosomal pH remains acidic and correction of the ClC-7 defect in osteoclasts reverses the bone resorption defect but not the neuro-degeneration and lysosomal storage phenotype seen in cultured neurons from these animals (65). Both CLIC-5b or ClC-7 have been immunolocalized to the ruffled border, both are members of families of known chloride channel or transporter proteins, and for both, suppression of expression leads to decreased bone resorption. It is unclear if these observations represent conflicting data or, as seems more likely, the regulation of acidification and bone resorption are complex processes with multiple sites where chloride transport can exert an influence. CLIC-5b and ClC-7 could be cooperating components of anion transport activity in the ruffled border membrane that supports bone resorption. Alternatively ClC-7 and/or CLIC-5b could carry out non-redundant essential functions in the endomembranes during the cycle of osteoclast differentiation and bone resorption.
A potential resolution of this question is indicated by recent studies on the transport mechanism of the intracellular subgroup of the ClC channel family. These studies indicate that ClC-3, -4., and -5 are anion/H+ exchange transporters whose activity will increase the membrane potential (66, 67). The transport activity of ClC-7 has not been defined and therefore how it supports lysosomal and osteoclast function remains unclear (16, 64, 65). Our work supports the conclusion that the CLIC-5b channel supports acidification in avian osteoclasts and is consistent with the results from ClC-7 mutant animals (21, 65).
c-Src, Cytoskeleton, and Osteoclast Bone Resorption
The genetic disruption of c-Src expression leads to osteopetrosis in vivo (25, 26) and dramatically decreases the ability of osteoclasts to resorb bone in vitro (68). c-Src is important in osteoclast signaling (27–29, 33, 51, 69), polarization (30, 70–72) and survival (73–75) undoubtedly reflecting the global nature of cellular reorganization during osteoclast differentiation. Many of the Src effects upon osteoclasts derive from the importance of the cytoskeleton for osteoclast movement and bone attachment (70–72, 76). The disruption of cortactin, a c-Src substrate, has been shown to inhibit osteoclast bone resorption.3 To resorb bone the osteoclast must secret sufficient H+ across the ruffled border membrane to dissolve the alkaline bone mineral (4). In mature osteoclasts c-Src and F-actin are concentrated along the H+-secreting ruffled border (33, 77) and the v-H+-ATPase and Src co-localize with the cytoskeleton (78). Recently CLIC-5 protein has been shown to associate with F-actin and specifically the c-Src substrate ezrin in placental microvilli (42). We have studied binding between CLIC-5b and c-Src as well as the relationship between c-Src suppression and H+ transport in osteoclast membranes. Previously bovine CLIC-5b was reported to bind to and be phosphorylated by Fyn (31); however, the relationship between c-Src and acid transport in osteoclasts has not been studied directly.
Interaction of p62 with Src Domains
Because c-Src knockout mice fail to assemble a functional ruffled membrane, we hypothesized that one role of c-Src in osteoclasts might have to do with assembly or activation of components of the ruffled membrane acid transport mechanism. Using immobilized Src homology domains as bait, we found that CLIC-5b in solubilized osteoclast membrane preparations is a ligand for both the SH2 and SH3 domains of Src. Pretreatment of solubilized osteoclast membranes with alkaline phosphatase eliminated the SH2 but not SH3 domain binding by CLIC-5b, consistent with SH2 binding being dependent on tyrosine phosphorylation of CLIC-5b as previously observed (31). The observation that CLIC-5b can bind to each of SH2 and SH3 domains of c-Src suggests an additional possible role for this interaction. Binding to both SH2 and SH3 domains of Src activates the c-Src tyrosine kinase by disrupting an intramolecular phosphotyrosine association (79–81). In osteoclasts Src kinase activity is important to maintain viable bone-resorbing cells (51, 73, 82).
These studies indicate that p62 is capable of binding Src homology domains in vitro. To determine whether CLIC-5b and c-Src form stable complexes in vivo, we used our p62 antisera and immunoprecipitated kinase activity, which labels at least 3 proteins in the immunoprecipitate, one of which is approximately the same size as c-Src itself. However, the identity of the kinase pulled-down by CLIC-5b is undetermined. We do not see labeling of CLIC-5b by the kinase activity in these precipitates but we showed above that osteoclast CLIC-5b binding to Src SH2 domain was alkaline phosphatase-sensitive. Therefore phosphorylation of this site would be precluded in Src-bound CLIC-5b.
Suppression of c-Src and Acid Transport
In a completely novel study we looked at the effect of suppression of c-Src expression during osteoclast differentiation in culture on the acidification of isolated membrane reconstituted into vesicles. For antisense suppression of c-Src, we used methods identical to those previously reported to effectively suppress c-Src in this same cell preparation (33) and we confirmed suppression of steady state Src levels by Western blotting. We found that c-Src suppression did not reduce osteoclast number in our cultures (83, 84), and had consequences similar to that of CLIC-5b suppression, with decreased acidification in the absence of valinomycin and rescue of acidification with valinomycin. As with the CLIC-5b suppression, this indicates a loss in the chloride conductance without a significant change in proton pump activity. However, c-Src suppression had no effect on the level of CLIC-5b as detected on Western blots. The control level of total quenching seen reflects slight retention of chloride channel activity in these vesicles and is consistent with our partial suppression of Src levels.
Our studies of vesicle acidification suggest a role for c-Src to bring together a chloride conductance and the proton pump in the membranes of osteoclasts. This could result from activation of the chloride channel in pump containing membranes or physical approximation of the active channel and pump. Previously CLIC-4 and -5 proteins and the v-H+-ATPase have been shown to associate with cytoskeleton proteins that are c-Src substrates (42, 78, 85). In these studies the proton pump is found in cytoskeletal-associated vesicles while the soluble CLIC-proteins directly interact with F-actin-based structures. In this model channel activity results when the CLIC protein is inserted into the F-actin-associated membranes (42, 59, 86). Src family tyrosine kinases as well as SH2 and SH3 interactions have now been implicated regulation of a number of ion channels through a variety of mechanisms (31, 87–91). These mechanisms include direct regulation of channel activity through phosphorylation, as well as targeting of channel proteins to the appropriate membrane compartment via SH2 and/or SH3 interactions. Immunohistochemistry of CLIC protein and v-H+-ATPase protein in our cultured osteoclasts supports the functional data and indicates that c-Src suppression reduces their colocalization in the membranes of intracellular vesicles.
The mechanism by which c-Src delivers chloride channels to the ruffled border membrane remains to be determined. However the valinomycin rescue of acidification rules out a concerted modulation of channel and proton pump activity. The fact that CLIC-5b is a ligand for both SH2 and SH3 domains of Src, and the similarity in the transport properties of membranes from cells in which either CLIC-5b or c-Src has been suppressed suggest it is a Src-mediated transfer of CLIC-5b to the ruffled border that allows acid transport. This means that in addition to the several effects of Src on osteoclast survival, motility and bone attachment it has a direct effect on the assembly of a functional acidification apparatus in osteoclasts.
Acknowledgments
We thank Dr. Andrey Shaw, Department of Pathology, Washington University, for helpful discussions.
Footnotes
This work was supported by National Institutes of Health Grant AR4653904.
The abbreviations used are: DNDS, 4,4′-diisothiocyanatostilbene-2,2′-disulfonate; RT-PCR, reverse transcription-polymerase chain reaction; PIPES, 1,4-piperazinediethanesulfonic acid; PBS, phosphate-buffered saline; GST, glutathione S-transferase; AP656, affinity-purified polyclonal antibody to CLIC-5b; E11, antibody to 31-kDa subunit of H+-ATPase.
J. Cooper, personal communication.
References
- 1.Blair HC, Zaidi M, Schlesinger PH. Biochem J. 2002;364:329–341. doi: 10.1042/BJ20020165. [DOI] [PMC free article] [PubMed] [Google Scholar]
- 2.Teitelbaum SL. Science. 2000;289:1504–1508. doi: 10.1126/science.289.5484.1504. [DOI] [PubMed] [Google Scholar]
- 3.Schlesinger P, Mattsson J, Blair H. Miner Electrolyte Metab. 1994:31–39. [PubMed] [Google Scholar]
- 4.Cho G, Wu Y, Ackerman JL. Science. 2003:1123–1127. doi: 10.1126/science.1078470. [DOI] [PubMed] [Google Scholar]
- 5.Neuman WF, Neuman MW. The Chemical Dynamics of Bone Mineral. The University of Chicago Press; Chicago, IL: 1958. [Google Scholar]
- 6.Väänänen HK, Zhao H, Mulari M, Halleen JM. J Cell Science. 2000;113:377–381. doi: 10.1242/jcs.113.3.377. [DOI] [PubMed] [Google Scholar]
- 7.Baron R, Neff L, Louvard D, Courtnoy P. J Cell Biol. 1985:2210–2222. doi: 10.1083/jcb.101.6.2210. [DOI] [PMC free article] [PubMed] [Google Scholar]
- 8.Silver I, Murrills R, Etherington D. Exp Cell Res. 1988;175:266–276. doi: 10.1016/0014-4827(88)90191-7. [DOI] [PubMed] [Google Scholar]
- 9.Blair H, Teitelbaum S, Ghiselli R, Gluck S. Science. 1989;245:855–857. doi: 10.1126/science.2528207. [DOI] [PubMed] [Google Scholar]
- 10.Blair HC, Teitelbaum SL, Tan HL, Koziol CM, Schlesinger PH. Am J Physiol. 1991;260:C1315–C1324. doi: 10.1152/ajpcell.1991.260.6.C1315. [DOI] [PubMed] [Google Scholar]
- 11.Mattsson JP, Schlesinger PH, Keeling DJ, Teitelbaum SL, Stone DK, Xie XS. J Biol Chem. 1994;269:24979–24982. [PubMed] [Google Scholar]
- 12.Lee BS, Holliday LS, Ojikutu B, Krits I, Gluck SL. Am J Physiol. 1996:C382–C388. doi: 10.1152/ajpcell.1996.270.1.C382. [DOI] [PubMed] [Google Scholar]
- 13.Blair H, Schlesinger P. Biochem Biophys Res Commun. 1990;171:920–925. doi: 10.1016/0006-291x(90)90771-e. [DOI] [PubMed] [Google Scholar]
- 14.Edwards J, Tulk B, Schlesinger P. J Membr Biol. 1998;163:119–127. doi: 10.1007/s002329900376. [DOI] [PubMed] [Google Scholar]
- 15.Schlesinger P, Blair H, Teitelbaum S, Edwards J. J Biol Chem. 1997;272:18636–18643. doi: 10.1074/jbc.272.30.18636. [DOI] [PubMed] [Google Scholar]
- 16.Kornak U, Kasper D, Bosl M, Kaiser E, Schweizer M, Schulz A, Friedrich W, Delling G, Jentsch TJ. Cell. 2001;104:205–215. doi: 10.1016/s0092-8674(01)00206-9. [DOI] [PubMed] [Google Scholar]
- 17.Jentsch TJ, Stein V, Weinreich F, Zdebik AA. Physiol Rev. 2002;82:503–568. doi: 10.1152/physrev.00029.2001. [DOI] [PubMed] [Google Scholar]
- 18.Kong YY, Yoshida H, Sarosi I, Tan HL, Timms E, Capparelli C, Morony S, Santos A, Van G, Itie A, Khoo W, Wakeham A, Dunstan CR, Lacey DL, Mak TW, Boyle WJ, Penninger JM. Nature. 1999;397:315–323. doi: 10.1038/16852. [DOI] [PubMed] [Google Scholar]
- 19.Yoshida H, Hayashi S, Kunisada T, Ogawa M, Nishikawa S, Okamura H, Sudo T, Shultz LD, Nishikawa S. Nature. 1990;345:442–444. doi: 10.1038/345442a0. [DOI] [PubMed] [Google Scholar]
- 20.Sobacchi C, Frattini A, Orchard P, Porras O, Tezcan I, Andolina M, Babul-Hirji R, Baric I, Canham N, Chitayat D, Dupuis-Girod S, Ellis I, Etzioni A, Fasth A, Fisher A, Gerritsen B, Gulino V, Horwitz E, Klamroth V, Lanino E, Mirolo M, Musio A, Matthijs G, Nonomaya S, Notarangelo LD, Ochs HD, Superti Furga A, Valiaho J, van Hove JLK, Vihinen M, Vujic D, Vezzoni P, Villa A. Hum Mol Genet. 2001;10:1767–1773. doi: 10.1093/hmg/10.17.1767. [DOI] [PubMed] [Google Scholar]
- 21.Blair HC, Borysenko CW, Villa A, Schlesinger PH, Kalla SE, Yaroslavskiy BB, Garcia-Palacios V, Oakley JI, Orchard PJ. J Bone Min Res. 2004;19:1329–1338. doi: 10.1359/JBMR.040403. [DOI] [PubMed] [Google Scholar]
- 22.Roodman D. Exp Hematol. 1999;27:1229–1241. doi: 10.1016/s0301-472x(99)00061-2. [DOI] [PubMed] [Google Scholar]
- 23.Horne W, Neff L, Chatterjee D, Lomri A, Levy J, Baron R. J Cell Biol. 1992;119:1003–1013. doi: 10.1083/jcb.119.4.1003. [DOI] [PMC free article] [PubMed] [Google Scholar]
- 24.Tanaka S, Takahashi N, Udagawa N, Saski T, Fukui Y, Kurokawa T, Suda T. FEBS Lett. 1992;313:85–89. doi: 10.1016/0014-5793(92)81190-w. [DOI] [PubMed] [Google Scholar]
- 25.Soriano P, Montgomery C, Geske R, Bradley A. Cell. 1991;64:693–702. doi: 10.1016/0092-8674(91)90499-o. [DOI] [PubMed] [Google Scholar]
- 26.Boyce B, Yoneda T, Lowe C, Soriano P, Mundy G. J Clin Investig. 1992;90:1622–1627. doi: 10.1172/JCI116032. [DOI] [PMC free article] [PubMed] [Google Scholar]
- 27.Tanaka S, Amling M, Neff L, Peyman A, Uhlmann E, Levy J, Baron R. Nature. 1996;383:528–531. doi: 10.1038/383528a0. [DOI] [PubMed] [Google Scholar]
- 28.Yoneda T, Lowe C, Lee C, Gutierrez G, Niewolna M, Williams P, Izbicka E, Uehara Y, Mundy G. J Clin Investig. 1993;91:2791–2795. doi: 10.1172/JCI116521. [DOI] [PMC free article] [PubMed] [Google Scholar]
- 29.Sahni M, Zhou X, Bakiri L, Schlessinger J, Baron R, Levy J. J Biol Chem. 1996;271:3141–3147. doi: 10.1074/jbc.271.51.33141. [DOI] [PubMed] [Google Scholar]
- 30.Nakamura I, Rodan GA, Duong LT. J Electron Microsc. 2003;52:527–533. doi: 10.1093/jmicro/52.6.527. [DOI] [PubMed] [Google Scholar]
- 31.Edwards JC, Kapadia S. J Biol Chem. 2000;275:31826–31832. doi: 10.1074/jbc.M005275200. [DOI] [PubMed] [Google Scholar]
- 32.Blair H, Kahn A, Crouch E, Jeffery J, Teitelbaum S. J Cell Biol. 1986;102:1164–1172. doi: 10.1083/jcb.102.4.1164. [DOI] [PMC free article] [PubMed] [Google Scholar]
- 33.Chellaiah M, Fitzgerald C, Alvarez U, Hruska K. J Biol Chem. 1998;273:11908–11916. doi: 10.1074/jbc.273.19.11908. [DOI] [PubMed] [Google Scholar]
- 34.Barry E, Gesek F, Friedman P. BioTechniques. 1993;15:1016–1018. [PubMed] [Google Scholar]
- 35.Dempster D, Murrills R, Horbert W, Arnett T. Bone and Min Res. 1987;2:443–448. doi: 10.1002/jbmr.5650020512. [DOI] [PubMed] [Google Scholar]
- 36.Arnett T, Dempster D. Endocrinology. 1987;120:602–608. doi: 10.1210/endo-120-2-602. [DOI] [PubMed] [Google Scholar]
- 37.Bastani B, Ross F, Kopito R, Gluck S. Calcified Tissue Internat. 1996;58:332–336. doi: 10.1007/BF02509381. [DOI] [PubMed] [Google Scholar]
- 38.Richard S, Yu D, Blumer KJ, Hausladen D, Olszowy MW, Connelly PA, Shaw AS. Mol Cell Biol. 1995;15:186–197. doi: 10.1128/mcb.15.1.186. [DOI] [PMC free article] [PubMed] [Google Scholar]
- 39.Clerc S, Barenholz Y. Anal Biochem. 1998;259:104–111. doi: 10.1006/abio.1998.2639. [DOI] [PubMed] [Google Scholar]
- 40.Grabe M, Oster G. J Gen Physiol. 2001;117:329–343. doi: 10.1085/jgp.117.4.329. [DOI] [PMC free article] [PubMed] [Google Scholar]
- 41.Heiss NS, Poustka A. Genomics. 1997;45:224–228. doi: 10.1006/geno.1997.4922. [DOI] [PubMed] [Google Scholar]
- 42.Berryman M, Bruno J, Price J, Edwards JC. J Biol Chem. 2004;279:34794–34801. doi: 10.1074/jbc.M402835200. [DOI] [PubMed] [Google Scholar]
- 43.Chuang J, Milner T, Zhu M, Sung C. J Neurosc. 1999;19:2919–2928. doi: 10.1523/JNEUROSCI.19-08-02919.1999. [DOI] [PMC free article] [PubMed] [Google Scholar]
- 44.Valenzuela SM, Martin DK, Por SB, Robbins JM, Warton K, Bootcov MR, Schofield PR, Campbell TJ, Breit SN. J Biol Chem. 1997;272:12575–12582. doi: 10.1074/jbc.272.19.12575. [DOI] [PubMed] [Google Scholar]
- 45.Duncan R, Westwood P, Boyd M, Ashley R. J Biol Chem. 1997;272:23880–23886. doi: 10.1074/jbc.272.38.23880. [DOI] [PubMed] [Google Scholar]
- 46.Prallet B, Male P, Neff L, Baron R. J Bone Min Res. 1992;7:405–414. doi: 10.1002/jbmr.5650070408. [DOI] [PubMed] [Google Scholar]
- 47.Alvarez J, Teitelbaum S, Blair H, Greenfield E, Athanasou N, Ross F. Endocrinology. 1991;128:2324–2335. doi: 10.1210/endo-128-5-2324. [DOI] [PubMed] [Google Scholar]
- 48.Sundquist K, Lakkakorpi P, Wallmark B, Väänänen K. Biochem Biophys Res Commun. 1990;168:309–313. doi: 10.1016/0006-291x(90)91709-2. [DOI] [PubMed] [Google Scholar]
- 49.Roskoski R. Biochem Biophys Res Commun. 2004;324:1155–1164. doi: 10.1016/j.bbrc.2004.09.171. [DOI] [PubMed] [Google Scholar]
- 50.Harrison SC. Cell. 2003;112:737–740. doi: 10.1016/s0092-8674(03)00196-x. [DOI] [PubMed] [Google Scholar]
- 51.Recchia I, Rucci N, Funari A, Migliaccio S, Taranta A, Longo M, Kneissel M, Šuša M, Fabbro D, Teti A. Bone. 2004;34:65–79. doi: 10.1016/j.bone.2003.06.004. [DOI] [PubMed] [Google Scholar]
- 52.Henriksen K, Gram J, Schaller S, Dahl BH, Dziegiel MH, Bollerslev J, Karsdal MA. Am J Pathol. 2004;164:1537–1545. doi: 10.1016/S0002-9440(10)63712-1. [DOI] [PMC free article] [PubMed] [Google Scholar]
- 53.Orchard PJ, Schlesinger PH, Blair H. Am Soc Bone Miner Res. 2002:SA390. [Google Scholar]
- 54.Inoue M, Yoshida H, Akisaka T. Cell Tissue Res. 1999;298:527–537. doi: 10.1007/s004419900102. [DOI] [PubMed] [Google Scholar]
- 55.Carano A, Teitelbaum S, Konsek J, Schlesinger P, Blair H. J Clin Investig. 1990;85:456–461. doi: 10.1172/JCI114459. [DOI] [PMC free article] [PubMed] [Google Scholar]
- 56.Toyomura T, Oka T, Yamaguchi C, Wada Y, Futai M. J Biol Chem. 2000;275:8760–8765. doi: 10.1074/jbc.275.12.8760. [DOI] [PubMed] [Google Scholar]
- 57.Mattsson JP, Li X, Peng SB, Nilsson F, Adersen P, Lundberg LG, Stone DK, Keeling DJ. Euro J Biochem. 2000;267:4115–4126. doi: 10.1046/j.1432-1327.2000.01445.x. [DOI] [PubMed] [Google Scholar]
- 58.Warton K, Tonini R, Fairlie WD, Matthews JM, Valenzuela SM, Qiu MR, Wu WM, Pankhurst S, Bauskin AR, Harrop SJ, Campbell TJ, Curmi PMG, Breit SN, Mazzantii M. J Biol Chem. 2002;277:26003–26011. doi: 10.1074/jbc.M203666200. [DOI] [PubMed] [Google Scholar]
- 59.Tulk BM, Kapadia S, Edwards JC. Am J Physiol. 2002;282:C1103–C1112. doi: 10.1152/ajpcell.00402.2001. [DOI] [PubMed] [Google Scholar]
- 60.Li X, Weinman SA. Annu Rev Physiol. 2002;64:609–633. doi: 10.1146/annurev.physiol.64.090501.145429. [DOI] [PubMed] [Google Scholar]
- 61.Nishizawa T, Nagao T, Iwatsubo T, Forte JG, Urushidani T. J Biol Chem. 2000;275:11164–11173. doi: 10.1074/jbc.275.15.11164. [DOI] [PubMed] [Google Scholar]
- 62.Fernandez-Salas E, Sagar M, Cheng C, Yuspa SH, Weinberg WC. J Biol Chem. 1999;274:36488–36497. doi: 10.1074/jbc.274.51.36488. [DOI] [PubMed] [Google Scholar]
- 63.Landry D, Sullivan M, Nicolaides S, Redhead C, Edelman A, Field M, Al-Awqati Q, Edwards J. J Biol Chem. 1993;268:14948–14955. [PubMed] [Google Scholar]
- 64.Jentsch TJ, Poet M, Fuhrmann JC, Zdebik AA. Annu Rev Physiol. 2005;67:779–807. doi: 10.1146/annurev.physiol.67.032003.153245. [DOI] [PubMed] [Google Scholar]
- 65.Kasper D, Planells-Cases R, Fuhrmann JC, Scheel O, Zeitz O, Ruether K, Schmitt A, Poe M, Steinfeld R, Schweizer M, Kornak U, Jentsch TJ. EMBO J. 2005;24:1079–1091. doi: 10.1038/sj.emboj.7600576. [DOI] [PMC free article] [PubMed] [Google Scholar]
- 66.Picollo A, Pusch M. Nature. 2005;436:420–423. doi: 10.1038/nature03720. [DOI] [PubMed] [Google Scholar]
- 67.Scheel O, Zdebik AA, Lourdel S, Jentsch TJ. Nature. 2005;436:424–427. doi: 10.1038/nature03860. [DOI] [PubMed] [Google Scholar]
- 68.Boyce BF, Hughes DE, Wright KR, Xing L, Dal A. Lab Investig. 1999;79:83–93. [PubMed] [Google Scholar]
- 69.Blair E, Jordan S, Peterson G, Barnes S. J Cell Biochem. 1996;60:629–637. doi: 10.1002/(SICI)1097-4644(19960616)61:4%3C629::AID-JCB17%3E3.0.CO;2-A. [DOI] [PubMed] [Google Scholar]
- 70.Saltel F, Destaing O, Bard F, Eichert D, Jurdic P. Mol Biol Cell. 2004;15:5231–5241. doi: 10.1091/mbc.E04-06-0522. [DOI] [PMC free article] [PubMed] [Google Scholar]
- 71.Chellaiah MA. J Biol Chem. 2005;280:32930–32943. doi: 10.1074/jbc.M500154200. [DOI] [PubMed] [Google Scholar]
- 72.Bruzzaniti A, Neff L, Sanjay A, Horne WC, Camilli PD, Baron R. Mol Biol Cell. 2005;16:3301–3313. doi: 10.1091/mbc.E04-12-1117. [DOI] [PMC free article] [PubMed] [Google Scholar]
- 73.Xing L, Venegas AM, Chen A, Garrett-Beal L, Boyce BF, Varmus HE, Schwartzberg PL. Genes Dev. 2001;15:241–253. doi: 10.1101/gad.840301. [DOI] [PMC free article] [PubMed] [Google Scholar]
- 74.Lee SE, Chung WJ, Kwak HB, Chung CH, Kwack K, Lee ZH, Kim HH. J Biol Chem. 2001;276:49343–49349. doi: 10.1074/jbc.M103642200. [DOI] [PubMed] [Google Scholar]
- 75.Xing L, Schwartzberg P, Reddy S, Roodman G, Mundy G, Varmus H, Boyce B. J Bone Miner Res. 1996;11(S1):40. [Google Scholar]
- 76.Destaing O, Saltel F, Gilquin B, Chabadel A, Khochbin Ory S, Jurdic P. J Cell Sci. 2005:2901–2911. doi: 10.1242/jcs.02425. [DOI] [PubMed] [Google Scholar]
- 77.Nakamura I, Takahashi N, Sasaki T, Tanaka S, Udagawa N, Murakami H, Kimura K, Kabuyama Y, Kurokawa T, Suda T. FEBS Lett. 1995;361:79–84. doi: 10.1016/0014-5793(95)00153-z. [DOI] [PubMed] [Google Scholar]
- 78.Abu-Amer Y, Ross F, Schlesinger P, Tondravi M, Teitelbaum S. J Cell Biol. 1997;137:247–258. doi: 10.1083/jcb.137.1.247. [DOI] [PMC free article] [PubMed] [Google Scholar]
- 79.Thomas JW, Ellis B, Boerner RJ, Knight WB, White GC, Schaller MD. J Biol Chem. 1998;273:577–583. doi: 10.1074/jbc.273.1.577. [DOI] [PubMed] [Google Scholar]
- 80.Dalgarno DC, Botfield MC, Rickles RJ. Biopolymers. 1997;43:383–400. doi: 10.1002/(SICI)1097-0282(1997)43:5<383::AID-BIP4>3.0.CO;2-R. [DOI] [PubMed] [Google Scholar]
- 81.Xu W, Harrison SC, Eck MJ. Nature. 1997;385:595–602. doi: 10.1038/385595a0. [DOI] [PubMed] [Google Scholar]
- 82.Miyazaki T, Sanjay A, Neff L, Tanaka S, Horne WC, Baron R. J Biol Chem. 2004;279:17660–17666. doi: 10.1074/jbc.M311032200. [DOI] [PubMed] [Google Scholar]
- 83.Suda T, Takahashi N, Martin T. Endocr Rev. 1992;13:66–80. doi: 10.1210/edrv-13-1-66. [DOI] [PubMed] [Google Scholar]
- 84.Hawkins PT, Jackson TR, Stephens LR. Nature. 1992;358:157–159. doi: 10.1038/358157a0. [DOI] [PubMed] [Google Scholar]
- 85.Shanks RA, Larocca MC, Berryman M, Edwards JC, Urushidani T, Navarre J, Goldenring JR. J Biol Chem. 2002;277:40973–40980. doi: 10.1074/jbc.M112277200. [DOI] [PubMed] [Google Scholar]
- 86.Ashley RH. Mol Membr Biol. 2003;20:1–11. doi: 10.1080/09687680210042746. [DOI] [PubMed] [Google Scholar]
- 87.Hayashi T, Umemori H, Mishina M, Yamamoto T. Nature. 1999;397:72–76. doi: 10.1038/16269. [DOI] [PubMed] [Google Scholar]
- 88.Lepple-Wienhues A, Szabo I, Laun T, Kaba NK, Gulbins E, Lang F. J Cell Biol. 1998;141:281–286. doi: 10.1083/jcb.141.1.281. [DOI] [PMC free article] [PubMed] [Google Scholar]
- 89.Szabo I, Lepple-Wienhues A, Kaba KN, Zoratti M, Gulbins E, Lang F. Proc Natl Acad Sci U S A. 1998;95:6169–6174. doi: 10.1073/pnas.95.11.6169. [DOI] [PMC free article] [PubMed] [Google Scholar]
- 90.You X, Askalan R, Keil G, Salter M. Science. 1997;275:674–678. doi: 10.1126/science.275.5300.674. [DOI] [PubMed] [Google Scholar]
- 91.Holmes T, Fadool D, Ren R, Levitan I. Science. 1995;274:2089–2091. doi: 10.1126/science.274.5295.2089. [DOI] [PubMed] [Google Scholar]