

Abstract
The context in which a pattern is viewed can greatly affect its apparent contrast, a phenomenon commonly attributed to pooled contrast gain control processes. A low-contrast surround may slightly enhance apparent contrast, whereas increasing the contrast of the surround leads to a monotonic decline in contrast appearance. We ask here how the presence of a patterned surround affects the ability to perform fine, suprathreshold orientation, contrast, and spatial frequency discriminations as a function of surround contrast and phase. Our results revealed an unexpected dip in performance when center and surround were in-phase and similar in contrast. These results suggest that additional processes, perhaps those involved in scene segregation, play a role in contextual effects on discrimination.
1. Introduction
A fundamental question in pattern vision is that of contrast sensitivity regulation. Early in visual processing, cortical neurons respond to simple pattern information formed by changes in luminance over space. Their responses to a pattern are primarily determined by 1) stimulus contrast, 2) the match between the stimulus and receptive field/tuning properties of the neuron (spatial location, spatial frequency, orientation, and phase for static, achromatic stimuli), and 3) the state of adaptation of the neuron (contrast sensitivity). Typically, the function relating neural response rate to contrast is ogival, positively accelerating at low contrasts, and saturating at higher contrasts. A function of this form also describes human psychophysical discrimination performance as a function of contrast, when the task is based on small differences in spatial frequency or orientation between two simple sinusoidal gratings 1. Performance initially rises with contrast, but becomes independent of contrast at quite low contrasts (∼10%).
Historically, it had been widely presumed that this function reflected an accelerating nonlinearity followed by a form of within-pathway contrast gain control that reduces the neuron’s sensitivity to contrast as contrast increases, effectively adapting the cell to prevailing contrast levels. This process effectively keeps the ogival response functions centered at the prevailing contrast level, resulting in consistently high levels of performance 1-6. Furthermore, many modelers of pattern detection and discrimination made the simplifying assumption that different neural pathways with non-overlapping response ranges, such as very low and very high spatial frequencies or different preferred spatial locations, operated relatively independently of one another. Sensitivity was thought to be primarily governed by the independent, within-pathway processes described above, modeled by a static nonlinearity following linear filter stage. This view was supported by considerable data from both physiological studies and psychophysical studies performed at or near the detection threshold (see 7-9 for reviews).
However, empirical results from both neurophysiology and more recently, suprathreshold psychophysics, have demonstrated that the assumption of independent processing is not tenable. The physiological evidence is incontrovertible. Profound interactions occur among VI neurons, in some cases among those with very different tuning characteristics. A neuron’s activity can be modulated by stimuli which are spatially outside the cell’s classic spatial receptive field or outside its response range along other dimensions such as orientation or spatial frequency. That is, ongoing neural activity can be modulated by a stimulus that by itself does not activate a pathway. These interactions are thought to contribute to sensitivity regulation and perhaps the sharpness of tuning characteristics which permit us to make fine spatial discriminations 10-29. We will term these sources of sensitivity regulation between-pathways contrast gain control. Two notable neural models of cortical gain control postulate that the response of each neuron in a gain control network is reduced by the total activity in a pool of neurons that collectively have a broader response range along a number of dimensions than each individual neuron 4, 30.
It is now widely accepted that both within and between pathway gain control processes are needed to account for both the appearance and the ability to make fine discriminations between stimuli that are more complex than simple sinusoidal grating patches. Apparent contrast has been the most widely studied phenomenon with respect to lateral interactions 31-37, although a number of researchers have examined effects of flankers and other contextual stimuli on detection, while others have addressed contrast discrimination 38-48. Mareschal and her colleagues 49-51 have reported a number of results of contextual influences on coarse orientation judgments (2-4 degrees), which may be of relevance here. We save discussion of their results until the final section of the paper.
Although results are complex and vary among individuals, a general finding is that both facilitative and suppressive effects are found which depend upon both relative location and relative contrast of test and context patches. Suppressive effects are larger and occur more reliably among individuals than facilitation. Although pooled gain control models only predict suppressive effects, variations of the Albrecht and the Heeger neural models have been adapted into a number of psychophysical models to account for spatially remote contextual effects e.g.,52.
Previous psychophysical investigations into gain control mechanisms that mediate fine spatial and contrast discriminations among suprathreshold complex stimuli have been limited to effects that occurred when stimulus components that were very different in orientation or spatial frequency. Furthermore, the components were superimposed in space to form 2-dimensional surface textures and 1-dimensional edgelike stimuli 6, 36, 43, 53, 54. Effects of superimposed masks were always suppressive, except near the detection threshold. Olzak and Thomas 55 explicitly demonstrated the need for both within and between-pathway gain control processes in accounting for masking by parallel and orthogonal gratings in fine spatial frequency discriminations, and an adaptation of the Albrecht and Heeger neural models were able to account for these results as well.
The Thomas and Olzak 6, 36 models of gain control were developed to account for masking of discrimination performance by overlapping, non-informative components. In this model, the excitatory response of a neuron (a function of stimulus contrast) is modified by dividing its response by activity in a pool of responding neurons, which included spatially overlapping neurons tuned to a broad range of orientations and spatial frequencies. A test of this model using spatially localized, narrowband stimuli with little overlap in spatial frequency content, however, showed that contributions to the gain control pool rapidly diminished as stimuli became nonoverlapping 56. Nevertheless, a normalization model of the same general form (though with a different pool of neurons contributing to sensitivity regulation) was successfully used by Xing and Heeger 52 to account for apparent contrast.
In the present paper, we ask whether a modified version of the Xing and Heeger formulation might account for contextual effects on spatial discrimination performance. We use the Xing and Heeger formulation as a simple example of an entire class of models e.g.,57, 58-60 that might better capture some aspects of the data (i.e., facilitation at low surround contrasts). However, to our knowledge, all current models of gain control would predict for our conditions a monotonically declining function once surround contrast exceeds center contrast.
In the set of experiments reported here, we examined performance (d’) on fine suprathreshold spatial discrimination tasks based on small (hyperacuity level) differences in either the spatial frequency or orientation of a central target disk, as a function of surround contrast and the relative phases of center and surround. For comparison purposes, observers also made discriminations based on contrast, although it has been pointed out that a single model cannot account for how both extensive and intensive discriminations vary with contrast 61.
2. Model
The model we will consider is a modified hybrid of the Xing and Heeger apparent contrast model 52 and a portion of the Thomas and Olzak 6, 36 discrimination model, simplified to account for the experiments at hand. The Xing and Heeger model explicitly considers contributions from both the center test disk and the laterally displaced surround. The surround may have both excitatory and suppressive effects, as shown by contributions to the numerator and the denominator of Eq. 1, respectively. Eq. 1 below shows the modified Xing and Heeger model, taken from their Eq. 4 with one added parameter to permit its application to a discrimination task.
| (1) |
where Rt is the response to the center test disc, k is a constant, Ct and Cs are contrasts of the test and surround patterns, respectively, We and Wi are the enhancement and inhibitory weights, respectively, and a, p, pe, q, and qi are free parameters. The term St was added because in the discrimination model, differential sensitivity of the neuron(s) to the two patterns to be discriminated is necessary.
In order to link the neural model to discrimination performance and the performance measure d’ , we make assumptions identical to those proposed in the decision stage of the Olzak and Thomas 36 model. We assume that discriminating between two alternative patterns is accomplished by differencing the output of two neurons (or groups of neurons) that give the greatest differential response to the two patterns to be discriminated. This generates a single decision variable D, linking the model to standard signal detection theory and permitting calculation of d’.
| (2) |
where RtA and RtB are responses to the two test patterns A and B.
Up to this point, we have ignored the role of noise in processing. In earlier work, however, it has been shown that in fine spatial discriminations, the decision variable appears to be normally distributed and is equally variable in the two channels. Thus, we can represent d’ as the difference in expected values of the random decision variable distributions that arise in response to patterns A and B, divided by the standard deviation of the responses in Eq. 2
| (3) |
Embodied in Eq. 3 are the assumptions that noise is Gaussian with unit variance regardless of which stimulus was presented. The Gaussian assumption has been tested many times for discrimination tasks such as ours, and the equal-variance assumption holds valid as well 62.
Figure 1 shows the output of a simulation of the model applied to discrimination performance. Parameter values published by Xing and Heeger 52 were used in the simulation. Estimates that differed between the two observers were averaged, and the enhancement and facilitation weights were taken from the wide-surround configuration.
Fig 1.
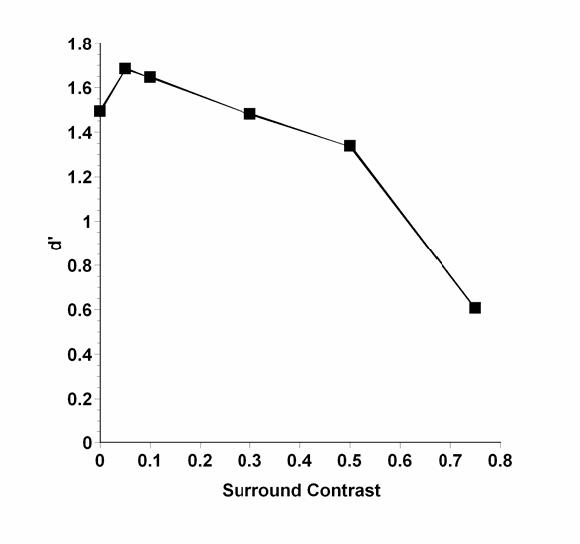
Predicted relative d’ for discrimination performance as a function of surround contrast.
Contrast of the test disk was held constant at 0.1, as in our experiments. Surround contrast varied between 0 (control) and 0.75, although in the actual experiment the highest surround contrast was 0.5. . In order to apply the output to discrimination, the added sensitivity parameter was given a value of 1.0 (Xing and Heeger model exactly) in response to the preferred pattern A and a value of 0.8 for the less-preferred pattern B. The resultant responses were differenced as in Equation 2 the resulting differences were then scaled by multiplying by a constant to approximate d’ and to move the curves into our approximate experimental operating range.
The important points to notice in this predicted performance curve are that 1) a small amount of enhancement occurs at surround contrasts equal to or lower than the 0.1 test contrast, and 2) at surround contrasts higher than the test contrast, performance is suppressed in a monotonically declining function.
3. Methods
3.1 Observers
The observers were three undergraduate volunteers who were naïve to the purpose of the experiments and three undergraduate research assistants who were aware (KAE, AMC, and JLH). Each had normal vision or was corrected to normal by spectacles. All were between the ages of 19 and 22. Observers KAE and AMC were males; observers JLH, ECG, JAW and KDS were females. Not all observers participated in all experiments.
3.2 Stimuli, Apparati and Procedures
A custom program using a Genus graphics package interfaced with a C program was used to compute and draw stimuli pixel-by-pixel, as well as to control the experiment. Software was run on a Dell Dimension XPS R450. Stimuli were presented on a 17“ ViewSonic Profession Series PS775 monitor, which was linearized through software and empirically confirmed. The mean luminance of the display was 19.2 cd/m2. The monitor was equipped with video attenuators tied together in a summing circuit to generate more than adequate gray levels 63. A resolution level of 120 pixels per degree was achieved at a viewing distance of 3.5 m. Viewing was free and binocular.
Figure 2 shows examples of a control stimulus (panel A) and test stimuli with surrounds of lower (panel B), equal (panel C), or higher (panel D) contrast. The test stimuli were 40-minute, sharp-edged circular patches of vertical (or near-vertical when discrimination judgments were made on the basis of orientation) sinusoidal grating at or near 4 cpd. Test contrast was held constant at 0.10, except in one instance when it was lowered to 0.05 in an external control experiment. In control conditions of the main experiment, the surround was uniform at the mean luminance level (Michelson contrast = 0). In test conditions, a 3-deg diameter grating of varying contrast levels (0.025, 0.05, 0.10, 0.30, and 0.50) surrounded the test patch, filling the display screen. The surround was either in phase or 180 deg out of phase with the center, and was always exactly vertical and 4.0 cpd.
Fig 2.
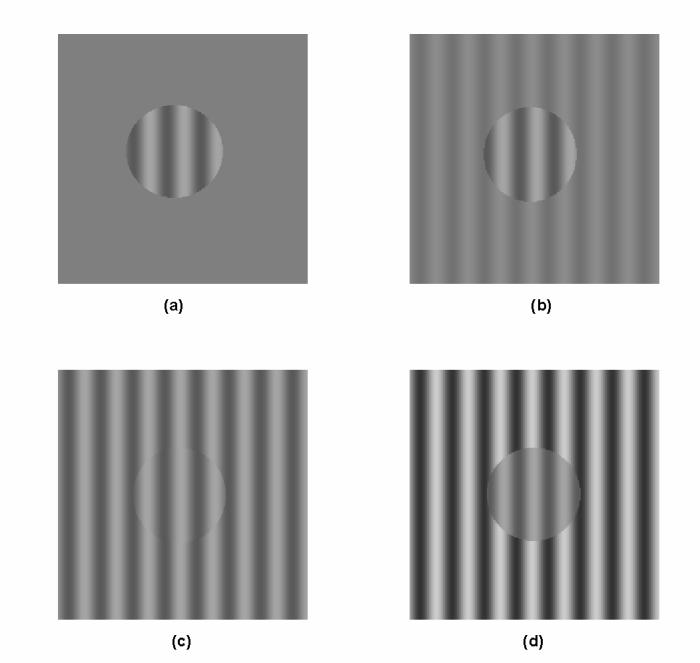
Examples of stimuli used in the experiments. Note that the centers are slightly different either in spatial frequency or orientation from the surround. This difference has been greatly exaggerated for the figure, and therefore apparent contours or phase shifts are visible here, but not in the actual experiment. Examples are for spatial frequency judgments. Only one of the pair to be discriminated is shown in each case. Panel A: control pattern with unmodulated surround. Panel B: Same as A but with an example of a lower-contrast surround. Panel C: Same as A but with same-contrast surround. Panel D: Same as A but with an example of a higher-contrast surround.
Discriminations were always between two stimuli, which differed slightly along the dimensions of spatial frequency, orientation, or contrast in different experiments. The difference between the stimuli was individually determined and fixed to be identical in all conditions of the experiment; we were interested in how performance varied as a function of the surround. Each experiment was run twice; once with center and surround in phase, and once with center and surround 180 deg out of phase. Different surround contrast levels were run in separate blocks of 80 trials (40 of each stimulus, randomly intermingled), but the entire set of six surround contrasts was run in a single session each day. Trial pacing was brisk so that a single block of trials took approximately five to seven minutes. Sessions were replicated over five days following extensive practice. Observers were free to rest between blocks. Missed trials were re-fed, and feedback as to which stimulus had actually been presented was given.
Observers ran in a dark room lit only with a shielded lamp placed behind the plane of the display screen. Following an initial dark-adaptation period, observers began the session in a preview mode, during which each stimulus could be triggered and viewed for 500 ms. Preview presentations were unlimited. When observers were satisfied, they pressed a key to begin the experimental session. On a given trial, one of the two stimuli to be discriminated was displayed for 500 ms with abrupt onset and offset, along with a concurrent mid-frequency tone. A five-second response period of silence ensued, allowing the observer to respond. Observers used a six-point rating scale to respond, rating their certainty that stimulus A or B had been presented. Ratings of 1 or 6 indicated certainty that A or B, respectively, had been presented. Ratings of 2 or 5 indicated a lesser degree of certainty about A or B respectively, and ratings of 3 or 4 indicated much uncertainty. Immediately upon response, a feedback tone sounded (low frequency, indicating stimulus A had been presented, or high frequency, indicating stimulus B had been presented), and the next trial began after a 1-second delay.
Prior to the experimental sessions in each study, discrimination thresholds for contrast, spatial frequency, or orientation judgments were determined individually with control stimuli, using the same procedure as was used in experimental sessions. Easy discriminations were gradually made more difficult until each observer’s performance stabilized at a d’ of approximately 1.2-1.5. Discrimination differences were in the hyperacuity range for the extensive dimensions of orientation and spatial frequency (about ± 0.5 deg in orientation and ± .08 cpd in spatial frequency), and once determined, the differences between the two stimuli on the dimension of interest were fixed and identical in all conditions for a given observer.
Two pilot experiments were run in order to assess the effects of including a small gap (unmodulated at mean luminance) between center and surround, or windowing the center with a Gaussian blur to avoid edge effects. Blurring had the immediate effect of removing all interfering effects; performance remained approximately at control levels regardless of surround contrast. The gap, which we first introduced at a width of 0.5 min, as used experiments by Mareschal et al. 50, had a similar effect as the blur: interactions between surround and center were drastically reduced or eliminated. These diminished effects continued to gap widths as low as four min. We therefore chose to run our main studies with no gap between center and surround.
4. Results
The results found with contrast, orientation, and spatial frequency judgments are shown in Figures 3, 4 and 5, respectively.
Fig 3.
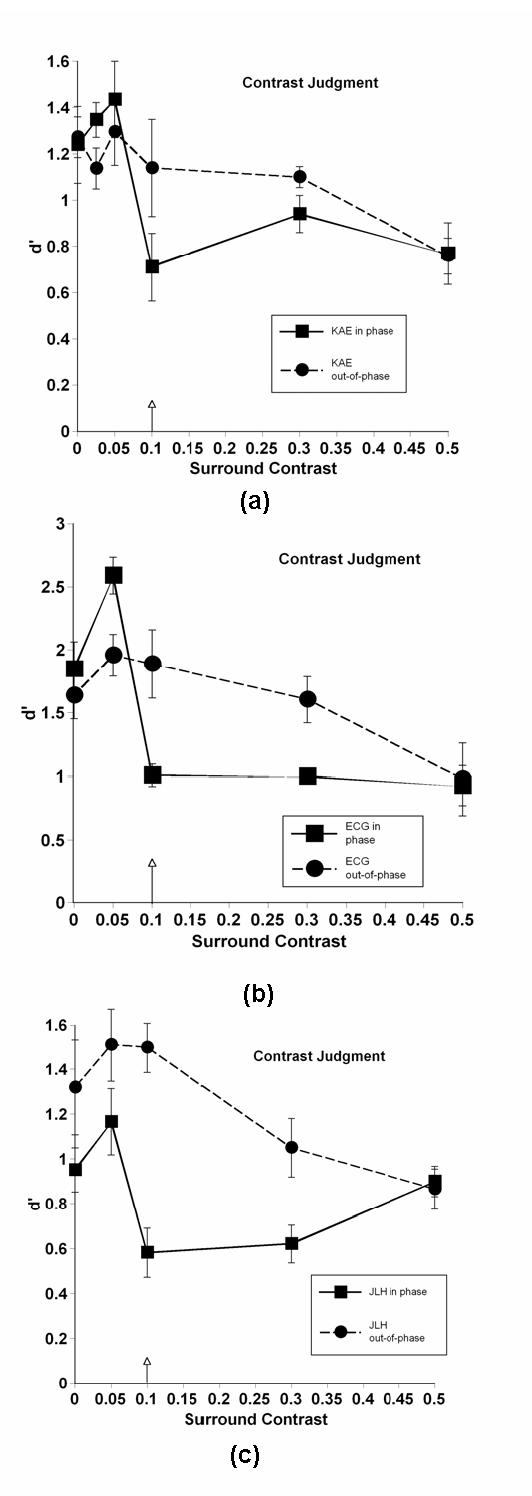
Contrast discrimination performance as a function of surround contrast. Arrow indicates the fixed 0.1 test contrast level (mean contrast for contrast discriminations). Different panels represent different observers.
Fig 4.
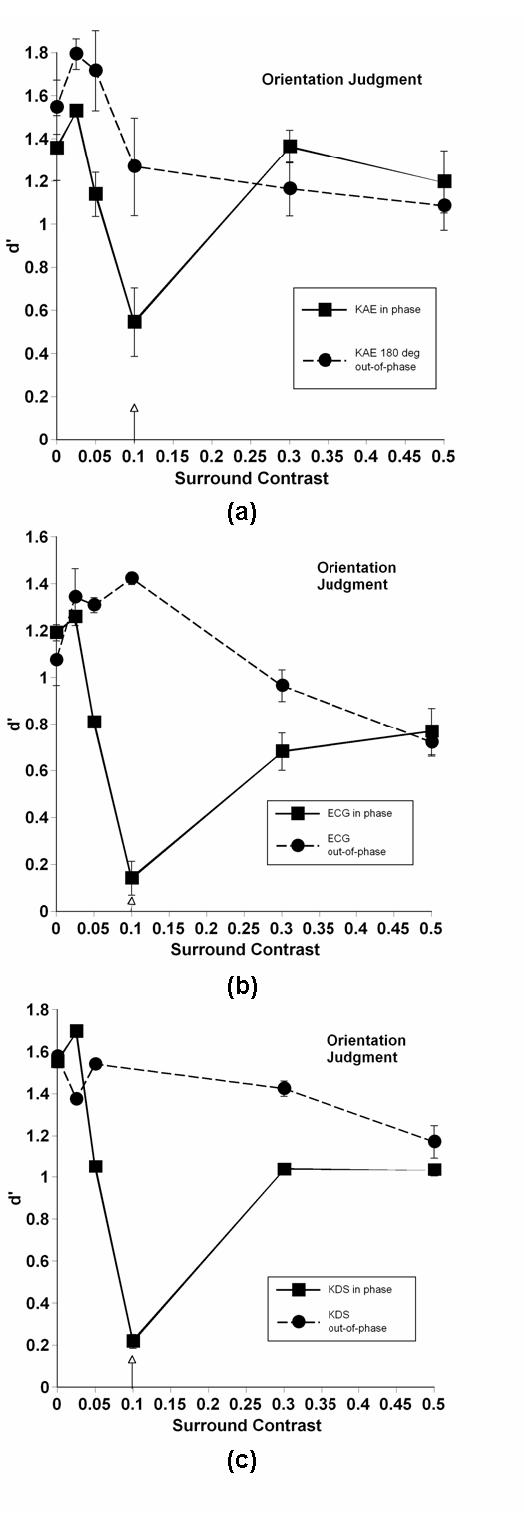
Same as 3, but for orientation judgments.
Fig 5.

Same as 3, but for spatial frequency judgments.
Different panels represent different observers. Note that due to rather large individual differences in effect sizes, the scales along the ordinate differ from observer to observer. The arrow indicates test contrast (in the case of contrast discriminations, the arrow actually represents the mean of the two slightly deviating test contrasts). The solid line (square symbols) denotes results when center and surround were in phase; the dashed line (circular symbols) represents out-of-phase results. Error bars represent ± 1 standard deviation, calculated from variations in d’ over days. Control performance (no surround) is denoted by the points on the ordinate. As would be expected, there were no significant differences in performance on control patterns in the two phase conditions.
The nature of the judgment (contrast, spatial frequency, or orientation) did not appear to influence the results of these experiments in any significant way; thus we have chosen to discuss patterns found in all data sets without regard to judgment type. The results depended heavily upon phase, on the contrast relationship between center and surround, and on individuals. Individual differences are commonly found when investigating lateral interactions by measures of apparent contrast 32, and our data sets confirmed this finding when using discrimination tasks. Despite these individual differences, clear patterns emerged in our data sets.
Out of Phase.
When center and surround were out of phase, the model may adequately describe performance for at least some observers. Most observers, but not all, showed a slight facilitation of performance relative to control at contrasts lower or equal to the test contrast. With increasing contrast, performance gradually fell for most observers, but again, individual differences were observed. In several cases, performance drops were either borderline or nonexistent, even at the highest contrast value. This result suggests that something possibly more complex than simple lateral interactions among a broadly tuned set of neurons is affecting performance, a point we shall return to in the discussion section.
In Phase.
When center and surround were in phase, a very different pattern of performance was observed. Like the out-of-phase data, the presence of a low-contrast surround led to a facilitation of discrimination performance for some, but not all observers. Those that did show facilitation generally showed larger effects than in the out of phase condition, a result not considered in the model. When test and mask contrasts were equal, however, performance plummeted, nearly to chance levels (d’ = 0) in many cases. Depending upon the individual, as contrast continued to increase, performance either remained at this low level, or it increased to leave a sharp notch in performance at the equal-contrast point, generally meeting up with out-of-phase performance at the highest contrast. This highly nonlinear pattern of results was not predicted by the model, and indeed, cannot be explained by any simple model of contrast gain control.
As a control to ensure that the in-phase plunge in performance depended on contrast equality and did not just reflect something odd about a mask contrast of 10% (which is about where performance becomes independent of contrast in spatial frequency and orientation judgments), observer ECG also performed the contrast discrimination task with a center contrast of 0.05 for the in-phase condition only. Her results are shown in Figure 6.
Fig 6.
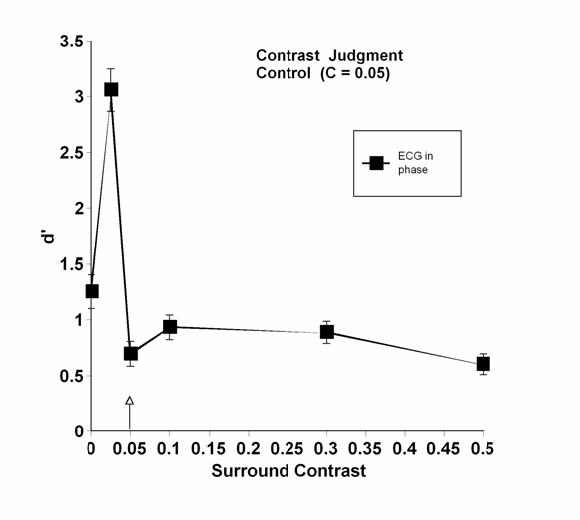
Contrast discrimination as a function of surround contrast in control condition. Note that the test contrast is now at 0.05. In-phase judgments only.
Whereas she had shown facilitation at a mask contrast of 0.05 in the original experiment (see Figure 2, panel C), now she showed the characteristic drop at a surround contrast of 0.05, equal to the center contrast in this control condition. Thus, it appears that the characteristic drop is a result of equal contrast between center and surround or of the stimulus configuration created by equality.
Discussion
It is clear from our results that a simple model of divisive gain control cannot account for the effects of a patterned surround on the ability to perform fine spatial discriminations. Although models of this form have previously been shown to account for contrast discrimination in a test + pedestal paradigm 43, 64, it is apparent in the current experiments that our procedure revealed an unexpected nonlinearity in processing when test and mask contrasts are equal and in phase. Furthermore, our results showed marked differences from previous results of apparent contrast experiments. It appears that the lateral interactions we observe in fine spatial discriminations have some elements in common with those reported for apparent contrast, but differ significantly in others.
We did observe evidence of both enhancement when surrounds were of lower contrast than the center and suppression (in most, but not all cases) when surround contrasts were higher. This might initially suggest that something like the Xing and Heeger model of apparent contrast, which includes both enhancing and suppressive elements, might be extended to account for contextual effects in fine spatial discriminations. A closer examination of the data, however, suggests otherwise.
We consistently found very different patterns of results when center and surround were in phase and when they were out of phase. The Xing and Heeger model does not address phase. There is some controversy in the apparent contrast literature on this point. Eijima and Takahashi 35 reported a phase dependence, but Solomon, Sperling & Chubb 37 reported no such dependence. The discrepancy in their reports may be due to the fact that Eijima and Takahashi used grating patterns, whereas Solomon et al. used isotropic spatial textures. Olzak and Laurinen 65, using an apparent contrast measure, demonstrated phase-specific effects with simple gratings but no such effects with plaids. Plaids are thought to stimulate higher-level mechanisms than those revealed by single gratings 36, 53, 54. A number of differences in processing of first- and second-order patterns has now been reported (e.g., see66). In this paper, we used first-order simple gratings, and our out-of-phase results are quite similar to those for other out-of-phase, first order test-surround relationships: masking effects were small and in some instances non-existent. In both cases, the empirical results with out-of-phase tests and surrounds are marginally consistent with those predicted by the Xing and Heeger model (and presumable others of this class), but the in-phase results were not.
When our test and mask were in phase, our results resembled none previously reported nor predicted. When patterns were in phase, there was an unexpected large reduction in performance when center and surround contrasts were equal. In some observers, performance remained at this low level; in others, a gradual recovery (but never to control levels) was seen.
It is difficult to account for the in-phase results in any simple manner. The results do not rule out the possibility of gain control processes such as those specified in the Xing and Heeger model. When taken together with the out-of-phase results, they rather suggest that something else in addition to spatially pooled gain control processes may come into play.
Mareschal, Sceniak and Shapley 50 have suggested that surround influences on center orientation signals depend not only upon low-level interactions, but also upon cues arising from image segmentation. This is certainly one possible explanation of our results, as well. However, their results and conclusions were quite different from our own, and it appears that they are tapping different processes than we are. They measured coarse orientation thresholds as a function of the orientation and spatial frequency of the surround stimulus. Their centers and surrounds were always equal in contrast (or equated for equal apparent contrast) and separated by a 0.5 degree gap. They found few interactions when surround differed structurally from test centers, with the greatest interaction when center and surround were similar, but different enough not to be perceived as a single surface behind an occluding gap. When seen as a single object, performance was as good as with a full screen single stimulus.
Our conditions and results were quite different. First, our thresholds were much lower, within the hyperacuity range. Coarse and fine orientation judgments are coded by different neural processes 67, and may be one reason our results are different from Mareschal’s. Second, our pilot work indicated that the interactive processes we were studying did not cross gaps. This is a clear indication that the processes we are studying differ from those of Mareschal et al. Third, unlike the Mareschal et al. results, our worst performance occurred when the center and surround appeared perceptually as a single object. Thus, although our results lead us to the speculation that processes in addition to low-level gain control are in operation, and possibly those involved in image segmentation, our results lead to an entirely different conclusion about the process than Mareschal et al.
In our scenario, the presence of perceptible edges, or mechanisms involved with scene segregation, may modify pooling in a gain control mechanism. When center and surround are out of phase, regardless of relative contrast, an illusory edge is visible, and center and surround are perceptually segregated. This segregation may reduce any effect of the surround upon discrimination performance in the perceptually distinct center. In the in-phase case, the center and surround are perceptually segregated by changes in contrast, except in the case of equal contrast. Although test disks always differ slightly from surrounds in either orientation or spatial frequency, these differences are so small that no edge is visible in the equal-contrast case, and the center appears to be assimilated by the background pattern, perhaps by a narrowly tuned mechanism that sums orientation, spatial frequency, and contrast signals along a collinear path. Summation along a pathway that includes not only the stimuli to be discriminated, but also large, vertical, 4.0 cpd surround masks (identical in the two stimuli) would greatly decrease the strength of the differential response to the two test stimuli, thus reducing performance.
Acknowledgments
ACKNOWLEDGMENTS. We wish to thank the following people for their time and patience participating in our experiments.
Kyle Eaton, Jessica High, Erin Grant, Kim Stricker, Andy Clark, Julie Wallace.
Footnotes
This research was supported in part by NIH grant EY13953Figure Captions
References
- 1.Thomas JP. Underlying psychometric function for detecting gratings and identifying spatial frequency. J Opt Soc Am. 1983;73(6):751–758. doi: 10.1364/josa.73.000751. [DOI] [PubMed] [Google Scholar]
- 2.Albrecht DG, Hamilton DB. Striate cortex of monkey and cat: contrast response function. J Neurophysiol. 1982;48(1):217–237. doi: 10.1152/jn.1982.48.1.217. [DOI] [PubMed] [Google Scholar]
- 3.Albrecht DG, Farrar SB, Hamilton DB. Spatial contrast adaptation characteristics of neurones recorded in the cat’s visual cortex. J Physiol. 1984;347:713–739. doi: 10.1113/jphysiol.1984.sp015092. [DOI] [PMC free article] [PubMed] [Google Scholar]
- 4.Albrecht DG, Geisler WS. Motion selectivity and the contrast-response function of simple cells in the visual cortex. Vis Neurosci. 1991;7(6):531–546. doi: 10.1017/s0952523800010336. [DOI] [PubMed] [Google Scholar]
- 5.Heeger DJ. Half-squaring in responses of cat striate cells. Vis Neurosci. 1992;9(5):427–443. doi: 10.1017/s095252380001124x. [DOI] [PubMed] [Google Scholar]
- 6.Thomas JP, Olzak LA. Contrast gain control and fine spatial discriminations. J Opt Soc Am A. 1997;14(9):2392–2405. doi: 10.1364/josaa.14.002392. [DOI] [PubMed] [Google Scholar]
- 7.DeValois RL, DeValois KK. Spatial Vision, Oxford Psychology Series. Oxford university Press; New York: 1990. [Google Scholar]
- 8.Graham N. v. S. Visual pattern analyzers, Oxford psychology series; no. 16. Oxford University Press; New York: 1989. [Google Scholar]
- 9.Olzak LA, Thomas JP. Seeing spatial patterns. In: Boff K, Kaufman L, Thomas J, editors. Handbook of Perception and Human Performance. John Wiley & Sons; New York: 1986. [Google Scholar]
- 10.Allison JD, Casagrande VA, Bonds AB. The influence of input from the lower cortical layers on the orientation tuning of upper layer V1 cells in a primate. Vis Neurosci. 1995;12(2):309–320. doi: 10.1017/s0952523800007999. [DOI] [PubMed] [Google Scholar]
- 11.Bauman LA, Bonds AB. Inhibitory refinement of spatial frequency selectivity in single cells of the cat striate cortex. Vision Res. 1991;31(6):933–944. doi: 10.1016/0042-6989(91)90201-f. [DOI] [PubMed] [Google Scholar]
- 12.Bonds AB. Role of inhibition in the specification of orientation selectivity of cells in the cat striate cortex. Vis Neurosci. 1989;2(1):41–55. doi: 10.1017/s0952523800004314. [DOI] [PubMed] [Google Scholar]
- 13.Bonds AB. Temporal dynamics of contrast gain in single cells of the cat striate cortex. Vis Neurosci. 1991;6(3):239–255. doi: 10.1017/s0952523800006258. [DOI] [PubMed] [Google Scholar]
- 14.Burr D, Morrone C, Maffei L. Intra-cortical inhibition prevents simple cells from responding to textured visual patterns. Exp Brain Res. 1981;43(34):455–458. doi: 10.1007/BF00238391. [DOI] [PubMed] [Google Scholar]
- 15.Burr DC, Ross J, Morrone MC. Local regulation of luminance gain. Vision Res. 1985;25(5):717–727. doi: 10.1016/0042-6989(85)90178-6. [DOI] [PubMed] [Google Scholar]
- 16.DeAngelis GC, Robson JG, Ohzawa I, Freeman RD. Organization of suppression in receptive fields of neurons in cat visual cortex. J Neurophysiol. 1992;68(1):144–163. doi: 10.1152/jn.1992.68.1.144. [DOI] [PubMed] [Google Scholar]
- 17.DeAngelis GC, Freeman RD, Ohzawa I. Length and width tuning of neurons in the cat’s primary visual cortex. J Neurophysiol. 1994;71(1):347–374. doi: 10.1152/jn.1994.71.1.347. [DOI] [PubMed] [Google Scholar]
- 18.DeAngelis GC, Ghose GM, Ohzawa I, Freeman RD. Functional micro-organization of primary visual cortex: receptive field analysis of nearby neurons. J Neurosci. 1999;19(10):4046–4064. doi: 10.1523/JNEUROSCI.19-10-04046.1999. [DOI] [PMC free article] [PubMed] [Google Scholar]
- 19.DeBruyn EJ, Gajewski YA, Bonds AB. Anticholinesterase agents affect contrast gain of the cat cortical visual evoked potential. Neurosci Lett. 1986;71(3):311–316. doi: 10.1016/0304-3940(86)90639-7. [DOI] [PubMed] [Google Scholar]
- 20.DeBruyn EJ, Bonds AB. Contrast adaptation in cat visual cortex is not mediated by GABA. Brain Res. 1986;383(1):2–339. doi: 10.1016/0006-8993(86)90036-3. [DOI] [PubMed] [Google Scholar]
- 21.Gardner JL, Anzai A, Ohzawa I, Freeman RD. Linear and nonlinear contributions to orientation tuning of simple cells in the cat’s striate cortex. Vis Neurosci. 1999;16(6):1115–1121. doi: 10.1017/s0952523899166112. [DOI] [PubMed] [Google Scholar]
- 22.Gizzi MS, Katz E, Schumer RA, Movshon JA. Selectivity for orientation and direction of motion of single neurons in cat striate and extrastriate visual cortex. J Neurophysiol. 1990;63(6):1529–1543. doi: 10.1152/jn.1990.63.6.1529. [DOI] [PubMed] [Google Scholar]
- 23.Levitt JB, Lund JS. Contrast dependence of contextual effects in primate visual cortex. Nature. 1997;387(6628):73–76. doi: 10.1038/387073a0. [DOI] [PubMed] [Google Scholar]
- 24.Pfleger B, Bonds AB. Dynamic differentiation of GABAA-sensitive influences on orientation selectivity of complex cells in the cat striate cortex. Exp Brain Res. 1995;104(1):81–88. doi: 10.1007/BF00229857. [DOI] [PubMed] [Google Scholar]
- 25.Skottun BC, Bradley A, Sclar G, Ohzawa I, Freeman RD. The effects of contrast on visual orientation and spatial frequency discrimination: a comparison of single cells and behavior. J Neurophysiol. 1987;57(3):773–786. doi: 10.1152/jn.1987.57.3.773. [DOI] [PubMed] [Google Scholar]
- 26.Sugita Y, Mimura K. Cortical modulation of visual contrast. Psychol Res. 1991;53(4):271–273. doi: 10.1007/BF00920479. [DOI] [PubMed] [Google Scholar]
- 27.Tolhurst DJ, Barfield LP. Interactions between spatial frequency channels. Vision Res. 1978;18(8):951–958. doi: 10.1016/0042-6989(78)90023-8. [DOI] [PubMed] [Google Scholar]
- 28.Walker GA, Ohzawa I, Freeman RD. Asymmetric suppression outside the classical receptive field of the visual cortex. J Neurosci. 1999;19(23):10536–10553. doi: 10.1523/JNEUROSCI.19-23-10536.1999. [DOI] [PMC free article] [PubMed] [Google Scholar]
- 29.Walker GA, Ohzawa I, Freeman RD. Suppression outside the classical cortical receptive field. Vis Neurosci. 2000;17(3):369–379. doi: 10.1017/s0952523800173055. [DOI] [PubMed] [Google Scholar]
- 30.Heeger DJ. Modeling simple-cell direction selectivity with normalized, half-squared, linear operators. J Neurophysiol. 1993;70(5):1885–1898. doi: 10.1152/jn.1993.70.5.1885. [DOI] [PubMed] [Google Scholar]
- 31.Cannon MW, Fullenkamp SC. Spatial interactions in apparent contrast: inhibitory effects among grating patterns of different spatial frequencies, spatial positions and orientations. Vision Res. 1991;31(11):1985–1998. doi: 10.1016/0042-6989(91)90193-9. [DOI] [PubMed] [Google Scholar]
- 32.Cannon MW, Fullenkamp SC. Spatial interactions in apparent contrast: individual differences in enhancement and suppression effects. Vision Res. 1993;33(12):1685–1695. doi: 10.1016/0042-6989(93)90034-t. [DOI] [PubMed] [Google Scholar]
- 33.Cannon MW, Fullenkamp SC. A model for inhibitory lateral interaction effects in perceived contrast. Vision Res. 1996;36(8):1115–1125. doi: 10.1016/0042-6989(95)00180-8. [DOI] [PubMed] [Google Scholar]
- 34.D’Zmura M, Singer B. Spatial pooling of contrast in contrast gain control. J Opt Soc Am A. 1996;13(11):2135–2140. doi: 10.1364/josaa.13.002135. [DOI] [PubMed] [Google Scholar]
- 35.Ejima Y, Takahashi S. Apparent contrast of a sinusoidal grating in the simultaneous presence of peripheral gratings. Vision Res. 1985;25(9):1223–1232. doi: 10.1016/0042-6989(85)90036-7. [DOI] [PubMed] [Google Scholar]
- 36.Olzak LA, Thomas JP. Neural recoding in human pattern vision: model and mechanisms. Vision Res. 1999;39(2):231–256. doi: 10.1016/s0042-6989(98)00122-9. [DOI] [PubMed] [Google Scholar]
- 37.Solomon JA, Sperling G, Chubb C. The lateral inhibition of perceived contrast is indifferent to on-center/off-center segregation, but specific to orientation. Vision Res. 1993;33(18):2671–2683. doi: 10.1016/0042-6989(93)90227-n. [DOI] [PubMed] [Google Scholar]
- 38.Bonneh Y, Sagi D. Effects of spatial configuration on contrast detection. Vision Res. 1998;38(22):3541–3553. doi: 10.1016/s0042-6989(98)00045-5. [DOI] [PubMed] [Google Scholar]
- 39.Freeman AW, Badcock DR. Visual sensitivity in the presence of a patterned background. J Opt Soc Am A Opt Image Sci Vis. 1999;16(5):979–986. doi: 10.1364/josaa.16.000979. [DOI] [PubMed] [Google Scholar]
- 40.Snowden RJ, Hammett ST. The effects of surround contrast on contrast thresholds, perceived contrast and contrast discrimination. Vision Res. 1998;38(13):1935–1945. doi: 10.1016/s0042-6989(97)00379-9. [DOI] [PubMed] [Google Scholar]
- 41.Solomon JA, Morgan MJ. Facilitation from collinear flanks is cancelled by non-collinear flanks. Vision Res. 2000;40(3):279–286. doi: 10.1016/s0275-5408(99)00059-9. [DOI] [PubMed] [Google Scholar]
- 42.Meese TS, Holmes DJ. Adaptation and gain pool summation: alternative models and masking data. Vision Res. 2002;42(9):1113–1125. doi: 10.1016/s0042-6989(01)00291-7. [DOI] [PubMed] [Google Scholar]
- 43.Foley JM. Human luminance pattern-vision mechanisms: masking experiments require a new model. J Opt Soc Am A. 1994;11(6):1710–1719. doi: 10.1364/josaa.11.001710. [DOI] [PubMed] [Google Scholar]
- 44.Foley JM, Chen CC. Pattern detection in the presence of maskers that differ in spatial phase and temporal offset: threshold measurements and a model. Vision Res. 1999;39(23):3855–3872. doi: 10.1016/s0042-6989(99)00104-2. [DOI] [PubMed] [Google Scholar]
- 45.Polat U. Functional architecture of long-range perceptual interactions. Spat Vis. 1999;12(2):143–162. doi: 10.1163/156856899x00094. [DOI] [PubMed] [Google Scholar]
- 46.Polat U, Mizobe K, Pettet MW, Kasamatsu T, Norcia AM. Collinear stimuli regulate visual responses depending on cell’s contrast threshold. Nature. 1998;391(6667):580–584. doi: 10.1038/35372. [DOI] [PubMed] [Google Scholar]
- 47.Polat U, Sagi D. Lateral interactions between spatial channels: suppression and facilitation revealed by lateral masking experiments. Vision Res. 1993;33(7):993–999. doi: 10.1016/0042-6989(93)90081-7. [DOI] [PubMed] [Google Scholar]
- 48.Polat U, Norcia AM. Neurophysiological evidence for contrast dependent long-range facilitation and suppression in the human visual cortex. Vision Res. 1996;36(14):2099–2109. doi: 10.1016/0042-6989(95)00281-2. [DOI] [PubMed] [Google Scholar]
- 49.Mareschal I, Andrew Henrie J, Shapley RM. A psychophysical correlate of contrast dependent changes in receptive field properties. Vision Res. 2002;42(15):1879–1887. doi: 10.1016/s0042-6989(02)00099-8. [DOI] [PubMed] [Google Scholar]
- 50.Mareschal I, Sceniak MP, Shapley RM. Contextual influences on orientation discrimination: binding local and global cues. Vision Res. 2001;41(15):1915–1930. doi: 10.1016/s0042-6989(01)00082-7. [DOI] [PubMed] [Google Scholar]
- 51.Mareschal I, Shapley RM. Effects of contrast and size on orientation discrimination. Vision Res. 2004;44(1):57–67. doi: 10.1016/j.visres.2003.07.009. [DOI] [PubMed] [Google Scholar]
- 52.Xing J, Heeger DJ. Measurement and modeling of center-surround suppression and enhancement. Vision Res. 2001;41(5):571–583. doi: 10.1016/s0042-6989(00)00270-4. [DOI] [PubMed] [Google Scholar]
- 53.Olzak LA, Thomas JP. When orthogonal orientations are not processed independently. Vision Res. 1991;31(1):51–57. doi: 10.1016/0042-6989(91)90073-e. [DOI] [PubMed] [Google Scholar]
- 54.Olzak LA, Thomas JP. Configural effects constrain Fourier models of pattern discrimination. Vision Res. 1992;32(10):1885–1898. doi: 10.1016/0042-6989(92)90049-o. [DOI] [PubMed] [Google Scholar]
- 55.Olzak LA, Thomas JP. Dual nonlinearities regulate contrast sensitivity in pattern discrimination tasks. Vision Res. 2003;43(13):1433–1442. doi: 10.1016/s0042-6989(03)00175-5. [DOI] [PubMed] [Google Scholar]
- 56.Thomas JP, Olzak LA. Spatial phase sensitivity of mechanisms mediating discrimination of small orientation differences. J Opt Soc Am A Opt Image Sci Vis. 2001;18(9):2197–2203. doi: 10.1364/josaa.18.002197. [DOI] [PubMed] [Google Scholar]
- 57.Chen CC, Tyler CW. Lateral sensitivity modulation explains the flanker effect in contrast discrimination. Proc R Soc Lond B Biol Sci. 2001;268(1466):509–516. doi: 10.1098/rspb.2000.1387. [DOI] [PMC free article] [PubMed] [Google Scholar]
- 58.Yu C, Klein SA, Levi DM. Cross- and isooriented surrounds modulate the contrast response function: the effect of surround contrast. J Vis. 2003;3(8):527–540. doi: 10.1167/3.8.1. [DOI] [PubMed] [Google Scholar]
- 59.Yu C, Levi DM. Surround modulation in human vision unmasked by masking experiments. Nat Neurosci. 2000;3(7):724–728. doi: 10.1038/76687. [DOI] [PubMed] [Google Scholar]
- 60.Zenger-Landolt B, Koch C. Flanker effects in peripheral contrast discrimination--psychophysics and modeling. Vision Res. 2001;41(27):3663–3675. doi: 10.1016/s0042-6989(01)00175-4. [DOI] [PubMed] [Google Scholar]
- 61.Bowne SF. Contrast discrimination cannot explain spatial frequency, orientation or temporal frequency discrimination. Vision Res. 1990;30(3):449–461. doi: 10.1016/0042-6989(90)90086-z. [DOI] [PubMed] [Google Scholar]
- 62.Smith BG, Thomas JP. Why are some spatial discriminations independent of contrast? J Opt Soc Am A. 1989;6(5):713–724. doi: 10.1364/josaa.6.000713. [DOI] [PubMed] [Google Scholar]
- 63.Watson AB, Nielsen KR, Poirson A, Fitzhugh A, et al. Use of a raster framebuffer in vision research. Special Issue: Computers in vision research. Behavior Research Methods, Instruments, & Computers. 1986;18(6):587–594. [Google Scholar]
- 64.Foley JM, Chen CC. Pattern detection in the presence of maskers that differ in spatial phase and temporal offset: threshold measurements and a model. Vision Res. 1999;39(23):3855–3872. doi: 10.1016/s0042-6989(99)00104-2. [DOI] [PubMed] [Google Scholar]
- 65.Olzak LA, Laurinen PI. Multiple gain control processes in contrast-contrast phenomena. Vision Res. 1999;39(24):3983–3987. doi: 10.1016/s0042-6989(99)00131-5. [DOI] [PubMed] [Google Scholar]
- 66.Chubb C, Olzak L, Derrington A. Second-order processes in vision: introduction. J Opt Soc Am A Opt Image Sci Vis. 2001;18(9):2175–2178. doi: 10.1364/josaa.18.002175. [DOI] [PubMed] [Google Scholar]
- 67.Samonds JM, Bonds AB. From another angle: Differences in cortical coding between fine and coarse discrimination of orientation. J Neurophysiol. 2004;91(3):1193–1202. doi: 10.1152/jn.00829.2003. [DOI] [PubMed] [Google Scholar]