Abstract
Interleukin-13 (IL-13) is a known modulator of monocyte function, down-regulating monocyte surface markers such as CD14 and proinflammatory cytokines. We have shown previously that lymphocyte IL-13 gene expression was up-regulated during relapses in children with steroid-responsive nephrotic syndrome (SRNS). In this study, we examined the monocyte mRNA expression and lipopolysaccharide (LPS)-stimulated intracellular production of tumour necrosis factor-α (TNF-α) and IL-8 in children with SRNS during relapse and remission. Additionally, we investigated CD14 mRNA levels, CD14 surface expression and its soluble component (sCD14) in serum. Our results showed that the percentages of TNF-α positive monocytes following LPS stimulation were significantly lower in nephrotic children in relapse (64·4 ± 13·7%) compared to remission (81·6 ± 9·0%, P < 0·005). This was associated with down-regulation of CD14 mRNA, as well as both membrane and sCD14 in patients with nephrotic relapse (82·9 ± 10·1% and 1·23 ± 0·30 µg/ml, respectively) compared to remission (93·9 ± 3·2% and 1·77 ± 0·82 µg/ml, respectively) (P < 0·003). Although we demonstrated a decrease in LPS-stimulated intracellular production of TNF-α in monocytes from patients with nephrotic relapse, we were unable to show a concomitant decrease in mRNA expression during relapses. This could be explained by down-regulation of gene expression at the translational rather than transcriptional level. In conclusion, it is conceivable that up-regulation of T-cell IL-13 production in children with active nephrotic relapse was associated with suppression of monocyte CD14 expression, down-regulating pro-inflammatory cytokine production, and could account for the increased susceptibility to bacterial sepsis seen in nephrotic children in active relapse.
Keywords: CD14, lipopolysaccharide, monocyte, nephrotic syndrome TNF-α
INTRODUCTION
Childhood idiopathic nephrotic syndrome is characterized by the presence of heavy proteinuria associated with hypoalbuminaemia and hyperlipidaemia, which is usually responsive to steroid treatment [1]. As the majority of these children have minimal change disease, the long-term prognosis is excellent. However, the clinical course, especially during relapses of the nephrotic syndrome, is frequently complicated by bacterial infections, contributing significantly to the morbidity and mortality seen in this otherwise benign disease [2–9]. The pathogenetic mechanisms responsible for the increased susceptibility to bacterial infections, especially encapsulated organisms such as Streptococcal pneumoniae and Escherichia coli, in patients with nephrotic syndrome, are not well understood. In addition to the immunosuppressive effects of the drugs commonly used to induce remission in patients with nephrotic syndrome, several studies have demonstrated impaired humoral and cellular immunity, decreased concentration of serum factor B, impaired opsonic activity and the presence of a soluble immune response suppressor that may blunt infection-induced leucocyte responses in patients with relapse of the nephrotic syndrome [10–13].
We have shown previously that interleukin-13 (IL-13) gene expression was up-regulated in both CD4+ and CD8+ T cells during the relapse phase of childhood steroid-responsive nephrotic syndrome (SRNS) [14]. Although IL-13 shares many of its biological activities with the Th2 cytokine IL-4, including induction of B-cell class switch to IgE, it is also an important modulator of monocyte function [15–18]. The anti-inflammatory effect of IL-13 is indicated by its ability to suppress the production of proinflammatory cytokines tumour necrosis factor-α and IL-8 in lipopolysaccharide-activated monocytes [16,19]. In addition, it down-regulates the expression of monocyte CD14 by suppressing CD14 at both the mRNA level and protein levels [16,20].
CD14 is a glycosylphosphatidylinositol (GPI)-linked glycoprotein expressed primarily on monocytes and to a lesser extent on granulocytes [21]. CD14 interacts with different components of both Gram-negative and Gram-positive bacteria, as well as fungi, defining it as a central pattern recognition molecule in innate immunity [22]. It triggers monocyte activation in conjunction with serum lipopolysaccharide (LPS)-binding protein and serves as a receptor for both LPS and peptidoglycan [23,24], two of the most abundant constituents in the bacterial cell wall. Engagement of LPS to membrane-bound CD14 promotes an array of leucocyte function, including cellular activation, leading to the production of inflammatory cytokines such as IL-1 and tumour necrosis factor-α (TNF-α)[25] and phagocytosis of Gram-negative bacteria [26].
In order to define further the role of IL-13 in children with relapse of SRNS and its possible influence on monocyte function, this study examined the monocyte mRNA expression of CD14, TNF-α and IL-8 in children with SRNS in relapse and remission. In addition, the protein expression of membrane CD14 on monocytes, and the serum concentration of CD14 in its soluble form were assessed.
MATERIALS AND METHODS
Patient population
Forty-one children (23 boys and 18 girls) with steroid-responsive nephrotic syndrome were included in a cross-sectional study, and examined in clinical relapse and/or remission. Their mean age was 9 ± 5 years (range 2–22 years). In addition, 29 normal healthy controls were also studied. Relapse was defined as increased urinary protein excretion (Albustix ≥2+ for at least 3 consecutive days or ≥40 mg/m2 per h) and serum albumin ≤25 g/l. Remission was defined as serum albumin ≥35 g/l and normal urinary protein excretion (Albustix trace or negative for at least 3 consecutive days or ≤5 mg/m2/h). None of the patients included in the study had systemic lupus erythematosus, liver disease and other vasculities. Informed consent was obtained from the parents before blood sampling. The study was approved by the Ethics Committee of the National University Hospital.
Heparinized blood was obtained from the study subjects. Children with SRNS were either not on any treatment during the time of blood sampling, or on prednisolone during relapse and remission, as they were steroid-dependent. None of them were on angiotensin-converting enzyme inhibitors, non-steroidal anti-inflammatory drugs, cyclosporin or cyclophosphamide.
In addition, paired data both in nephrotic relapse and remission were available from 14 patients for mRNA expression studies and from 11 children for intracellular cytokine studies. Each patient pair was matched for prednisolone therapy; that is, they were either on or off prednisolone during the time of blood sampling.
Cytoplasmic cytokine assay by flow cytometry
One ml of freshly sampled blood was incubated with 1 µg of LPS (Sigma Chemical Company, St Louis, MO, USA) in the presence of 10 µg Brefeldin A (Boehringer Mannheim, USA) for 4 h, to inhibit intracellular transport [27,28]. The FastImmuneTM Cytokine System (Becton Dickinson, San Jose, CA, USA) was used to detect intracellular cytokine production in monocytes after LPS stimulation. Briefly, 10 µl of fluorescein isothiocyanate-conjugated (FITC) monoclonal antibody (MoAb) against CD33, a monocyte-specific surface antigen, was added to 50 µl of activated blood, and incubated for 15 min at room temperature. The red cells were lysed with 2 ml of FACS Lysing Solution (Becton Dickinson) and permeabilized with 500 µl of FACS Permeabilizing Solution (Becton Dickinson). Twenty µl of intracellular cytokine-specific Phycoerythrin (PE)-conjugated MoAbs (to IL-8 or TNF-α) were added to each tube and incubated for 30 min, following which the cells were washed and resuspended in 300 µl of 1% paraformaldehyde.
The cells were analysed by flow cytometry on the FACScan (Becton Dickinson), using two-colour dot-plots gated on the CD33+ cell population, using the cellquest software. The percentage of CD33+ cells positive for either cytoplasmic IL-8 or TNF-α was calculated based on the formula: (AS-AIC)-(US-UIC), where AS = activated sample, AIC-activated isotype control, US = unstimulated sample and UIC = unstimulated isotype control. The geometric mean fluorescence intensities were also determined.
Isolation of monocytes
Peripheral blood mononuclear cells (PBMCs) were isolated from patients with SRNS and healthy controls by standard density gradient centrifugation with Lymphoprep (Nycomed AS, Olso, Norway). The MACS-Monocyte Isolation Kit (Miltenyi Biotec, Bergisch Gladbach, Germany) was used to obtain the pure monocyte fraction. This is based on an indirect magnetic labelling system for the isolation of monocytes from human PBMC by magnetic depletion of T cells, NK cells, B cells, dendritic cells and basophils. Briefly, the cells are indirectly magnetically labelled using a cocktail of hapten-conjugated CD3, CD7, CD19, CD45RA, CD56 and anti-IgE antibodies and MACS Microbeads coupled to an antihapten MoAb. The magnetically labelled cells are depleted by retaining them on a MACS column in the magnetic field of the MidiMACS.
The cells were pelleted and resuspended in buffer in a total volume of 60 µl per 107 total cells. Twenty µl of FcR blocking reagent and hapten-antibody cocktail were added per 107 total cells, mixed well and incubated for 5 min at 6–12°C. The cells were then washed twice with buffer by adding 10–20× the labelling volume, centrifuged and the supernatant was removed completely. The cell pellet was resuspended in 500 µl of buffer per 108 total cells and applied to a preprimed LS+/VS+ in the magnetic field of the MidiMACS separator.
The unlabelled cells were allowed to pass through and the column was rinsed with 4 × 3 ml of buffer. The effluent was collected as the negative fraction containing the enriched monocyte fraction. The retained cells were collected outside the magnetic field as the positive (non-monocyte) fraction. Purity of the monocyte fraction as determined by flow cytometry was >90%.
Reverse transcription polymerase chain reaction (RT-PCR)
Total RNA was isolated from the monocyte-enriched fraction using TRIzol reagent, a modification of the standard guanidium–phenol–choroform extraction method [29]. cDNA was synthesized from 200 ng of total RNA using 2·5 µm oligo-(dT)20 as primers, 3 mm MgCl2, 1 mm dNTP, 5× RT-buffer, 20 U RNase inhibitor and 50 U Moloney murine leukaemia virus-reverse transcriptase (Promega, Madison, WI, USA). The mixture was incubated at 37°C for 1 h, followed by 99°C for 5 min, and then cooled rapidly to 4°C.
Semi-quantitative polymerase chain reaction (PCR) using real-time PCR
Real-time PCR was carried with the Light Cycler Instrument (Roche Molecular Biochemical, Mannheim, Germany) using the DNA binding dye SYBR Green I for detection of PCR products. Eighteen µl PCR master-mix (Lighter-FastStart DNA Master SYBR Green I; Roche Molecular Biochemical, Mannheim, Germany) was supplemented with 3 mm MgCl2, 0·5 µm of custom-synthesized primers (Geneset Oligos, Singapore) and 2 µl of either external standards or cDNA equivalent to 20 ng total RNA, to give a final reaction volume of 20 µl. Settings for the cycle profile were as follows: preincubation time (10 min/95°C), followed by amplification cycles: 15 s/95°C; 5 s/60–65°C; 9 s/72°C (GAPDH), 12 s/72°C (CD14), 9 s/72°C (TNF-α and IL-8). The primer sequences used are listed in Table 1. Melting curve analysis was performed by increasing the temperature from 55°C to 95°C. The PCR products were verified subsequently by gel electrophoresis. Glyceraldehyde 3-phosphate dehydrogenase (GAPDH) was used as the ‘housekeeping’ gene to standardize the amount of cDNA obtained from RT-PCR.
Table 1.
Primer sequences for PCR
| Primer sequence | Products (bp) | |
|---|---|---|
| GAPDH | 5′-accacagtccatgccatcactgc-3′ | 480 |
| 5′-ctccttggaggccatgtgg-3′ | ||
| IL-8 | 5′-tctgcagctctgtgtgaaggtgcagtt-3′ | 219 |
| 5′-aaccctctgcacccagttttcctt-3′ | ||
| TNF-α | 5′-caccacgctcttctgcctgc-3′ | 229 |
| 5′-tctcagctccacgccattgg-3′ | ||
| CD14 | 5′-taaaggactgccagccaagc-3′ | 295 |
| 5′-agccaaggcagtttgagtcc-3′ |
External standards were constructed by cloning the PCR products of reverse transcribed RNA from pokeweed mitogen (PWM)-stimulated PBMC using TOPO® TA Cloning Kit (Invitrogen, Carlsbad, CA, USA). The sequence cloned was homologous to the target to ensure identical amplification efficiency. After purification, the sequence identity of the cDNA constructs was determined by automated sequencing using Perkin-Elmer ABI sequencer. The amount of standard cDNA was quantified photometrically and serial dilutions were prepared shortly before each run.
Enzyme immunoassay for serum IL-8, TNF-α and soluble CD14 (sCD14)
Serum concentrations of IL-8 and TNF-α were measured using the OptEIATM Human IL-8 and TNF-α (PharMingen, San Diego, CA, USA), respectively. sCD14 serum concentration was determined by QuantikineR: human sCD14 (R&D Systems, Inc., Minneapolis, MN, USA). Minimal detectable levels of IL-8, TNF-α and sCD14 were 3·1 pg/ml, 7·8 pg/ml and 250 pg/ml, respectively.
Monocyte CD14 surface staining
The number of cells staining positive for the monocyte differentiation marker CD14 was measured using fluorescence-conjugated MoAbs. Fifty µl of heparinized whole blood was incubated with 5 µl of FITC-conjugated antihuman CD14 and PerCP-conjugated antihuman CD45 antibodies (Becton Dickinson, San Jose, CA, USA). Non-specific mouse IgG2a-FITC and IgG1-PerCP were used as negative controls. The cells were incubated for 30 min at room temperature in the dark. Red cells were lysed with 1 ml of FACS Lysing Solution, washed two times with PBS and fixed in 400 µl of 1% paraformaldehyde. Stained monocytes were analysed on a FACScanR flow cytometer using CellQuest softwareTM (Becton Dickinson, San Jose, CA, USA). Both the percentage of cells positive for CD14 surface expression, as well as the geometric mean fluorescence were determined.
Statistical analysis
All data were expressed as mean ± s.d. Statistical analysis was performed using Statistical Package for the Social Science for Windows v10·0. The difference between the percentage of positive cells producing IL-8/TNF-α in relapse and remission in patients and normal controls in our cross-sectional study were compared using the non-parametric Mann–Whitney rank sum test. Dunnett's test for multiple comparison was used to compare the effect of steroid treatment between patients in relapse, remission and normal control. A value of Q for k = 3 treatment groups exceeding the critical value of 2·394 was considered significant (P < 0·05). Paired data for the nephrotic patients in relapse and remission were compared using Wilcoxon's signed-rank test.
RESULTS
Intracellular cytokines (cross-sectional data)
Patients with nephrotic relapse had significantly reduced LPS-stimulated intracellular cytokine production compared with those in remission and normal controls. Table 2 shows the geometric mean fluorescence and the percentage of monocytes positive for intracellular IL-8 and TNF-α. Both the geometric mean fluorescence and the percentage of monocytes positive for intracellular TNF-α were significantly lower in patients with nephrotic relapse compared to those in remission and normal controls (P < 0·01). The percentage of cells positive for intracellular IL-8 was also significantly lower in nephrotic relapse compared to remission and normal controls (P < 0·02).
Table 2.
Monocyte intracellular IL-8 and TNF-α production expressed as percentage of positive cells and geometric mean fluorescence
| Percentage of positive cells | Geometric mean fluorescence | ||||||
|---|---|---|---|---|---|---|---|
| Samples | Number | IL-8 | TNF-α | IL-8 | Range | TNF-α | Range |
| Normal | 29 | 39·6 ± 16·0 | 84·5 ± 7·7 | 29·7 | 4·0–59·3 | 609·7 | 80·9–1604·7 |
| Relapse | 28 | 29·9 ± 22·8a,b | 67·0 ± 14·0c,d | 32·6 | 4·2–113·0 | 203·5c,e | 24·2–706·2 |
| Remission | 27 | 48·2 ± 19·4 | 80·4 ± 11·4 | 34·7 | 4·4–74·2 | 369·5f | 22·9–1003·4 |
P < 0·02, comparing nephrotic relapse with normal controls;
P < 0·002, comparing nephrotic relapse with remission;
P < 0·001, comparing nephrotic relapse with normal controls;
P < 0·001, comparing nephrotic relapse with remission;
P < 0·03, comparing nephrotic remission with normal controls.
Effects of steroids
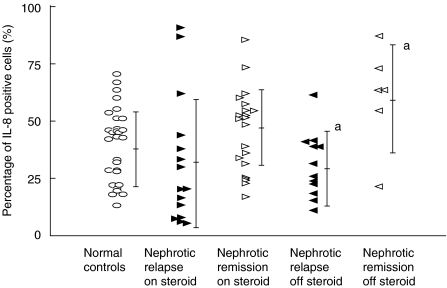
The patients were stratified into those who were steroid-dependent and therefore on steroid treatment and those who were not on steroids during the time of blood sampling. As shown in Fig. 1, the percentage of cells positive for LPS-induced intracellular production of IL-8 was significantly decreased in the nonsteroid group that had relapse nephrotic syndrome (28·0 ± 15·8%, mean fluorescence 22·5, n = 13) compared to those in remission (59·8 ± 22·1%, mean fluorescence 42·5, n = 6) (P < 0·05). However, this was not different from the normal controls (39·6 ± 16·0%, mean fluorescence 29·7, n = 29). Moreover, there was no significant difference observed in the intracellular production of IL-8 between the steroid-dependent group that had relapse nephrotic syndrome (31·5 ± 28·0%, mean fluorescence 41·3, n = 15) and those in remission (44·9 ± 17·8%, mean fluorescence 32·5, n = 21).
Fig. 1.
LPS-induced intracellular production of IL-8 in monocytes. Comparison of the effect of steroid treatment at the time of blood sampling in nephrotic patients during relapse and remission. aComparison between nephrotic patients without steroids in relapse or remission, P < 0·05.
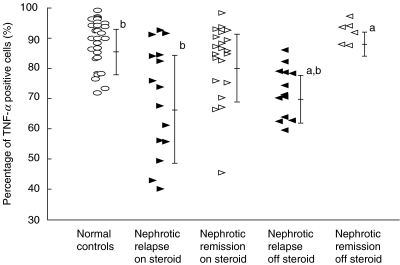
As shown in Fig. 2, the percentage of TNF-α positive cells was significantly reduced in nephrotic patients in relapse, who were off steroids (68·3 ± 8·3%, mean fluorescence 198·9, n = 13), compared to remission (87·7 ± 3·7%, mean fluorescence 413·9, n = 6) and normal controls (84·5 ± 7·7%, mean fluorescence 609·7, n = 29) (P < 0·05). In addition, intracellular production of TNF-α was significantly reduced in steroid-dependent nephrotic patients in relapse (65·9 ± 16·0%, mean fluorescence 207·5, n = 15) compared to normal controls (P < 0·05). Steroid-dependent patients in remission but who were still on prednisolone were observed to have higher levels of intracellular TNF-α production (78·4 ± 12·1%, mean fluorescence 356·7, n = 21) compared to nephrotic relapse, but this did not reach statistical significance.
Fig. 2.
LPS-induced intracellular production of TNF-α in monocytes. Comparison of the effect of steroid treatment at the time of blood sampling in nephrotic patients during relapse and remission. aComparison between nephrotic patients without steroids in relapse and remission, P < 0·05. bComparison between normal controls and nephrotic patients with and without steroids in relapse, P < 0·05.
Intracellular cytokines (paired data)
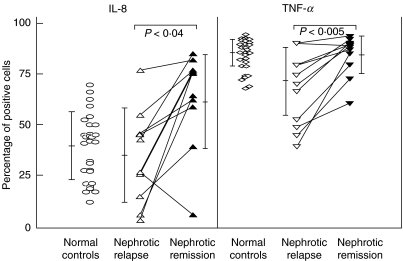
Paired data for LPS-induced intracellular IL-8 and TNF-α expression in both relapse and remission were available for 11 children (Fig. 3). Four children were off steroids during the time of blood sampling, while the other seven were on prednisolone. Matched-pair analysis confirmed the cross-sectional data, as it showed that both intracellular IL-8 and TNF-α protein expression were significantly decreased in relapse (26·4 ± 22·9% and 64·4 ± 13·7%, respectively) compared with those in remission (58·6 ± 22·3%, P < 0·04 and 81·6 ± 9·0%, P < 0·005, respectively).
Fig. 3.
Intracellular expression of monocyte IL-8 and TNF-α. Analysis of paired data from nephrotic patients in relapse and remission.
Real-time PCR (paired data)
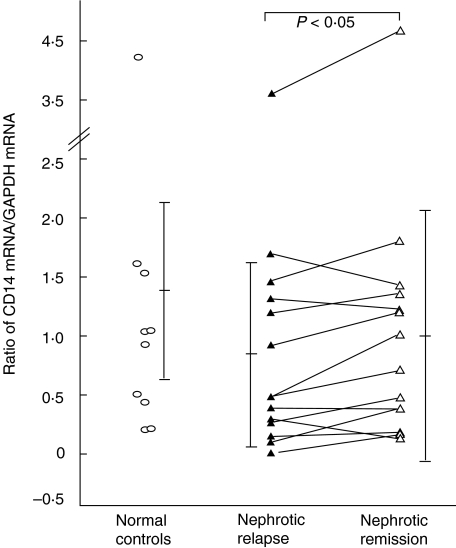
To determine if the down-regulation of intracellular expression of IL-8 and TNF-α correlated with mRNA expression, and whether the suppression of LPS-mediated monocyte activation was due to a reduction in the gene expression of the LPS receptor CD14, a semiquantitative analysis of IL-8, TNF-α and CD14 mRNA expression was performed using real-time PCR. As shown in Fig. 4, CD14 mRNA was observed to be significantly lower in 14 pairs of children with nephrotic relapse (0·94 ± 0·93) compared to remission (1·15 ± 1·16) (P < 0·05), although these were not different from controls. Ten of these patients were on prednisolone during blood sampling and the other four were off steroids. However, no significant difference was detected in IL-8 and TNF-α mRNA levels between the pairs in relapse and remission.
Fig. 4.
CD14 mRNA expression in monocytes. Analysis of paired data from nephrotic patients in relapse and remission.
Serum sCD14, IL-8 and TNF-α levels
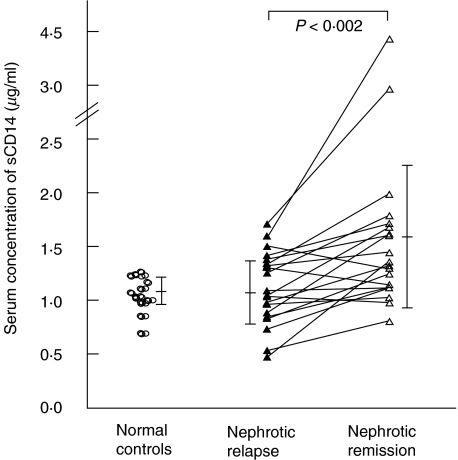
Serum levels of sCD14 were measured from 15 normal controls and 20 patient pairs. Nephrotic patients in their course of relapse had lower sCD14 levels (1·23 ± 0·30 µg/ml) compared to remission (1·77 ± 0·82 µg/ml) (P < 0·002) (Fig. 5).
Fig. 5.
Serum concentration of soluble CD14. Analysis of paired data from nephrotic patients in relapse and remission.
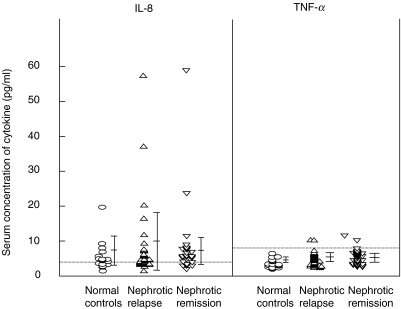
Figure 6 shows the serum IL-8 and TNF-α levels in nephrotic patients in relapse and remission and normal controls. Serum IL-8 levels were detectable in 10/18 (56%) of normal controls, nine (mean 5·6 ± 4·0 pg/ml), 15/31 (48%) of nephrotic patients in relapse (mean 8·5 ± 11·4 pg/ml) and 19/30 (67%) of patients in remission (mean 7·8 ± 10·3 pg/ml). This was not statistically significant. On the other hand, serum TNF-α levels were not detectable in normal controls (mean 3·7 ± 1·3 pg/ml), but was detectable in only 2/31 (6·5%) of nephrotic patients in relapse (mean 4·6 ± 2·0 pg/ml) and 1/30 (3·3%) of patients in remission (mean 4·4 ± 1·9 pg/ml).
Fig. 6.
Serum concentrations of IL-8 and TNF-α. Comparison of nephrotic patients in relapse and remission and normal controls. Dotted line shows the minimal detectable serum concentrations.
Surface expression of CD14 on monocytes
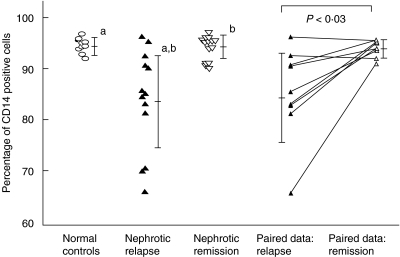
Monocyte CD14 surface expression was analysed by flow cytometry. As shown in Table 3, both the percentage of cells positive for CD14 surface expression, as well as the geometric mean fluorescence were reduced significantly in patients with nephrotic relapse (82·9 ± 10·1%, mean fluorescence 269·6, n = 14) compared to those in remission (93·9 ± 3·2%, mean fluorescence 470·3, n = 15) (P < 0·003) and normal controls (93·0 ± 2·8%, mean fluorescence 457·0, n = 10) (P < 0·006). All patients were on steroid maintenance therapy during either the relapse or remission phase. This finding was confirmed by paired analysis of nine patients in relapse and remission, three of whom were not on steroid treatment during the time of blood sampling, where surface expression of CD14 was significantly reduced during relapse, compared to remission (P < 0·03) (Fig. 7).
Table 3.
.Monocyte CD14 surface expression expressed as mean percentage of positive cells and geometric mean fluorescence
| Fluorescence | ||||
|---|---|---|---|---|
| Samples | Number | Percentage of CD14 positive cells Mean | Geometric mean | Range |
| Normal | 10 | 93·0 ± 2·8 | 457·0 | 350·3–604·3 |
| Relapse | 14 | 82·9 ± 10·1a,b | 269·6a,b | 110·9–640·5 |
| Remission | 15 | 93·9 ± 3·2 | 470·3 | 276·3–716·5 |
P < 0·006, comparing nephrotic relapse with normal controls;
P < 0·003, comparing nephrotic relapse with remission.
Fig. 7.
Surface expression of CD14 on peripheral blood monocytes. Analysis of cross-sectional and paired data from patients in nephrotic relapse and remission. aComparison between nephrotic patients in relapse and normal controls, P < 0·006. bComparison between nephrotic patients in relapse and remission, P < 0·003.
DISCUSSION
IL-13 is a known modulator of monocyte function, acting through both CD14-dependent and CD14-independent pathways [20]. In this study, we have shown that intracellular production of TNF-α was significantly decreased in monocytes from patients with nephrotic relapse compared to remission. This was probably related to the up-regulated CD4+ and CD8+ IL-13 production that we have demonstrated previously in nephrotic patients in active relapse [14]. Matsumoto has also described decreased production of IL-1 by peripheral blood monocytes from patients with minimal change nephrotic syndrome following LPS-stimulation [30]. The ability of IL-13 to down-regulate the proinflammatory cytokines has important functional implications in the nephrotic child, whose clinical course is often complicated by bacterial infections such as peritonitis, resulting in significant morbidity.
CD14, a monocyte differentiation marker, is also the main receptor for LPS and bacterial peptidoglycans, and plays an important role in endotoxin-induced monokine release during bacterial infections [31–33]. Our results demonstrated that, in nephrotic patients with active relapse, there was a decrease in the surface expression of CD14 on peripheral monocytes, which could account for the increased susceptibility to infections seen in nephrotic patients. The serum concentration of sCD14 was also lower in nephrotic patients during the relapse phase compared to remission, suggesting that the observed decrease in surface CD14 expression was not due to increased shedding of the membrane protein, but due rather to down-regulation of the surface protein. Whether this could be due to the effect of endogenous suppression factors, such as IL-13, on CD14 transcription remains uncertain, as we could not demonstrate a clear difference in monocyte CD14 gene expression during active relapses as compared to remission or normal controls.
Membrane CD14 is GPI-anchored and lacks a transmembrane domain. It is therefore, incapable of initiating a transmembrane activation signal. Recently, several studies have examined the potential role for the family of Toll-like receptors (TLR) in LPS recognition [34,35]. Both mCD14 and sCD14 are known to enhance the responsiveness of cells to LPS [36] by presenting its disaggregated form to a Toll receptor. Signal transduction through TLR4 results in the activation of nuclear factor-κB [37] that leads ultimately to the synthesis and release of a number of proinflammatory mediators, including IL-1, IL-6, IL-8 and TNF-α[38]. Hence it is conceivable that suppression of both mCD14 and sCD14, in nephrotic patients with active relapse, by IL-13 could result in down-regulation of the proinflammatory cytokines, predisposing these patients to bacterial sepsis.
Some studies have described up-regulation of both the serum levels and mRNA expression of IL-8 or TNF-α in nephrotic children [39–41]. However, our data showed a decrease in the intracellular production of both pro-inflammatory cytokines, IL-8 and TNF-α, by LPS-stimulated monocytes from nephrotic children in relapse, consistent with the suppressed CD14 levels. This was not due to ‘fatigue’ of synthesis and expression due to prior overstimulation in-vivo, as the serum levels of IL-8 and TNF-α were not elevated significantly in our patients with nephrotic relapse compared to remission and normal controls. Similarly, Daniel et al. reported decreased serum IL-8 and normal TNF-α levels in patients with relapse nephrotic syndrome [42].
Moreover, we did not show any up-regulation of either IL-8 or TNF-α gene expression in our nephrotic children during the relapse phase. The process involved in the regulation of LPS-induced TNF-α gene expression is controversial. Several studies have shown that IL-4 and IL-13 decreased LPS-induced TNF-α mRNA accumulation in human PBMC [43,44]. On the other hand, Mijatovic et al. reported in a mouse model that IL-4 and IL-13 did not modify TNF-α mRNA expression in response to LPS [45]. Instead, these investigators demonstrated that down-regulation of TNF-α gene expression was at the translational rather than transcriptional level, and that this translational repression was mediated by UA-rich sequences located in the 3′-untranslated region of TNF-α mRNA.
In conclusion, we have shown that up-regulation of T-cell IL-13 production in children with active nephrotic relapse may be associated with suppression of monocyte CD14 expression and down-regulation of proinflammatory cytokine production. This could be one of the factors responsible for the immunosuppressed state during nephrotic relapses, predisposing these children to serious bacterial sepsis.
Acknowledgments
This work was supported by grant (NMRC/0322/1998) from the National Medical Research Council, Singapore and the NKF-Khoo Oon Teck Professorship Grant, National University of Singapore. This work was presented in part at the 34th Annual Meeting of American Society of Nephrology, 2001. Ms Siew-Peng Chen is a Masters of Science student at the National University of Singapore.
REFERENCES
- 1.International Study of Kidney Disease in Children. Nephrotic syndrome in children. Prediction of histopathology from clinical and laboratory characteristics at time of diagnosis. Kidney Int. 1978;13:159–65. doi: 10.1038/ki.1978.23. [DOI] [PubMed] [Google Scholar]
- 2.Wifert CM, Katz S. Etiology of bacterial sepsis in nephrotic children 1963–67. Pediatrics. 1968;42:840–3. [PubMed] [Google Scholar]
- 3.Krensky AM, Ingelfinger JR, Grupe WE. Peritonitis in childhood nephrotic syndrome. Am J Dis Child. 1982;136:732–6. doi: 10.1001/archpedi.1982.03970440076023. [DOI] [PubMed] [Google Scholar]
- 4.International Study of Kidney Disease in Children. Minimal change nephrotic syndrome: deaths during the first 5–15 years’ observation. Pediatrics. 1984;73:497–501. [PubMed] [Google Scholar]
- 5.Asmar BI, Bashour BN, Fleischmann LE. Escherichia coli in children with idiopathic nephrotic syndrome. Clin Pediatr. 1987;26:592–4. doi: 10.1177/000992288702601108. [DOI] [PubMed] [Google Scholar]
- 6.Gorensek MJ, Lebel MH, Nelson JD. Peritonitis in children with nephrotic syndrome. Pediatrics. 1988;81:849–56. [PubMed] [Google Scholar]
- 7.Feinstein EI, Chesney RW, Zelikovic I. Peritonitis in children with renal disease. Am J Nephrol. 1988;8:147–65. doi: 10.1159/000167575. [DOI] [PubMed] [Google Scholar]
- 8.Ilyas M, Roy S, III, Abbasi S, et al. Serious infections due to penicillin-resistant Streptococcus pneumoniae in two children with nephrotic syndrome. Pediatr Nephrol. 1996;10:639–41. doi: 10.1007/s004670050179. [DOI] [PubMed] [Google Scholar]
- 9.Tain YL, Lin GJ, Cher TW. Microbiological spectrum of septicemia and peritonitis in nephrotic children. Pediatr Nephrol. 1999;13:835–7. doi: 10.1007/s004670050710. [DOI] [PubMed] [Google Scholar]
- 10.Giangliacomo J, Cleary TG, Cole BR, et al. Serum immunoglobulins in the nephrotic syndrome. N Engl J Med. 1975;293:8–12. doi: 10.1056/NEJM197507032930103. [DOI] [PubMed] [Google Scholar]
- 11.Chan MK, Chan KW, Jones B. Immunologlobulins (IgG, IgA, IgM, IgE) and complement components (C3, C4) in nephrotic syndrome due to minimal change and other forms of glomerulonephritis, a clue for steroid therapy? Nephron. 1987;47:125–30. doi: 10.1159/000184474. [DOI] [PubMed] [Google Scholar]
- 12.Anderson DC, York TL, Rose G, et al. Assessment of serum factor B, serum opsonins, granulocyte chemotaxis, and infection in nephrotic syndrome. J Infect Dis. 1979;140:1–10. doi: 10.1093/infdis/140.1.1. [DOI] [PubMed] [Google Scholar]
- 13.Schnaper HW, Aune TM. Steriod-sensitive mechanism of soluble immune response suppressor production in steroid-responsive nephrotic syndrome. J Clin Invest. 1987;79:257–64. doi: 10.1172/JCI112792. [DOI] [PMC free article] [PubMed] [Google Scholar]
- 14.Yap HK, Cheung W, Murugasu B, et al. Th1 and Th2 cytokine mRNA profiles in childhood nephrotic syndrome: evidence for increased IL-13 mRNA expression in relapse. J Am Soc Nephrol. 1999;10:529–37. doi: 10.1681/ASN.V103529. [DOI] [PubMed] [Google Scholar]
- 15.McKenzie ANJ, Culpepper JA, de Waal Malefyt R, et al. Interleukin 13, a T-cell derived cytokine that regulates human monocyte and B-cell function. Proc Natl Acad Sci USA. 1993;90:3735–9. doi: 10.1073/pnas.90.8.3735. [DOI] [PMC free article] [PubMed] [Google Scholar]
- 16.De Waal Malefyt R, Figdor CG, Huijbens R, et al. Effects of IL-13 on phenotype, cytokine production, and cytotoxic function of human monocytes. J Immunol. 1993;151:6370–81. [PubMed] [Google Scholar]
- 17.Defrance T, Carayon P, Billian G, et al. Interleukin 13 is a B cell stimulating factor. J Exp Med. 1994;179:135–43. doi: 10.1084/jem.179.1.135. [DOI] [PMC free article] [PubMed] [Google Scholar]
- 18.Punnonen J, Aversa G, Cocks BG, et al. Interleukin 13 induces interleukin 4-independent IgG4 and IgE synthesis and CD23 expression by human B cells. Proc Natl Acad Sci USA. 1993;90:3730–4. doi: 10.1073/pnas.90.8.3730. [DOI] [PMC free article] [PubMed] [Google Scholar]
- 19.Zurawski G, De Vries JE. Interleukin 13, an interleukin 4-like cytokine that acts on monocytes and B cells, but not on T cells. Immunol Today. 1994;15:19–26. doi: 10.1016/0167-5699(94)90021-3. [DOI] [PubMed] [Google Scholar]
- 20.Cosentino G, Soprana E, Thienes CP, et al. IL-13 down-regulates CD14 expression and TNF-α secretion in normal human monocytes. J Immunol. 1995;155:3145–51. [PubMed] [Google Scholar]
- 21.Haziot A, Chen S, Ferrero E, et al. The monocyte differentiation antigen, CD14, is anchored to the cell membrane by a phosphatidylinositol linkage. J Immunol. 1988;141:547–52. [PubMed] [Google Scholar]
- 22.Pugin J, Heumann D, Tomasz A, et al. CD14 is a pattern recognition receptor. Immunity. 1994;1:509–16. doi: 10.1016/1074-7613(94)90093-0. [DOI] [PubMed] [Google Scholar]
- 23.Wright SD, Ramos RA, Tobias PS, et al. CD14, a receptor for complexes of lipopolysaccharide (LPS) and LPS binding protein. Science. 1990;249:1431–3. doi: 10.1126/science.1698311. [DOI] [PubMed] [Google Scholar]
- 24.Gupta D, Kirkland TN, Viriyakosol S, et al. CD14 is a cell-activating receptor for bacterial peptidoglycan. J Biol Chem. 1996;271:23310–6. doi: 10.1074/jbc.271.38.23310. [DOI] [PubMed] [Google Scholar]
- 25.Netea MG, Kullberg BJ, Van Der Meer JWM. Lipopolysaccharide-induced production of tumour necrosis factor and interleukin-1 is differentially regulated at the receptor level: the role of CD14-dependent and CD14-independent pathways. Immunology. 1998;94:340–4. doi: 10.1046/j.1365-2567.1998.00532.x. [DOI] [PMC free article] [PubMed] [Google Scholar]
- 26.Grunwald U, Fan XL, Jack RS, et al. Monocytes can phagocytose gram-negative bacteria by a CD14-dependent mechanism. J Immunol. 1996;157:4119–25. [PubMed] [Google Scholar]
- 27.Picker LJ, Singh MK, Zdraveski Z, et al. Direct demonstration of cytokine synthesis heterogeneity among human memory/effector T cells by flow cytometry. Blood. 1995;86:1406–19. [PubMed] [Google Scholar]
- 28.Openshaw P, Murphy EE, Hosken NA, et al. Heterogeneity of intracellular cytokine synthesis at the single-cell level in polarized T helper 1 and T helper 2 populations. J Exp Med. 1995;182:1357–67. doi: 10.1084/jem.182.5.1357. [DOI] [PMC free article] [PubMed] [Google Scholar]
- 29.Chomczynski P, Sacchi N. Single-step method of RNA isolation by acid guanidinium thiocyanate–phenol–chloroform extraction. Anal Biochem. 1987;162:156–9. doi: 10.1006/abio.1987.9999. [DOI] [PubMed] [Google Scholar]
- 30.Matsumoto K. Decreased production of interleukin-1 by monocytes from patients with lipoid nephrosis. Clin Nephrol. 1989;31:292–6. [PubMed] [Google Scholar]
- 31.Antal-Szalmás P. Evaluation of CD14 in host defense. Eur J Invest. 2000;30:167–79. doi: 10.1046/j.1365-2362.2000.00610.x. [DOI] [PubMed] [Google Scholar]
- 32.Pugin J, Schürer-Maly CC, Leturcq D, et al. Lipopolysaccharide activation of human endothelial and epithelial cells is mediated by lipopolysaccharide-binding protein and soluble CD14. Proc Natl Acad Sci USA. 1993;90:2744–8. doi: 10.1073/pnas.90.7.2744. [DOI] [PMC free article] [PubMed] [Google Scholar]
- 33.Pugin J, Ulevitch RJ, Tobias PS. A critical role for monocytes and CD14 in endotoxin-induced endothelial cell activation. J Exp Med. 1993;178:2193–200. doi: 10.1084/jem.178.6.2193. [DOI] [PMC free article] [PubMed] [Google Scholar]
- 34.Lien E, Means TK, Heine H, et al. Toll-like receptor 4 imparts ligand-specific recognition of bacterial lipopolysaccharide. J Clin Invest. 2000;105:497–504. doi: 10.1172/JCI8541. [DOI] [PMC free article] [PubMed] [Google Scholar]
- 35.Gerard C. For whom the bell tolls. Nature. 1998;395:217–9. doi: 10.1038/26104. [DOI] [PubMed] [Google Scholar]
- 36.Yang RB, Mark MR, Gray A, et al. Toll-like receptor-2 mediates lipopolysaccharide-induced cellular signaling. Nature. 1998;395:284–8. doi: 10.1038/26239. [DOI] [PubMed] [Google Scholar]
- 37.Chow JC, Young DW, Colenbock DT, et al. Toll-like receptor-4 mediates lipopolysaccharide-induced signal transduction. J Biol Chem. 1999;274:10689–92. doi: 10.1074/jbc.274.16.10689. [DOI] [PubMed] [Google Scholar]
- 38.Baeuerle PA, Baichwal VR. NF-κB as a frequent target for immunosuppressive and anti-inflammatory molecules. Adv Immunol. 1997;65:111–35. [PubMed] [Google Scholar]
- 39.Garin EH, Blanchard DK, Matsushima K, et al. IL-8 production by peripheral blood mononuclear cells in nephrotic patients. Kid Int. 1994;45:1311–7. doi: 10.1038/ki.1994.171. [DOI] [PubMed] [Google Scholar]
- 40.Bustos C, González E, Muley R, et al. Increase of tumour necrosis factor α synthesis and gene expression in peripheral blood mononuclear cells of children with idiopathic nephrotic syndrome. Eur J Clin Invest. 1994;24:799–805. doi: 10.1111/j.1365-2362.1994.tb02022.x. [DOI] [PubMed] [Google Scholar]
- 41.Suranyi MC, Guasch A, Hall BM, et al. Elevated levels of tumor necrosis factor-α in the nephrotic syndrome in humans. Am J Kidney Dis. 1993;121:251–9. doi: 10.1016/s0272-6386(12)80742-6. [DOI] [PubMed] [Google Scholar]
- 42.Daniel V, Trautmann Y, Konrad M, et al. T-lymphocyte populations, cytokines and other growth factors in serum and urine of children with idiopathic nephrotic syndrome. Clin Nephrol. 1997;47:289–97. [PubMed] [Google Scholar]
- 43.Essner R, Rhoades K, Mcbride WH, et al. IL-4 down-regulates IL-1 and TNF gene expression in human monocytes. J Immunol. 1989;142:3857–61. [PubMed] [Google Scholar]
- 44.Gautam S, Tebo JM, Hamilton TA. IL-4 suppresses cytokine gene expression induced by IFN-γ and/or IL-2 in murine peritoneal macrophages. J Immunol. 1992;148:1725–30. [PubMed] [Google Scholar]
- 45.Mijatovic T, Kruys V, Caput D, et al. Interleukin-4 and -13 inhibit tumor necrosis factor-α mRNA translatioal activation in lipopolysaccharide-induced mouse macrophages. J Biol Chem. 1997;272:14394–8. doi: 10.1074/jbc.272.22.14394. [DOI] [PubMed] [Google Scholar]


