Abstract
The phenotype and function of splenic DC populations from diabetes-prone NOD mice were chara-cterized and compared to DC from diabetes-resistant strains in the presence or absence of Flt3 ligand (FL) treatment. NOD mice were found to have significantly fewer CD8α+ DC than both B10.BR and C57BL/6 mice, and this defect was reversed by FL treatment. Freshly isolated CD8α+ and CD8α− DC from all three strains were found to express similar levels of costimulatory molecules and this was similar in both FL-treated and untreated animals. IL-12 p40 production was significantly lower in purified CD11c+ DC from NOD mice compared to DC from C57BL/6 or B10.BR mice. CD8α+ DC isolated from NOD mice produced lower levels of IL-12p40 than CD8α+ DC from C57CBL/6 and this was dependent on the nature of the stimulus given. In contrast both CD8α+ and CD8α− DC from FL-treated mice produced high levels of IL-12p40 following activation, but only the CD8α− DC produced IL-12p70. Functionally, freshly isolated CD8α− DC were more stimulatory than CD8α+ DC in a primary allogeneic mixed lymphocyte reaction. However, DC maturation resulted in increased T cell stimulatory capacity for both DC subsets, and this pattern was seen in all strains. These results demonstrate significant differences in phenotype and function of splenic NOD CD8α+ DC, and further suggest that FL treatment may reverse some of these abnormalities.
Keywords: APC, diabetes, cytokines, Flt3 ligand
INTRODUCTION
Although dendritic cells (DC) are known for their immunostimulatory capabilities, subsets of DC have been shown to regulate T cell responses [1,2]. In the mouse spleen, two phenotypically distinct DC populations can be isolated on the basis of CD8αα expression, and more recently additional populations, CD11b+/CD4+ and plasmacytoid DC, have been described [3–5]. CD8α+ and CD8α− DC have both been shown to initiate T cell activation [6,7]. However, after the initial activation CD8α− DC appeared to have the traditional stimulatory capacity associated with DC, whereas CD8α+ DC exerted regulatory effects on activated CD4+ and CD8+ T cell responses [1,2]. The regulatory effects of CD8α+ DC on CD8+ T cells were associated with a greatly diminished induction of IL-2 when compared to CD8α− DC-stimulated CD8+ T cells [1,8]. On the other hand, CD4+ T cells stimulated by CD8α+ DC were killed by Fas-mediated apoptosis, due to the presence of Fas-ligand on CD8α+ DC [2].
Recent in vivo experiments have suggested that CD8α+ DC induce Th1 immune responses and CD8α− DC direct Th2-dominated responses [6,7]. CD8α+ DC are reported to produce high levels of interleukin-12 (IL-12) and IFN-γ that promote the development of Th1 CD4+ T cells [9,10]. Recent studies showed that CD8α+ DC, but not CD8α− DC, differ in their antigen presentation capacity such that CD8α+ DC efficiently cross-present antigen to CD8+ T cells whereas CD8α− DC efficiently present antigen to CD4+ T cells [11,12]. Most recently it has been shown that CD8α+ DC are uniquely able to take up apoptotic cells, providing a mechanistic explanation for their ability to cross present cellular antigens to both CD4+ and CD8+ T cells [13]. These data suggest that CD8α+ DC are more than a specialized DC subset dedicated to regulating T cells. In addition, recent studies have revealed that CD8α+ DC can be generated from both myeloid and lymphoid precursors [14], as well as Langerhans cells [15] suggesting that the CD8α+ marker may be a maturation and/or functional marker rather than a lineage marker.
Insulin-dependent diabetes mellitus (IDDM) is caused by the progressive Th1-mediated autoimmune destruction of insulin producing β cells of the pancreatic islets of Langerhans. In the nonobese diabetic (NOD) mouse, an animal model for human IDDM, islet destruction is preceded by a period of insulitis during which the islets are infiltrated by antigen presenting cells and autoreactive T cells. DC have been implicated in the induction of diabetes since they are found among the earliest infiltrates of NOD islets [16]. In addition, the administration of IL-12 to NOD mice results in disease acceleration accompanied by DC accumulation in the pancreatic islets [17]. Although the precise mechanisms leading to the loss of tolerance to islet antigens have not been defined, defects in function and maturation of APC have been proposed [18]. We, and others, have studied bone-marrow-derived and splenic DC in NOD mice and have identified abnormalities when compared to diabetes-resistant strains [19–23]. Because of the differential roles defined for CD8α+ and CD8α− DC (regulatory versus stimulatory or Th1 versus Th2) in directing the immune response, this study aimed to determine phenotypical or functional differences in NOD CD8α+ and CD8α− DC that might contribute to islet autoimmunity.
MATERIALS AND METHODS
Mice
Four-week-old female NOD/LTJ (H-2g7), NOR (H-2g7) C57BL/6 (H-2b), B10.BR (H-2k) and SWR/J (H-2q) mice were obtained from Jackson laboratories (Bar Harbor, ME, USA). All mice were housed in a specific pathogen-free facility at the University of Pittsburgh and were treated under IACUC-approved guidelines in accordance with approved protocols.
Purification of splenic DC
DC were purified from the spleen as previously described [5], with modifications. Briefly, spleens were digested for 30 min at 37°C 0·5–1 ml of a 1 mg/ml collagenase type V (Sigma, St Louis, MO, USA) solution. Spleen fragments were passed through a steel mesh and RBC were depleted with ACK lysis buffer (Sigma). DC were enriched by passage over a 16% metrizamide gradient. T and B cells were depleted by antibody (anti-Thy1·2 and anti-B220) and complement treatment and DC were further purified by incubation with CD11c microbeads (Miltenyi Biotec, Auburn, CA, USA). This procedure yielded 60–80% pure DC populations.
Isolation of CD8α+ and CD8α− DC from either untreated or FL-treated mice
To maximize in vivo generation of DC, 6–12 week old NOD, B10.BR, or C57BL/6 were injected intraperitoneally for 10 consecutive days with 10 µg/day recombinant human Flt3L (FL) (kindly provided by Immunex, Seattle, WA, USA). Single cell spleen suspensions from either FL-treated or untreated mice were depleted of RBC and incubated with anti-CD8α magnetic beads (Miltenyi Biotec) and the CD8α− and CD8α+ splenic fractions were separated by passage over a magnet. T and B cells were depleted from both subsets by antibody and complement treatment. In the case of the CD8α− DC subset the anti-CD8 mAb (53·6.7) was included in the depletion cocktail. In some experiments, the CD8α− fraction was further incubated in anti-CD11c magnetic microbeads for further enrichment of the DC subset. This isolation method resulted in 70–90% purity for each DC subset.
DC cultures
To analyse DC maturation in vitro, CD8α+ and CD8α− DC isolated from FL-treated NOD and B10.BR mice were cultured (106 DC/well) overnight with 2·5 ng/ml GM-CSF (R & D Systems, Minneapolis, MN, USA) alone, 10 ng/ml TNF-α (Genzyme, Cambridge, MA, USA) alone or in combination. These cells were then analysed for their phenotype and immunostimulatory capability.
T cell isolation
Single cell spleen suspensions were prepared from SWR mice. Spleens were depleted of RBC and incubated on nylon wool columns for 45 min at 37°C. Following enrichment over nylon wool columns, the T cells were further purified by sorting on FACStarPlus (Becton Dickinson, San Jose, CA, USA) and/or MoFlo (Cytamation) after staining of the cells with PE-conjugated Thy1·2 mAb (PharMingen, San Diego, CA, USA). The average purity of T cells after sorting was 98–100% which would minimize any potential indirect presentation of alloantigen [24] and the viability was >90%.
Immunophenotypical analysis of DC
Immunophenotypical analyses of whole spleen, purified DC, freshly isolated and cultured CD8α+ and CD8α− DC subsets were performed by 1-, 2- or 3- colour staining with directly labelled monoclonal antibodies (mAbs). The mAbs used in these staining experiments consisted of mAbs to CD80, CD86, B220, CD11b, DEC-205 (NLDC145), I-Ag7 (10·2.16) CD8α, CD11c and appropriate isotype controls. To inhibit nonspecific FcR-mediated binding of mAb, cells were preincubated with 10 µg/ml anti-CD16/32 (PharMingen) for 10 min at room temperature prior to staining. Flow cytometric analyses were performed using a FACSVantage (Becton Dickinson) flow cytometer.
Induction of IL-12 from DC subsets
Splenic DC subsets from untreated or FL-treated mice were isolated as described above and DCs (1 × 10⁶/ml) were stimulated for 24–48 h in culture with Staphylococcus aureus Cowan I (SAC) (Sigma) (1 : 100) + IFN-γ (PharMingen) (50 ng/ml) + GM-CSF (2·5 ng/ml). After incubation the supernatants were collected, separated from cells by centrifugation and stored until analysis at −70°C. Alternatively, DCs (1 × 10⁶/ml) were stimulated with LPS (10 µg/ml) + IFN-γ, TNF-α (Pharminger)(20 ng/ml) or poly I:C (Sigma) (20 µg/ml) for 24 h. The resulting IL-12p40, IL-6 and IL-12p70 production was measured by specific ELISA as previously described [20,25]
Mixed lymphocyte reactions (MLRs)
The stimulatory capabilities of freshly isolated or cultured splenic CD8α+ and CD8α− DC from FL-treated mice were determined by allogeneic MLRs with SWR T cells. Briefly, increasing numbers of irradiated DCs (2000 RADs) were cultured with 2 × 10⁵/well FACS sorted splenic T cells. After 96 h, the cultures were pulsed with 0·5 µCi of [3H] thymidine for 18 h; the cells were harvested and counted in a β-scintillation counter.
Cytokine measurements following secondary MLR
Freshly isolated CD8α+ or CD8α− DCs (3 × 10⁵/ml) from the different mouse strains were cultured with FACS sorted SWR T cells (3 × 10⁶/ml) for 7 days in 12 well plates. After the 7-day primary stimulation, the T cells were collected and cultured (0·5 × 106/ml) with splenic T cell-depleted APCs (1 × 10⁶/ml) for 2 days in 48 well plates. Samples of the T cells collected from the 7 day MLR were submitted to phenotypical analysis, and were examined for the expression of CD62L and CD25 by labelling with PE-conjugated anti-CD62L mAb, FITC-conjugated anti-CD25 and Cy-Chrome- conjugated anti-CD4 mAb (PharMingen). Cells were also stained with Cy-Chrome anti-CD8 mAb in order to determine the CD4/CD8 ratio of T cells recovered from the long-term MLR assays and the 2 day restimulation assays. Flow cytometric analyses were performed using an EPICS-XL (Coulter). Culture supernatants from the primary MLR and the 2-day restimulation with APCs were collected and the levels of IFN-γ and IL-10 were measured by ELISA as previously described [26].
In vivo therapy with DC subsets
DC subsets were purified as described above and were pulsed for 5 h with a mixture of three peptides (GAD65 509–528; GAD65 524–543; hsp60 437–460) as previously described [27]. The cells were then washed in PBS and injected (4–5 × 10⁵/mouse) iv into 5 week-old NOD mice, which were then followed for the development of diabetes by the weekly monitoring of blood glucose levels (300 mg/dl).
Statistics
The statistical analyses were determined by Student's t-test with a P-value ≤0·05 denoting significance.
RESULTS
NOD mice have fewer CD8α+ DC than diabetes-resistant strains
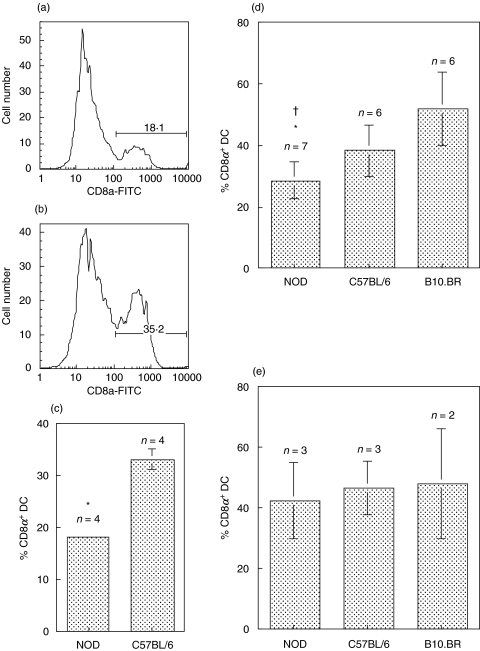
Flow cytometric analysis of whole spleen demonstrated two distinct populations of CD11c+ cells in the spleen based on CD8α expression (Fig. 1a,b). NOD mice had significantly fewer CD8α+ DC than C57BL/6 mice (P = 0·007) (Fig. 1a-c). This difference was also apparent following purification of the CD11c+ DC from spleen (Fig. 1d). The proportions of CD8α+ and CD8α− DC in the CD11c+ DC population purified from spleen appeared to vary substantially between individual strains. Interestingly, NOD mice had significantly fewer CD8α+/CD11c+ DC than either C57BL/6 (P = 0·03) or B10.BR (P = 0·001) (Fig. 1d). The diabetes resistant strain, NOR also showed a reduced number of CD8α+ DC (25% ± 2·9, n = 4), consistent with previous reports [21]. FL was used to expand DC number in the spleen to facilitate the phenotypical and functional characterization of CD8α+ and CD8α− subsets in NOD and B10.BR and C57BL/6 mouse strains. FL administration induces a profound expansion of various DC subsets in various tissues including the spleen, and has recently been shown to induce the preferential expansion of the CD8α+/CD11c+ DC population [28,29]. After FL treatment, the apparent defect in the number of CD8α+/CD11c+ DC in NOD mice was reversed and no differences between the strains were observed (Fig. 1e).
Fig. 1.
NOD mice have fewer CD8α+ DC in the spleen than diabetes-resistant strains. Histograms of CD8α expression on gated CD11c+ cells from whole spleen are shown for (a) NOD and (b) C57BL/6. The numbers represent the percentages of CD11c+ DC that express CD8α. (c) The mean ± SD of the percentage CD11c+ CD8α+ DC from 4 individual NOD or C57BL/6 mice are presented in the bar graph. *P = 0·0007 NOD compared to C57BL/6. (d) Similar results were obtained following purification of CD11c+ DC from untreated NOD, C57BL/6 and B10.BR mice. The means ± SD of the percentage CD11c+ CD8α+ DC from 6 to 7 experiments are shown. *P = 0·03 NOD compared to C57BL/6; †P = 0·001 NOD compared to B10.BR. (e) FL treatment reverses the defect in the proportion of CD8α+ DC in NOD mice. The proportions of CD8α+ DC were obtained from FACS analysis of whole spleen, gated on CD11c+ cells. The means ± SD of the percentage CD11c+ CD8α+ DC from 2 to 3 experiments are shown. In all cases side-by-side experiments of DC from NOD with one or both diabetes resistant strains were performed.
The phenotype of CD8α+ and CD8α− DC from FL-treated diabetes-prone and diabetes-resistant mice was assessed by flow cytometry. As previously reported [30], significant differences in expression levels of DEC-205 and CD11b were observed between CD8α+ and CD8α− DC within strains (data not shown). No significant differences in the expression levels of any of the cell surface markers tested were observed between diabetes prone (NOD) and diabetes resistant (B10.BR and C57BL.6) strains (data not shown). Similar results were obtained using DC subsets purified from mice that were not FL-treated (data not shown).
Phenotype of cultured DC
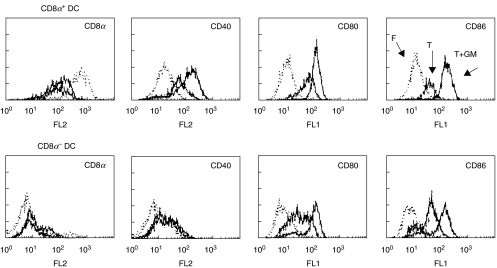
Several stimuli are known to activate DC including microbial components, inflammatory cytokines, and CD40 triggering. To analyse the maturation of splenic DC in response to GM-CSF or TNF-α, purified CD8α+ and CD8α− DC isolated from FL-treated mice were cultured overnight in the presence of these cytokines. Both GM-CSF and TNF-α cultures induced up-regulation of costimulation and activation markers (CD80, CD86 and CD40) to similar levels in both subsets (Fig. 2). In both subsets, up-regulation of CD80, CD86 and CD40 occurred less efficiently after overnight culture in TNF-α alone as compared to culture systems utilizing GM-CSF + TNF-α (Fig. 2). The up-regulation of CD40 expression was more marked in the CD8α+ DC population, since only minimal up-regulation of CD40 was noted in the CD8α− DC (Fig. 2), and in this case GM-CSF was no better than TNF-α. Interestingly, CD8α expression on the CD8α+ DC decreased after overnight culture in either TNF- α or GM-CSF + TNF-α. CD8α+ and CD8α− DC from B10.BR mice cultured in GM-CSF and TNF-α showed similar results to those seen with NOD mice (data not shown).
Fig. 2.
Overnight culture in cytokines induced DC maturation. Phenotype of splenic DC subsets from FL-treated mice after overnight culture in TNF-αalone (T, thick dark line) or in combination with GM-CSF (T+GM, thin solid line) as compared to freshly isolated (F, dotted line) DC. Results are representative of 3 experiments.
Splenic DC from NOD produce less IL-12p40
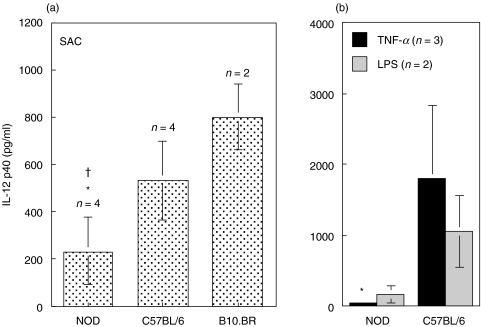
DC produce biologically active IL-12 (IL-12p70) upon microbial stimulation and CD40 triggering [9,31]. CD11c+ DC, purified from the spleen of NOD, C57BL/6 and B10.BR mice, were stimulated with SAC/IFN-γ/GM-CSF. No IL-12p70 was detected in these cultures but high levels of IL-12p40 were observed (Fig. 3a). DC from NOD mice produced significantly less IL-12p40 than DC from C57BL/6 (P = 0·03) and B10.BR (P = 0·009). Similar results were obtained when the DC were stimulated with either TNF-α or LPS/IFN-γ (Fig. 3b). DC from NOD mice produced significantly less IL-12p40 in response to TNF-α than DC from C57BL/6 mice (P = 0·04).
Fig. 3.
DC from NOD mice produced low levels of IL-12p40. (A) Purified splenic CD11c+DC from untreated mice were cultured for 24 h with SAC/IFN-γ/GM. IL-12 p40 production was significantly lower in NOD than C57BL/6 or B10.BR DC (*P = 0·03 and P = 0·009, respectively). (b) IL-12p40 production by DCs following 24 h incubation with TNF-α (▪) or LPS/IFN-γ ( ). IL-12p40 was lower in NOD compared to C57BL/6 DC (*P = 0·04) following stimulation with TNF-α. No IL-12 p70 was detected. Results are presented as the mean of cytokine production ± SD of the indicated number of side-by-side experiments.
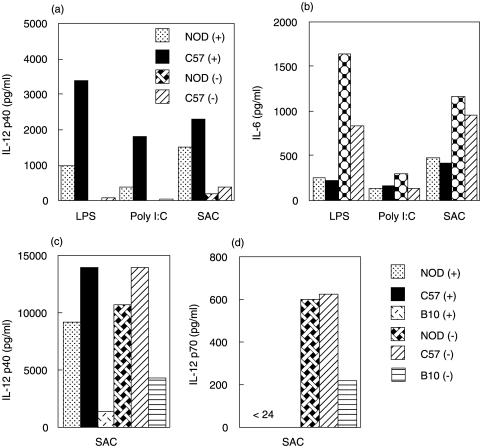
In order to determine if the observed difference was confined to a particular DC subset, splenic CD8α+ and CD8α− DC from untreated and FL-treated mice were activated with various stimuli. In general CD8α+ DC produced higher levels of IL-12p40 than CD8α− DC (Fig. 4a). CD8α+ DC from NOD mice produced lower levels of IL-12p40 than DC from C57BL/6 (Fig. 4a), and this was most apparent when the DC were stimulated with either LPS/IFN-γ or poly I:C. When the same supernatants were analysed for the presence of IL-6, similar levels of IL-6 were observed from both strains and both DC subsets (Fig. 4b). No IL-12p70 was detected following the stimuli used in these experiments for either of the DC subsets (data not shown).
Fig. 4.
CD8α+ DC from NOD produce low levels of Il-12p40 and this is reversed by FL treatment. (a, b) Purified CD8α+ and CD8α− DC from untreated NOD and C57BL/6 were stimulated with the indicated stimuli. Supernatants were collected after 24 h and examined for the presence of (a) IL-12 p40 (b) IL-6 and IL-12p70 (not detected). The results shown are representative of 2–4 independent experiments. (c, d) Purified CD8α+ and CD8α− DC from FL-treated mice were stimulated with SAC/IFN-γ/GM as described in the methods and examined for the production of (c) IL-12 p40 and (d) IL-12p70. The results shown are representative of 3 independent experiments.
Following FL treatment both DC subsets produced similar amounts of IL-12p40 (Fig. 4c), whereas IL-12p70 was only produced by CD8α− DC (Fig. 4d). There were no apparent differences in the levels of IL-12p40 production between NOD and the other strains, suggesting the FL treatment had reversed this phenotype in NOD mice. Although the levels of IL-12 p40 appeared lower in DC from B10.BR mice this was not a consistent finding.
Mixed lymphocyte reactions
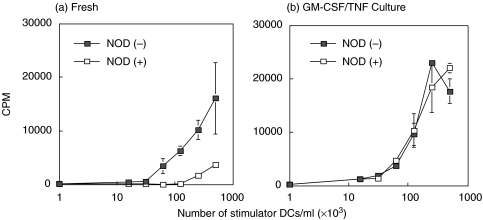
To determine if the two distinct subgroups of splenic DC in NOD show differential effects on T cell proliferation in comparison to nondiabetic strains, splenic CD8α+ and CD8α− DC isolated from the different strains were cultured with FACS sorted allogeneic SWR T cells. As shown in Fig. 5a, freshly isolated NOD CD8α− DC from FL-treated mice were more stimulatory in allogeneic MLRs than NOD CD8α+ DC. A similar pattern was obtained in MLRs utilizing splenic DC isolated from the B10.BR and C57BL/6 (data not shown). After overnight GM-CSF + TNF-α culture which induced up-regulation of costimulatory molecules in both subsets (Fig. 2), NOD CD8α+ and CD8α− DC were found to activate T cells to a comparable degree (Fig. 5b).
Fig. 5.
Proliferation of allogeneic SWR T cells in response to fresh (a) or cultured (b) splenic CD8α+ and CD8α− DC from FL-treated NOD mice.  NOD(–); □ NOD(+) After overnight culture in TNF-α + GM-CSF, CD8α+and CD8α− DC induce similar levels of proliferation in SWR T cells. Results represent the mean ± SD of triplicate cultures from a representative experiment of 3 MLR assays.
CD8α+ or CD8α− DC induced Th1 cytokines in allogeneic MLR
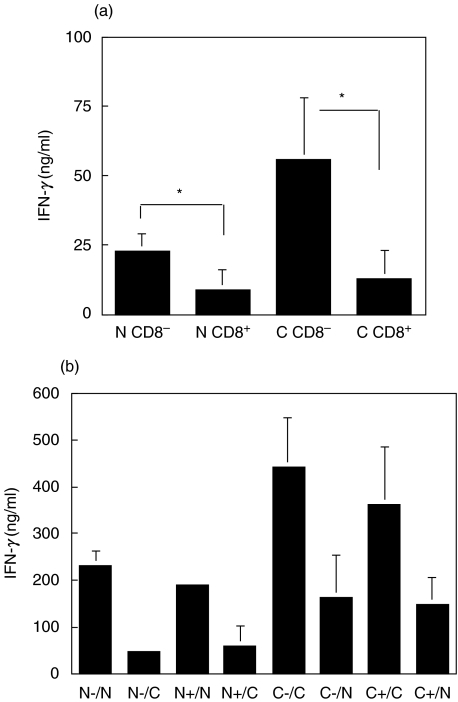
The cytokine production levels in 7 day allogeneic MLRs stimulated by CD8α+ or CD8α− DC from the different strains was determined by ELISA. In these cultures, CD8α− DC induced higher IFN-γ production from the allogeneic T cells (Fig. 6a). No IL-10 was detected at 7 days in supernatants from any of the cultures (data not shown).
Fig. 6.
IFN-γ production by SWR T cells in a 7-day primary DC stimulation and upon restimulation with splenic APC. (a) IFN-γ production following 7 day primary stimulation of SWR T cells with CD8α+ and CD8α− DC from FL-treated NOD or C57BL/6 mice (N = NOD; C = C57BL/6) (P-values: 0·033 *N CD8−versus N CD8+ 0·035 *C CD8−versus C CD8+). (b) IFN-γ production following a 2-day restimulation of SWR T cells with T-cell depleted NOD or C57BL/6 APCs. Following a primary stimulation for 7 days, T cells were collected and restimulated (0·5 × 106/ml) with splenic NOD or C57BL/6 APC (1 × 10⁶/ml) for 2 days. (N-/N = NOD CD8α− DC as primary stimulator/NOD APC as secondary stimulator, etc.). Results presented in (a) and (b) are the means ± SD of 2–4 experiments.
To determine if exposure to CD8α+ DC had induced anergy in the responding T cells, T cells were collected subsequent to a 7-day primary stimulation with NOD and C57BL/6 DC and cultured with T cell-depleted NOD or C57BL/6 splenocytes for 2 days. With both strains, regardless of whether CD8α+ or CD8α− DC were used as the primary stimulators, similar levels of IFN-γ production were detected upon restimulation with APC from the corresponding mouse strain (Fig. 6b). Much lower levels of IFN-γ were detected when the T cells were stimulated with third party APC, demonstrating the specificity of the response. Very low levels of IL-10 were produced after restimulation, and no differences were observed either between DC subsets or between strains (data not shown).
It was possible that the difference in IFN-γ production in MLRs stimulated by CD8α+ and CD8α− DC in the primary MLR reflected differences in the total number of T cells that expanded in the cultures. The numbers of total live T cells recovered after the primary culture were counted and no significant difference in recovery was observed (Table 1). In addition, no significant difference in the CD4/CD8 ratio in the responding populations was observed in any of these cultures (Table 1). We also determined the percentage of activated CD4+ cells by determining the percentage of cells exhibiting an increase in forward scatter. Although the trend suggested that both NOD and C57BL/6 CD8α− DC activated a larger proportion of SWR blasts than CD8α+ DC, this difference was not statistically significant (Table 1).
Table 1.
Yield and phenotype of SWR T cells recovered after 7-day MLR with DC populations
| CD8α− DC | CD8α+ DC | |
|---|---|---|
| % T cell recovery* | ||
| ″NOD | 94.0 ± 20.0 | 53.0 ± 28·7 |
| ″C57BL/6 | 132.0 ± 64.0 | 70.0 ± 43·4 |
| CD4/CD8 ratio† | ||
| ″NOD | 2·03 ± 0·31 | 1·6 ± 0·1 |
| ″C57BL/6 | 2·6 ± 0·95 | 1·7 ± 0·01 |
| % CD4 lymphoblast† | ||
| ″NOD | 11·4 ± 2·04 | 8·9 ± 0·8 |
| ″C57BL/6 | 16·4 ± 2·3 | 8·7 ± 2·3 |
Results represent percentage of input T cells recovered (± SD) from 3–4 experiments.
Results are the average ± SD of two experiments.
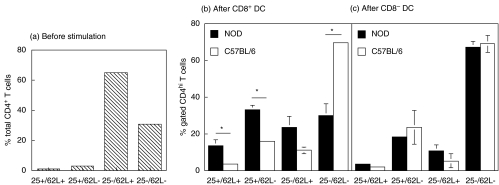
To better characterize the T cell populations present in CD8α+ and CD8α− DC-stimulated 7 day cultures in terms of activation phenotype, as well as, regulatory phenotype, splenic T cells recovered from these cultures were stained with anti-CD4, CD62L and CD25 mAbs and analysed by flow cytometry. We analysed the expression of this set of markers because they allow the distinction between naïve (CD25−/CD62L+), activated (CD25+/CD62L−), resting (CD25−/CD62L−) and regulatory (CD25+/CD62L+) T cells. The responder CD4+ T cells were divided into CD4low and CD4high subgroups. CD4high cells have been shown to contain the majority of antigen reactive cells in mixed lymphocyte cultures as well as in vivo[32]. In our case, all of the activated cells were found in the CD4high population. NOD CD8α+ DC-stimulated T cells contained significantly higher percentages of CD25+CD62L+ (P = 0·05), CD25+CD62L− (P = 0·01) and lower CD25− CD62L− (P = 0·01) CD4+ T cells than C57BL/6 CD8α+ DC-stimulated CD4+ T cells (Fig. 7).
Fig. 7.
Phenotype of SWR CD4+ T cells following 7-day culture with splenic DC from NOD and C57BL/6. Following incubation, the cells were collected, stained with anti-CD4, -CD62L and -CD25 mAbs and analysed using flow cytometry. (a) Phenotypical profile of SWR T cells prior to incubation with DC subsets. (b, c) Percentage of CD4hi T cells with the CD25+/CD62L+ (regulatory), CD25+/CD62L− (activated), CD25−/CD62L+ (naïve) and CD25−/CD62L− (resting) phenotype following stimulation by CD8α+ DC (b) or CD8α− DC (c) from NOD (▪) or C57BL/6 (□) mice. *P = 0·048: CD25+/CD62L + T cells stimulated by NOD CD8α+ DC versus C57BL/6 CD8α+ DC; *P = 0·010: CD25+/CD62L- T cells stimulated by NOD CD8α+ DC versus C57BL/6 CD8α+ DC; *P = 0·0123: CD25-/CD62L- T cells stimulated by NOD CD8α+ DC versus C56BL/6 CD8α+ DC. Results represent the means ± SD of 2 experiments.
Both CD8α+ and CD8α− DC delay the onset of diabetes in NOD mice
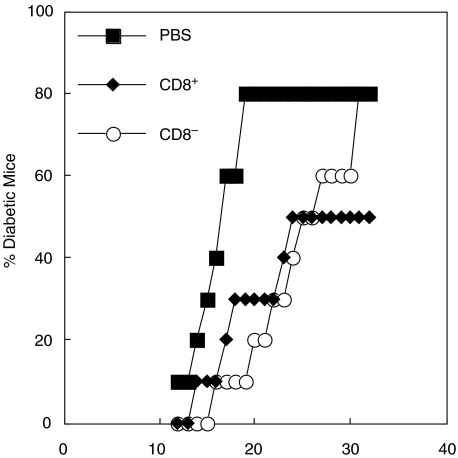
In order to determine whether CD8α+ or CD8α− DC would influence the onset of diabetes in NOD mice, 5 week-old NOD mice were given a single injection of purified DC from FL treated mice and followed for the development of diabetes. Both DC populations were able to induce a slight delay in the onset of diabetes (Fig. 8) and mice receiving CD8α+ DC had a reduced incidence overall, but these differences were not statistically significant (P > 0·05). These results are suggestive but merit confirmation using DC at different stages of maturation [27].
Fig. 8.
DC subsets can modulate the development of diabetes in NOD mice. Ability of CD8+ (♦) and CD8− (○) splenic DC to modulate diabetes development in NOD mice. NOD mice (5 weeks of age; 10 mice/group) were given peptide-pulsed DC (4 × 10⁵ DC/mouse iv) as described in the methods and were monitored for the development of diabetes. Control mice received an iv injection of PBS (▪). Results shown are from two independent experiments.
DISCUSSION
It has been suggested that defects in APC function contribute to the development of autoreactive CD4+ and CD8+ T cells responsible for the destruction of pancreatic β cells in IDDM [18]. Several mechanisms have been proposed to explain how APC may contribute to IDDM development in the NOD mice, including defects in negative selection [33] and in the induction of regulatory/tolerogenic mechanisms in the periphery [34]. Dendritic cells (DC) have the unique ability to prime naïve T-cells, and they regulate the nature and extent of immune responses initiated. In the murine spleen, two major populations of DC have been identified based on CD8α expression. CD8α− DC were considered a classical immunogenic DC population, whereas CD8α+ DC were thought to have tolerogenic activity [1,2]. On the other hand, CD8α+ DC have also been shown to produce high amounts of IL-12 when pulsed with Ag in vitro and to initiate Th1 responses when injected into recipient hosts [6,7]. These two conflicting properties of CD8α+ DC (tolerogenic versus Th-1 promoting activity), which have the potential to abrogate or enhance IDDM, respectively, were studied in the context of the NOD mouse in order to identify differences that might contribute to the development of autoimmunity.
Phenotypic analysis of the DC subsets revealed that NOD mice had significantly fewer CD8α+ DC when compared to B10.BR and C57BL/6. A quantitative defect in this population could result in a reduced ability to take up and remove dead cells, a function recently attributed to the CD8α+ DC [13] that is likely to be important for the maintenance of self-tolerance [35]. Recent reports have shown that activation of NKT cells, using α-Gal-Cer, protects NOD mice through the induction of a protective DC population [36,37]. NKT cells are deficient in NOD mice [38] and this might be related to a defect in CD8α+ DC since CD1d, the NKT cell restriction element, is primarily expressed by this DC population [37]. On the other hand, CD8α+ DC have been shown to drive Th1 differentiation in some systems [9,10], although this property is influenced by the nature of the maturation signal delivered to the DC [39,40]. Our results show that when NOD mice were treated with FL the defect in CD8α+ DC number was no longer apparent, and this is consistent with the recently reported function of FL in DC subset expansion [28,29]. In these studies it was shown that treatment with murine FL led to a preferential increase in CD8α+ DC, whereas when human FL was administered there was a more even increase in both DC subsets [29]. In our studies, we used human FL and found that, in NOD mice the apparent defect in CD8α+ DC was reversed, whereas there was equal expansion of both subsets in the other strains tested. These data suggest that further investigation of DC ontogeny in NOD mice is warranted. There is no evidence to date that FL treatment either accelerates or prevents diabetes development in NOD mice, and this is an area of further investigation.
Since IDDM is a Th1-mediated autoimmune disease, we looked at the ability of splenic DC subsets to produce the cytokine IL-12. The fact that NOD splenic DC produced significantly lower levels of IL-12p40 than DC from other strains suggested a defect in the production of the inactive/antagonist IL-12p40 in NOD DC. IL-12p40 production by NOD macrophages been previously studied and an increase in IL-12p40 production by macrophages was reported [41]. Reduced serum levels of IL-12p40 following in vivo LPS administration to NOD mice have also been reported [42]. In both murine and human systems, the p40 homodimer and to a lesser extent the dissociated, free p40 monomer, can suppress the responsiveness to IL-12 by competitively inhibiting the IL-12 receptor binding [43]. It has previously been shown that administration of IL-12p40 to young NOD mice prevents the onset of diabetes by inducing a Th2 response [44,45]. In addition, the gene for IL-12p40 has been implicated as a susceptibility locus in human diabetes [46]. Thus, the lower levels of IL-12p40 induced in NOD DC might play a significant role in the skewing towards Th1 responses that is a prominent feature of the NOD immune system [47].
In this study, we found that IL-12p70 was only produced by CD8α− DC after stimulation with SAC/IFN-γ/GM in all strains and this was only seen in FL-treated mice. The levels of IL-12 p40 production were also increased in CD8α− DC from FL-treated mice. This is in contrast to results by other groups who reported higher IL-12 induction in the CD8α+ subset [6,7]. However, other authors have also reported IL-12 production by CD8α− DC following stimulation with known Th1 skewing adjuvants, such as LPS or P. acnes[39,40]. The effects of FL on DC maturation and development are still being characterized, but recent reports have suggested that the ability of CD8α− DC to produce IL-12 is increased following in vivo FL administration [29].
CD8α+ DC had a reduced ability to stimulate allogeneic T cells in an MLR compared to CD8α− DC and this was enhanced following maturation with GM+TNF-α such that both DC subsets stimulated T cells to the same extent. This is in agreement with a recent study in C57BL/6 and BALB/c mice which showed that splenic DCs reside in the tissue in an immature state and that DC maturation is necessary for optimal activation of naïve CD4 and CD8 T cells [48]. It is interesting that despite the low level of T cell response in the presence of CD8α+ DC, the T cells in these cultures could be restimulated with APC from the corresponding mouse strain to produce high levels of IFN-γ, indicating that these T cells had not been made anergic during this period. It is also interesting that the responder allogeneic T cells recovered from long-term cultures with NOD CD8α+ DC had a higher frequency of CD25+/CD62L+(regulatory) and CD25+/CD62L−(activated) CD4+ T cells compared to similar cultures using C57BL/6 CD8α+ DC. In experiments addressing whether APC restimulation of T cells previously primed by CD8α+ and CD8α− DC would drive Th1- or Th2-responses, we found that both CD8α+ and CD8α− DC priming preferentially induced the Th1 cytokine, IFN-γ, with little or no IL-10 production in both NOD and C57BL/6 mice. Thus, it can be concluded that both DC populations can function as DC1 under these conditions.
In conclusion, these results demonstrate significant quantitative and qualitative differences in splenic DC populations from NOD mice when compared to diabetes-resistant strains. The reduced number of CD8α+ DC in NOD mice could have important implications for the maintenance of self-tolerance. The fact that NOD DC produce lower levels of the antagonist IL-12p40 could be responsible for a disposition towards Th1 responses [47], leading to the development of a destructive autoimmune response in these mice. The role of FL in reversing the defect in CD8α+ DC numbers and in altering the cytokine production pattern by DC subsets deserves further attention in the context of the NOD mouse.
Acknowledgments
We would like to thank Immunex for the kind gift of FL. We thank Bob Lakomy for expert flow cytometric help and Dewayne Falkner for expert technical assistance. We thank Drs Walter Storkus and Bill Ridgway for thoughtful comments. This work was supported by NIH grant # CA73743
REFERENCES
- 1.Kronin V, Winkel K, Suss G, Kelso A, Heath W, Kirberg J, von Boehmer H, Shortman K. A subclass of dendritic cells regulates the response of naive CD8 T cells by limiting their IL-2 production. J Immunol. 1996;157:3819–27. [PubMed] [Google Scholar]
- 2.Suss G, Shortman K. A subclass of dendritic cells kills CD4 T cells via Fas/Fas-ligand-induced apoptosis. J Exp Med. 1996;183:1789–96. doi: 10.1084/jem.183.4.1789. [DOI] [PMC free article] [PubMed] [Google Scholar]
- 3.Nakano H, Yanagita M, Gunn MD. CD11c(+)B220(+)Gr-1(+) cells in mouse lymph nodes and spleen display characteristics of plasmacytoid dendritic cells. J Exp Med. 2001;194:1171–8. doi: 10.1084/jem.194.8.1171. [DOI] [PMC free article] [PubMed] [Google Scholar]
- 4.Vremec D, Zorbas M, Scollay R, Saunders DJ, Ardavin CF, Wu L, Shortman K. The surface phenotype of dendritic cells purified from mouse thymus and spleen: investigation of the CD8 expression by a subpopulation of dendritic cells. J Exp Med. 1992;176:47–58. doi: 10.1084/jem.176.1.47. [DOI] [PMC free article] [PubMed] [Google Scholar]
- 5.Vremec D, Pooley J, Hochrein H, Wu L, Shortman K. CD4 and CD8 expression by dendritic cell subtypes in mouse thymus and spleen. J Immunol. 2000;164:2978–86. doi: 10.4049/jimmunol.164.6.2978. [DOI] [PubMed] [Google Scholar]
- 6.Pulendran B, Smith JL, Caspary G, Brasel K, Pettit D, Maraskovsky E, Maliszewski CR. Distinct dendritic cell subsets differentially regulate the class of immune response in vivo. Proc Natl Acad Sci USA. 1999;96:1036–41. doi: 10.1073/pnas.96.3.1036. [DOI] [PMC free article] [PubMed] [Google Scholar]
- 7.Maldonado-Lopez R, de Smedt T, Michel P, Godfroid J, Pajak B, Heirman C, Thielemans K, Leo O, Urbain J, Moser M. CD8α+ and CD8α− subclasses of dendritic cells direct the development of distinct T helper cells in vivo. J Exp Med. 1999;189:587–92. doi: 10.1084/jem.189.3.587. [DOI] [PMC free article] [PubMed] [Google Scholar]
- 8.Winkel KD, Kronin V, Krummel MF, Shortman K. The nature of the signals regulating CD8 T cell proliferative responses to CD8α+ or CD8α- dendritic cells. Eur J Immunol. 1997;27:3350–9. doi: 10.1002/eji.1830271234. [DOI] [PubMed] [Google Scholar]
- 9.Hochrein H, Shortman K, Vremec D, Scott B, Hertzog P, O'Keeffe M. Differential production of IL-12, IFN-α, and IFN-γ by mouse dendritic cell subsets. J Immunol. 2001;166:5448–55. doi: 10.4049/jimmunol.166.9.5448. [DOI] [PubMed] [Google Scholar]
- 10.Ohteki T, Fukao T, Suzue K, Maki C, Ito M, Nakamura M, Koyasu S. Interleukin 12-dependent interferon gamma production by CD8α+ lymphoid dendritic cells. J Exp Med. 1999;189:1981–6. doi: 10.1084/jem.189.12.1981. [DOI] [PMC free article] [PubMed] [Google Scholar]
- 11.Pooley JL, Heath WR, Shortman K. Cutting edge: intravenous soluble antigen is presented to CD4 T cells by CD8− dendritic cells, but cross-presented to CD8 T cells by CD8+ dendritic cells. J Immunol. 2001;166:5327–30. doi: 10.4049/jimmunol.166.9.5327. [DOI] [PubMed] [Google Scholar]
- 12.den Haan JM, Lehar SM, Bevan MJ. CD8(+) but not CD8(-) dendritic cells cross-prime cytotoxic T cells in vivo. J Exp Med. 2000;192:1685–96. doi: 10.1084/jem.192.12.1685. [DOI] [PMC free article] [PubMed] [Google Scholar]
- 13.Iyoda T, Shimoyama S, Liu K, et al. The CD8+ dendritic cell subset selectively endocytoses dying cells in culture and in vivo. J Exp Med. 2002;195:1289–302. doi: 10.1084/jem.20020161. [DOI] [PMC free article] [PubMed] [Google Scholar]
- 14.Traver D, Akashi K, Manz M, Merad M, Miyamoto T, Engleman EG, Weissman IL. Development of CD8α-positive dendritic cells from a common myeloid progenitor. Science. 2000;290:2152–4. doi: 10.1126/science.290.5499.2152. [DOI] [PubMed] [Google Scholar]
- 15.Merad M, Fong L, Bogenberger J, Engleman EG. Differentiation of myeloid dendritic cells into CD8α-positive dendritic cells in vivo. Blood. 2000;96:1865–72. [PubMed] [Google Scholar]
- 16.Jansen A, Homo-Delarche F, Hooijkaas H, Leenen PJ, Dardenne M, Drexhage HA. Immunohistochemical characterization of monocytes-macrophages and dendritic cells involved in the initiation of the insulitis and β-cell destruction in NOD mice. Diabetes. 1994;43:667–75. doi: 10.2337/diab.43.5.667. [DOI] [PubMed] [Google Scholar]
- 17.Trembleau S, Penna G, Bosi E, Mortara A, Gately MK, Adorini L. Interleukin 12 administration induces T helper type 1 cells and accelerates autoimmune diabetes. J Exp Med. 1995;181:817–21. doi: 10.1084/jem.181.2.817. [DOI] [PMC free article] [PubMed] [Google Scholar]
- 18.Serreze DV. Autoimmune diabetes results from genetic defects manifest by antigen presenting cells. FASEB J. 1993;7:1092–6. doi: 10.1096/fasebj.7.11.8370480. [DOI] [PubMed] [Google Scholar]
- 19.Dahlen E, Hedlund G, Dawe K. Low CD86 expression in the nonobese diabetic mouse results in the impairment of both T cell activation and CTLA-4 up-regulation. J Immunol. 2000;164:2444–56. doi: 10.4049/jimmunol.164.5.2444. [DOI] [PubMed] [Google Scholar]
- 20.Feili-Hariri M, Morel PA. Phenotypic and functional characteristics of BM-derived DC from NOD and non diabetes-prone strains. Clin Immunol. 2001;98:133–42. doi: 10.1006/clim.2000.4959. [DOI] [PubMed] [Google Scholar]
- 21.Steptoe RJ, Ritchie JM, Harrison LC. Increased generation of dendritic cells from myeloid progenitors in autoimmune-prone nonobese diabetic mice. J Immunol. 2002;168:5032–41. doi: 10.4049/jimmunol.168.10.5032. [DOI] [PubMed] [Google Scholar]
- 22.Weaver DJJ, Poligone B, Bui T, Abdel-Motal UM, Baldwin ASJ, Tisch R. Dendritic cells from nonobese diabetic mice exhibit a defect in NF-kappa B regulation due to a hyperactive I kappa B kinase. J Immunol. 2001;167:1461–8. doi: 10.4049/jimmunol.167.3.1461. [DOI] [PubMed] [Google Scholar]
- 23.Boudaly S, Morin J, Berthier R, Marche P, Boitard C. Altered dendritic cells (DC) might be responsible for regulatory T cell imbalance and autoimmunity in nonobese diabetic (NOD) mice. Eur Cytok Netw. 2002;13:29–37. [PubMed] [Google Scholar]
- 24.Bedford P, Garner K, Knight SC. MHC class II molecules transferred between allogeneic dendritic cells stimulate primary mixed leukocyte reactions. Int Immunol. 1999;11:1739–44. doi: 10.1093/intimm/11.11.1739. [DOI] [PubMed] [Google Scholar]
- 25.Feili-Hariri M, Falkner DH, Gambotto A, Papworth GD, Watkins SC, Robbins PD, Morel PA. Dendritic cells transduced to express IL-4 prevent diabetes in nonobese diabetic mice with established insulitis. Human Gene Ther. 2003;14:13–23. doi: 10.1089/10430340360464679. [DOI] [PubMed] [Google Scholar]
- 26.Feili-Hariri M, Falkner DH, Morel PA. Regulatory Th2 response induced following adoptive transfer of dendritic cells in prediabetic NOD mice. Eur J Immunol. 2002;32:2021–30. doi: 10.1002/1521-4141(200207)32:7<2021::AID-IMMU2021>3.0.CO;2-J. [DOI] [PubMed] [Google Scholar]
- 27.Feili-Hariri M, Dong X, Alber SM, Watkins SC, Salter RD, Morel PA. Immunotherapy of NOD mice with bone marrow-derived dendritic cells. Diabetes. 1999;48:2300–8. doi: 10.2337/diabetes.48.12.2300. [DOI] [PubMed] [Google Scholar]
- 28.Daro E, Butz E, Smith J, Teepe M, Maliszewski C, McKenna HJ. Comparison of the functional properties of murine dendritic cells generated in vivo with Flt3 ligand, GM-CSF and Flt3 ligand plus GM-CSF. Cytokine. 2002;3:119–30. doi: 10.1006/cyto.2001.0995. [DOI] [PubMed] [Google Scholar]
- 29.O'Keeffe M, Hochrein H, Vremec D, Pooley J, Evans R, Woulfe S, Shortman K. Effects of administration of progenipoietin 1, Flt-3 ligand, granulocyte colony-stimulating factor, and pegylated granulocyte-macrophage colony-stimulating factor on dendritic cell subsets in mice. Blood. 2002;99:2122–30. doi: 10.1182/blood.v99.6.2122. [DOI] [PubMed] [Google Scholar]
- 30.Maraskovsky E, Brasel K, Teepe M, Roux ER, Lyman SD, Shortman K, McKenna HJ. Dramatic increase in the numbers of functionally mature dendritic cells in Flt3 ligand-treated mice: multiple dendritic cell subpopulations identified. J Exp Med. 1996;184:1953–62. doi: 10.1084/jem.184.5.1953. [DOI] [PMC free article] [PubMed] [Google Scholar]
- 31.Cella M, Scheidegger D, Palmer-Lehmann K, Lane P, Lanzavecchia A, Alber G. Ligation of CD40 on dendritic cells triggers production of high levels of interleukin-12 and enhances T cell stimulatory capacity: T-T help via APC activation. J Exp Med. 1996;184:747–52. doi: 10.1084/jem.184.2.747. [DOI] [PMC free article] [PubMed] [Google Scholar]
- 32.Krieger NR, Fathman CG, Shaw MK, Ridgway WM. Identification and characterization of the antigen-specific subpopulation of alloreactive CD4+ T cells in vitro and in vivo. Transplantation. 2000;69:605–9. doi: 10.1097/00007890-200002270-00023. [DOI] [PubMed] [Google Scholar]
- 33.Kishimoto H, Sprent J. A defect in central tolerance in NOD mice. Nature Immunol. 2001;2:1025–31. doi: 10.1038/ni726. [DOI] [PubMed] [Google Scholar]
- 34.Bach JF, Chatenoud L. Tolerance to islet autoantigens in type 1 diabetes. Annu Rev Immunol. 2001;19:131–61. doi: 10.1146/annurev.immunol.19.1.131. [DOI] [PubMed] [Google Scholar]
- 35.Steinman RM, Nussenzweig MC. Avoiding horror autotoxicus: the importance of dendritic cells in peripheral T cell tolerance. Proc Natl Acad Sci USA. 2002;99:351–8. doi: 10.1073/pnas.231606698. [DOI] [PMC free article] [PubMed] [Google Scholar]
- 36.Sharif S, Arreaza GA, Zucker P, et al. Activation of natural killer T cells by alpha-galactosylceramide treatment prevents the onset and recurrence of autoimmune Type 1 diabetes. Nature Med. 2001;7:1057–62. doi: 10.1038/nm0901-1057. [DOI] [PubMed] [Google Scholar]
- 37.Naumov YN, Bahjat KS, Gausling R, et al. Activation of CD1d-restricted T cells protects NOD mice from developing diabetes by regulating dendritic cell subsets. Proc Natl Acad Sci USA. 2001;98:13838–43. doi: 10.1073/pnas.251531798. [DOI] [PMC free article] [PubMed] [Google Scholar]
- 38.Hammond KJ, Pellicci DG, Poulton LD, Naidenko OV, Scalzo AA, Baxter AG, Godfrey DI. CD1d-restricted NKT cells: an interstrain comparison. J Immunol. 2001;167:1164–73. doi: 10.4049/jimmunol.167.3.1164. [DOI] [PubMed] [Google Scholar]
- 39.Huang LY, Reis e Sousa C, Itoh Y, Inman J, Scott DE. IL-12 induction by a TH1-inducing adjuvant in vivo: dendritic cell subsets and regulation by IL-10. J Immunol. 2001;167:1423–30. doi: 10.4049/jimmunol.167.3.1423. [DOI] [PubMed] [Google Scholar]
- 40.MacDonald AS, Straw AD, Bauman B, Pearce EJ. CD8− dendritic cell activation status plays an integral role in influencing Th2 response development. J Immunol. 2001;167:1982–8. doi: 10.4049/jimmunol.167.4.1982. [DOI] [PubMed] [Google Scholar]
- 41.Alleva DG, Pavlovich RP, Grant C, Kaser SB, Beller DI. Aberrant macrophage cytokine production is a conserved feature among autoimmune-prone mouse strains: elevated interleukin (IL)-12 and an imbalance in tumor necrosis factor-alpha and IL-10 define a unique cytokine profile in macrophages from young nonobese diabetic mice. Diabetes. 2000;49:1106–15. doi: 10.2337/diabetes.49.7.1106. [DOI] [PubMed] [Google Scholar]
- 42.Ymer SI, Huang D, Penna G, Gregori S, Branson K, Adorini L, Morahan G. Polymorphisms in the Il12b gene affect structure and expression of IL-12 in NOD and other autoimmune-prone mouse strains. Genes Immunity. 2002;3:151–7. doi: 10.1038/sj.gene.6363849. [DOI] [PubMed] [Google Scholar]
- 43.Gillessen S, Carvajal D, Ling P, et al. Mouse interleukin-12 (IL-12) p40 homodimer: a potent IL-12 antagonist. Eur J Immunol. 1995;25:200–6. doi: 10.1002/eji.1830250133. [DOI] [PubMed] [Google Scholar]
- 44.Rothe H, O'Hara RM, Jr, Martin S, Kolb H. Suppression of cyclophosphamide induced diabetes development and pancreatic Th1 reactivity in NOD mice treated with the interleukin (IL)-12 antagonist IL-12 (p40)2. Diabetologia. 1997;40:641–6. doi: 10.1007/s001250050728. [DOI] [PubMed] [Google Scholar]
- 45.Trembleau S, Penna G, Gregori S, Gately MK, Adorini L. Deviation of pancreas-infiltrating cells to Th2 by interleukin-12 antagonist administration inhibits autoimmune diabetes. Eur J Immunol. 1997;27:2330–9. doi: 10.1002/eji.1830270930. [DOI] [PubMed] [Google Scholar]
- 46.Morahan G, Huang D, Ymer SI, et al. Linkage disequilibrium of a type 1 diabetes susceptibility locus with a regulatory IL12B allele. Nature General. 2001;27:218–21. doi: 10.1038/84872. [DOI] [PubMed] [Google Scholar]
- 47.Koarada S, Wu Y, Ridgway WM. Increased entry into the IFN-gamma effector pathway by CD4+ T cells selected by I-Ag7 on a nonobese diabetic versus C57BL/6 genetic background. J Immunol. 2001;167:1693–702. doi: 10.4049/jimmunol.167.3.1693. [DOI] [PubMed] [Google Scholar]
- 48.De Smedt T, Butz E, Smith J, Maldonado-Lopez R, Pajak B, Moser M, Maliszewski C. CD8α− and CD8α+ subclasses of dendritic cells undergo phenotypic and functional maturation in vitro and in vivo. J Leuk Biol. 2001;69:951–8. [PubMed] [Google Scholar]


