

Abstract
Wiskott–Aldrich syndrome (WAS) is an X-linked platelet/immunodeficiency disease. The affected gene encodes WASP, a multidomain protein that regulates cytoskeletal assembly in blood cells. Patients have recurring infections, and their lymphocytes exhibit deficient proliferative responses in vitro. We report an evaluation of peripheral blood lymphocytes of 27 WAS patients, aged one month to 55 years. Whereas NK cells were normal, a significant deficit of T and B lymphocytes was observed. The number of lymphocytes was already decreased in infant patients, suggesting deficient output. Both CD4 and CD8 T lymphocytes were affected; the decrease was most pronounced for naïve T cells. Naïve CD4 lymphocytes of patients showed normal expression of Bcl-2, and Ki-67, and normal survival in vitro, suggesting that their in vivo survival and proliferation are normal. The collective data suggest that the patients’ lymphocyte deficit results from deficient output, likely due to abnormal lymphocyte maturation in the thymus and bone marrow. We propose that WASP plays an important role not only in the function of mature T lymphocytes, but also in the maturation of human T and B lymphocytes and that impaired lymphocyte maturation is central to the aetiology of WAS immunodeficiency.
Keywords: immunodeficiency, T lymphocytes, naïve T-cells, B lymphocytes
Introduction
The Wiskott–Aldrich syndrome (WAS) is an X-linked immunodeficiency and platelet disease caused by mutations of the gene WASP (WAS protein). The disease, which was initially described by Wiskott in 1937 [1] and identified as X-linked by Aldrich et al. in 1954 [2], is characterized by thrombocytopenia with reduced platelet volume, eczema, susceptibility to bacterial and viral infections, autoimmunity, and malignancies especially B cell lymphoma. When examined in vitro, patient T cells show a reduced ability to produce IL-2 and to proliferate in response to TCR engagement [3].
The affected gene WASP encodes a multidomain protein specific to haematopoietic cells. WASP interacts with signalling and adaptor molecules (reviewed in [4]) and plays a critical role in cytoskeletal reorganization by integrating signalling events during T lymphocyte activation. Cytoskeletal defects in patient lymphocyte include a paucity of surface microvilli [5], defective actin polymerization in T cells and T cell lines [6,7], defective internalization of CD3 upon crosslinking of the T-cell receptor (TCR) [8], and a disarrayed F-actin cytoarchitecture documented in B cells [9].
Despite the well-known immunopathology of the disease, the composition of the patients’ lymphocyte compartment has not been well characterized. Studies of small numbers of patients found reduced T cell number [10] (reviewed in [11,12]), decreased percent CD4 cells [13], and increased percent of activated and memory T cells [14]. The current view, based on a longitudinal study of four patients is that lymphocyte number is normal in infancy and declines progressively after age 6 due to decrease of T cells [15].
The present study examined lymphocytes of 27 WAS patients, aged one month to 55 years in comparison to normal control individuals of the same age range. By including an age component in the analysis, the resulting data approximate the changes over time to the patients’ lymphocyte compartment. The findings demonstrate reduced numbers of T lymphocytes, especially naïve T cells, and also B lymphocytes with significant cell deficits present from infancy, suggesting that abnormal lymphocyte maturation is integral to the immunopathology of the WAS.
Materials and Methods
WAS patient and control subjects
Blood samples were collected from diagnosed WAS patients and control individuals under protocols approved by the Institutional Review Board of the Center for Blood Research (Boston, MA, USA) and the Institutional Review Board of the Research Institute for Paediatric Haematology (Moscow, Russia). Preliminary studies showed that comparable results were obtained for blood samples of the same donors analysed at both locations. The diagnosis of WAS was based on male sex, thrombocytopenia with small platelets, eczema, and immunodeficiency of variable severity; diagnosis was verified by identified WASP mutation [16] (M.I. Lutskiy et al. unpublished observation), and all patients met definitive international diagnostic criteria [17]. Based on the presence or absence of eczema, recurrent infections, autoimmune and malignant diseases in addition to thrombocytopenia, the patients’ disease was graded as mild, moderate or severe. If only thrombocytopenia and mild eczema were present the patient was considered mild. Patients with thrombocytopenia, severe eczema or frequent infections were graded as moderate. Patients with thrombocytopenia, severe eczema and severe frequent infections and/or autoimmune or malignant disease were classified as severe.
The normal control population included healthy adult donors, primarily males in their third, or less frequently, fourth or fifth decade. Pediatric control blood samples consisted of ‘discarded materials’, i.e. portions of blood samples from normal boys remaining on completion of clinical phenotyping studies at the Institute for Paediatric Haematology, Moscow or diagnostic testing at the Center for Blood Research. Criteria for normal samples included absence of known or suspected immune disease; criteria for all samples included absence of obvious current infection.
Antibodies
Mouse monoclonal antibodies (MoAb), fluorescein isothiocyanate- (FITC-) conjugated anti-CD3 (UCHT1), CD45RA (ALB11) and CD62L (DREG56); phycoerythrin (PE)-conjugated anti-CD4 (13B8·2), CD16 (3G8), CD19 (J4·119), CD27 (M-T271), CD28 (CD28·2) and CD56 (N901), and phycocyanin (PC5)-conjugated anti CD4 (13B8·2), CD8 (B9·11), CD19 (J4·119), CD45 (J33) and isotype controls were from Beckman Coulter (Brea, CA). Unconjugated 2H4 MoAb to CCR7 from BD Biosciences (San Diego, CA, USA) was used in conjunction with PE- conjugated goat F(ab′)2 antimouse IgM (Caltag). PE-conjugated MoAb to Ki-67 and Bcl-2 and isotype controls were from BD Biosciences. CD45RO (UCHL-1) for negative selection of naïve CD4 cells was from DAKO (Carpinteria, CA, USA).
Sample preparation and flow cytometric analysis
Whole blood for patient and normal individuals was collected in acid-citrate-dextrose (NIH formula A) and processed immediately or after overnight shipment at ambient temperature. Blood cell subpopulations were quantified by differential analysis of anticoagulated whole blood using the Max-M (Coulter Corp, Hialeah, FL, USA). Leucocytes were stained with three-colour antibody combinations by incubating 100 µl of whole blood for 15 min with saturating concentrations (determined in preliminary experiments) of FITC-, PE- and PC5-MoAb. All steps were done at room temperature. To lyse erythrocytes, 900 µl of FACS™ Lysing Solution (BD Pharmingen) was added, and the mixture was vortexed gently and incubated for 15 min in the dark. The cells were diluted to 4 ml with phosphate-buffered saline with 1% fetal calf serum (PBS-FCS), pelleted, and washed once. The stained cells were suspended in 1·2% formaldehyde in PBS, stored at 4°C and analysed within 24 h. Following incubation of blood samples with CCR7 (unconjugated) MoAb, the samples were diluted to 4 ml with PBS-FCS, pelleted, resuspended in 100 µl PBS-FCS and incubated for 15 min with goat F(ab′)2 antimouse IgM. FACS™ Lysing Solution was added and the cells were further processed as described above. For intracellular Ki-67 and Bcl-2 staining, the cells were surface stained, treated with FACS™ Lysing Solution, washed and then permeabilized with FACS™ Cytofix/Cytoperm solution™ (BD Pharmingen) as per manufacturer's instructions prior to intracellular staining.
Stained cells were analysed using FACSCalibur and CellQuest software (Becton Dickinson, San Jose, CA, USA). The acquired data were analysed by gating on lymphocytes on a forward versus side scatter dot plot. To quantify T cells, B cells and NK cells, the lymphocyte gate was combined with a second gate around the CD45+ population based on FL3 versus forward scatter. For the determination of subsets within T and B cells, the lymphocyte gate was combined with a second gate around the CD4+ or CD8bright or CD19+ population. A minimum of 10 000 lymphocyte events was acquired. Differential values were used to calculate absolute cell concentrations. Results are expressed either as absolute cell concentration (cell number) or percent of lymphocytes positive for each marker. Data are reported as mean ± SEM. For Bcl-2 expression, mean fluorescence intensity (MFI) values are shown after subtraction of isotype control values.
Preliminary experiments verified that comparable results were obtained when aliquots of stained cells were analysed on different FACS-Calibur instruments. Comparable results were also obtained for blood samples processed after overnight storage compared to parallel aliquots processed immediately after blood drawing. Blood samples were drawn on more than one occasion for the same normal blood donors (n = 4) and patients (n = 3), and no significant differences were noted for the replicate analyses.
Culture of naïve CD4 cells
Peripheral blood mononuclear cells (PBMC) were isolated by centrifugation on Histopaque 1077 (Sigma, St Louis, MO, USA) as described [16] and depleted of CD8+, CD19+, CD45RO+, CD16+, CD56+, CD14+ by negative selection (Dynal, Lake Success, NY). The isolated CD4 naïve cells (0·5 × 106/ml) were cultured in RPMI 1640 (with 10% FCS, penicillin, and streptomycin). After 3 days, a fixed number of polystyrene microbeads (Spherotech, Libertyville, IL, USA) was added and the cells were harvested and analysed by flow cytometry. Beads and cell events were distinguished based on side and forward light scatter, and the number of cells was calculated from the ratio of cells to beads [18].
Statistical analyses
Results are plotted as a function of age. Different linear scales of increasing compression are used in presenting data for the sequential age ranges: infants (0–2 years), children (2–16 years) and adults (16–55 years). Regression lines were plotted using SigmaPlot® (SPSS Inc, Chicago, IL, USA) with four parameter logistic curve fitting in most cases, y = min + (max-min)/(1 + 10 (logEC50 –x) hillslope). In some cases, linear curves were used. Statistical comparisons were made within the age categories where the dependence of cell number on age is not so strong, i.e. within the infant category and within the adult category using unpaired two-tailed student t-test. Data are reported as mean ± SEM. P-values < 0·05 were considered significantly different. Statistical comparisons were not made for the age range 2–16 years where the number of cells is highly age-dependent.
Results
Early lymphocyte reduction in WAS patients
Because WAS is primarily a paediatric disease [10, 11, 15, 19, 20] and lymphocyte numbers change substantially during normal childhood [21,22], data for patients (described in Table 1) and normal individuals were compared within the context of donor age. In the normal group, lymphocyte number was high in infants, declined during childhood and adolescence (2–16 years) and became approximately level in adults (Fig. 1a, open symbols). For the WAS patients, lymphocyte number was decreased relative to normal individuals (Fig. 1A, closed symbols). Contrary to the current view of this disease, the deficit of lymphocytes was most pronounced for the youngest patients, 3·66 ± 0·32 × 106 lymphocytes/ml (mean ± S.E.M) for 9 WAS infants (0–2 years) compared to 5·68 ± 0·38 × 106/ml for 14 normal infants (P < 0·01).
Table 1.
Clinical characteristics of patients
| Patient no. | Age (years†) | Disease severity | Splenectomy | IVG* |
|---|---|---|---|---|
| Infants | ||||
| 1 | 1 m | Severe | No | No |
| 2 | 2 m | Severe | No | No |
| 3 | 3 m | Severe | Yes | Yes |
| 4 | 5 m | Mild | No | No |
| 5 | 6 m | Severe | No | No |
| 6 | 12 m | Severe | No | No |
| 7 | 18 m | Severe | No | No |
| 8 | 22 m | Mild | No | No |
| 9 | 24 m | Mild | No | Yes |
| Children | ||||
| 10 | 25 m | Severe | No | Yes |
| 11 | 4 | Severe | No | No |
| 12 | 6 | Mild | No | No |
| 13 | 7 | Mild | Yes | No |
| 14 | 8 | Mild | No | No |
| 15 | 12 | Moderate | No | Yes |
| 16 | 12 | Severe | Yes | Yes |
| 17 | 13 | Severe | Yes | n/d |
| 18 | 13 | Moderate | No | Yes |
| 19 | 14 | Mild | Yes | Yes |
| 20 | 15 | Moderate | Yes | No |
| Adults | ||||
| 21 | 16 | Moderate | Yes | Yes |
| 22 | 22 | Moderate | Yes | Yes |
| 23 | 24 | Moderate | Yes | Yes |
| 24 | 42 | Mild | Yes | No |
| 25 | 50 | Severe | Yes | Yes |
| 26 | 51 | Mild | Yes | No |
| 27 | 54 | Mild | Yes | No |
years except where other units shown; m, months.
IVG intravenous gammaglobulin therapy. n/d, not determined.
Fig. 1.
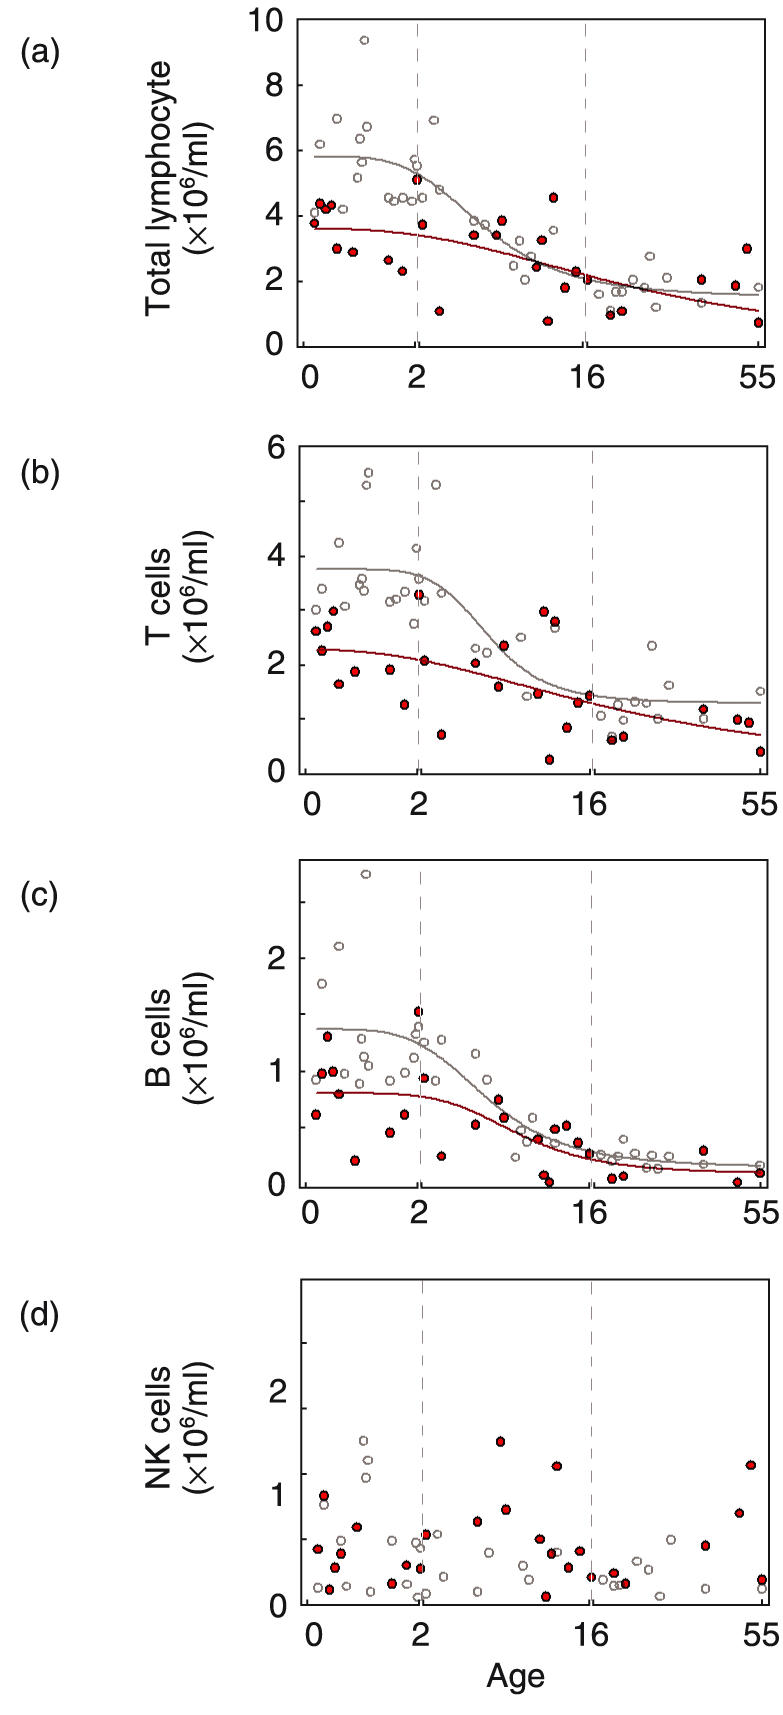
Quantification of total lymphocytes and lymphocyte subpopulations in peripheral blood of normal individuals and WAS patients. Shown are absolute cell numbers (×106/ml) for normal individuals (^) and WAS patients ( ). Patient age is shown on the abscissa. Note that different linear scales of increasing compression were used for infants (0–2 years), children (2–16 years) and adults (16–55 years). (a) total lymphocytes (b) T lymphocytes (CD45+CD3+) (c) B lymphocytes (CD45+CD19+) (d) NK cells (CD45+CD3–CD16+CD56+).
Selective decrease of T and B lymphocytes
Analysis of subpopulations revealed a selective reduction in patients of both T and B lymphocytes. The pattern for T lymphocytes (CD45+CD3+) largely mirrored that of total lymphocytes except that the differences between patient and normal were more pronounced (Fig. 1b). The T lymphocyte number for WAS infants, 2·28 ± 0·22 × 106/ml, represents a 39% decrease relative to normal infants, 3·73 ± 0·21 × 106/ml (P < 0·01). T lymphocyte number was also decreased for adult patients, 0·80 ± 0·12 × 106/ml compared to 1·28 ± 0·14 × 106/ml for normal adults (P < 0·05).
The B lymphocyte (CD45+CD19+) number for infant patients, 0·83 ± 0·14 × 106/ml represents a 38% decrease relative to normal infants, 1·34 ± 0·15 × 106/ml (P < 0·05) (Fig. 1c). B cell number for adult patients, 0·13 ± 0·05 × 106/ml was not significantly different from normal adults, 0·22 ± 0·02 × 106/ml.
The number of natural killer lymphocytes (NK cells) (CD3–CD56+CD16+) was variable in both normal individuals and WAS patients. In contrast to the findings for T and B lymphocytes, the number of NK cells was not statistically different for the two groups (0·59 ± 0·07 × 106/ml versus 0·42 ± 0·07 × 106/ml for patients and normals, respectively, NS)(Fig. 1d).
Reduced naïve but normal memory CD4 lymphocytes
For CD4 cells, modest but significant reductions were found for both infant and adult patients (Fig. 2a). The number was 1·81 ± 0·16 × 106/ml for WAS infants compared to 2·50 ± 0·20 × 106/ml for normal infants (P < 0·05) (28% decrease) and 0·51 ± 0·08 × 106/ml for adult patients compared to 0·84 ± 0·08 × 106/ml for normal adults (P < 0·05).
Fig. 2.
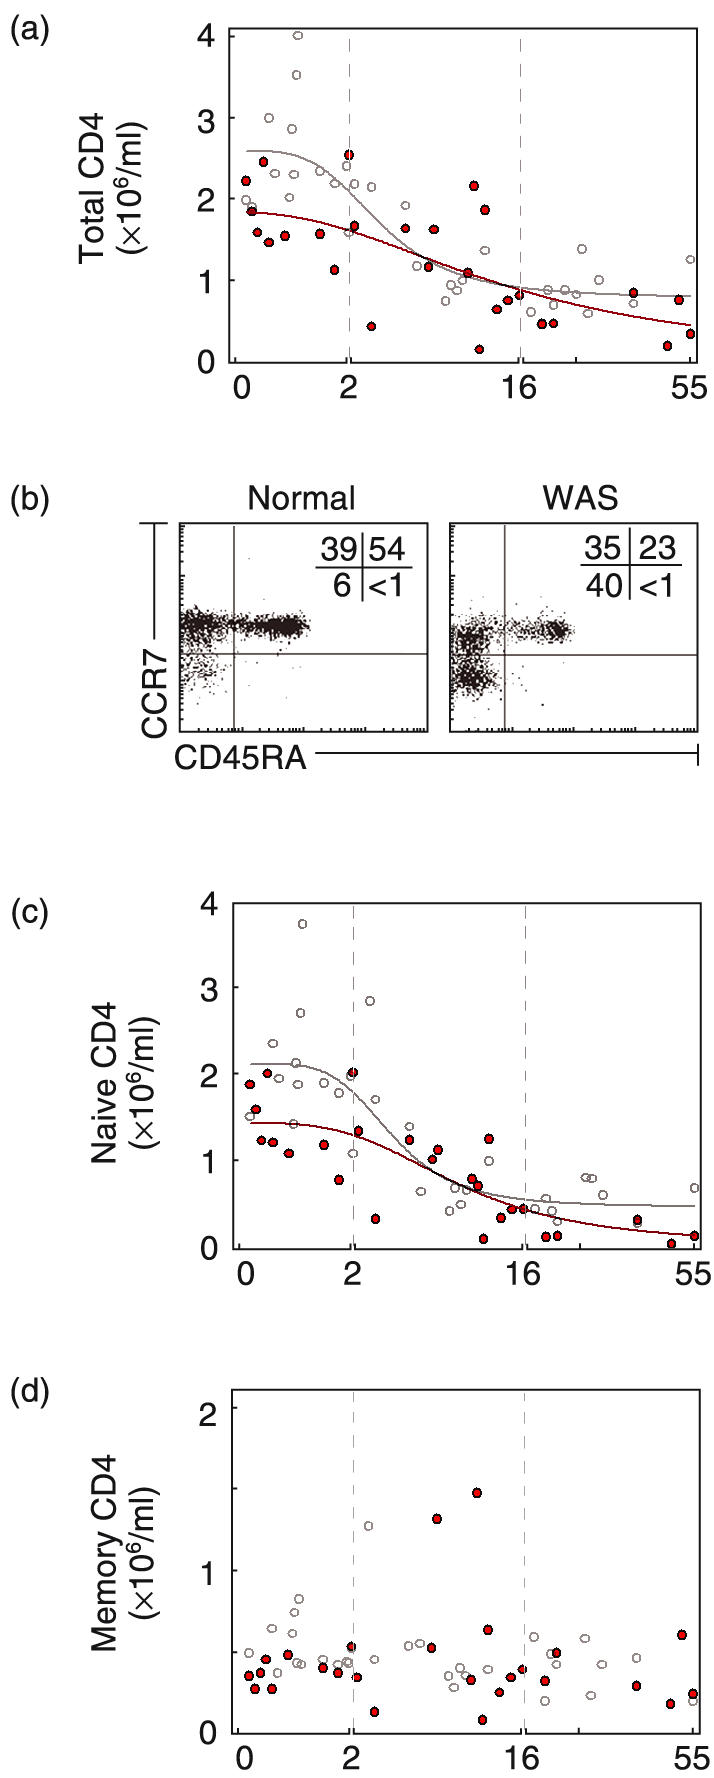
Quantification of CD4 lymphocytes in blood of normal individuals and WAS patients. (a) Number (×106/ml) of CD4 cells (CD3+CD4+) of normal individuals (^) and WAS patients ( ). (b) Dot plot of CD45RA and CCR7 expression for a normal adult and an adult patient. Shown are naïve (CD45RA+), central memory (CD45RA–CCR7+) and effector memory (CD45RA–CCR7–) CD4 cells (c) Number of naïve CD4 cells (CD45RA+). (d) Number of CD4 memory cells (CD45RA–).
CD4 cells were further characterized for CD45RA and CCR7 to distinguish naïve, central memory, and effector memory cells [23] (example in Fig. 2b). The subset analysis showed that decrease of patient CD4 cells largely reflects a decrease of the naïve subset (CD45RA+). Infant patients had 1·42 ± 0·15 × 106/ml compared to 2·02 ± 0·20 × 106/ml for normal infants (P < 0·05). The decrease of naïve CD4 cells was very large for adult patients; the number, 0·17 ± 0·05 × 106/ml, represents a 61% decrease relative to normal adults (0·44 ± 0·05 × 106/ml)(P < 0·01) (Fig. 2c). Memory CD4 cells CD45RA– (CCR7+ and CCR7–) were modestly reduced in infant patients (0·39 ± 0·03 × 106/ml versus 0·53 ± 0·04 × 106/ml for normals P < 0·05) and, in contrast, were present in normal numbers in adult patients, 0·36 ± 0·06 × 106/ml for patients versus 0·40 ± 0·04 × 106/ml for normal adults (NS) (Fig. 2d).
For adult patients, the decreased naïve cell number and normal memory cell number is reflected as increased percent of memory CD4 cells. We noted also a skewed distribution, specifically a relative increase of CD4 effector memory cells (CD45RA–CCR7–) over central memory (CD45RA–CCR7+) (Fig. 2b and supplemental Fig. A (please see the section Supplementary material below). The percent of CD4 cells with additional markers of effector memory phenotype, CD62L–, CD27– and CD28– was also increased in adult patients (data not shown).
Severe depletion of CD8 lymphocytes
The size of the patient CD8 compartment was reduced in infants and children, 0·41 ± 0·09 × 106/ml for WAS infants versus 1·12 ± 0·09 × 106/ml for normal infants (P < 0·01)(Fig. 3a). Subset analysis showed that the reduced number was due entirely to a decrease of naïve CD8 cells (CD45RA+CCR7+) (Fig. 3b). The number of naïve CD8 cells was 0·16 ± 0·03 × 106/ml for infant patients and 0·80 ± 0·10 × 106/ml for normal infants (P < 0·01) (80% decrease). Adult naïve CD8 cell number was 0·02 ± 0·01 × 106/ml for patients and 0·26 ± 0·04 × 106/ml for normal individuals (P < 0·01) (92% decrease). The number of memory CD8 cells was not different for patients and normals (Fig. 3c).
Fig. 3.
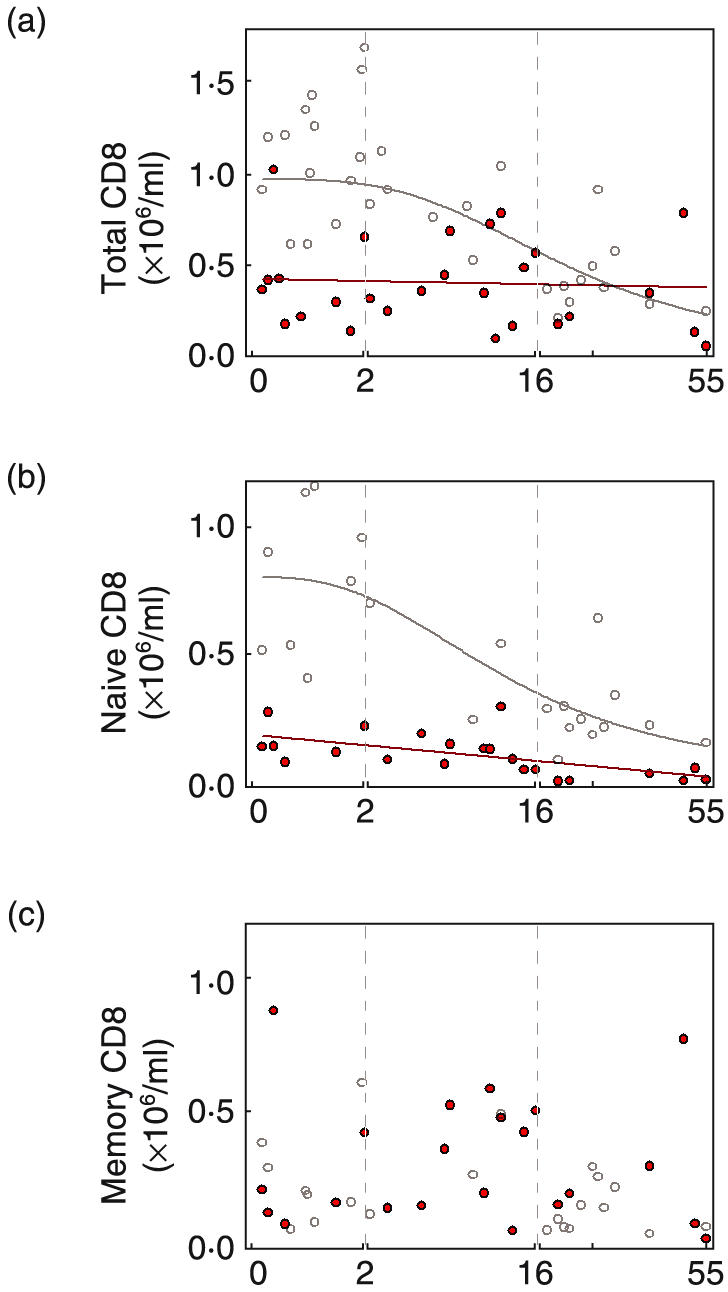
Quantification of CD8 lymphocytes in blood of normal individuals and WAS patients. Shown are cell numbers (×106/ml) of (a) CD8 cells (CD3+CD8+) (b) naïve CD8 cells (CD8brightCD45RA+CCR7+) and (c) memory CD8 cells (CD45RA–, and CD45RA+CCR7–) of normal individuals (^) and WAS patients ( ).
).
The reduced naïve cell number and normal memory cell number was reflected in an increased percent of patient memory CD8 cells (supplemental Fig. B (please see the section Supplementary material below)). The breakdown of the patient memory CD8 cell population differed from normal because the relative increase was due to effector memory (CD45RA–CCR7–) and terminally differentiated (CD45RA+CCR7–) cells rather than central memory (supplemental Fig. B).
Characterization of patient naïve CD4 cells
To characterize possible mechanisms leading to reduction of patient naïve T cells, we examined the expression of Bcl-2, an antiapoptotic factor important in lymphocyte survival [24]. When CD4 cells of patient and normal blood samples were stained intracellularly, the expression level of Bcl-2 was indeed decreased in patient CD4 cells (Fig. 4a,b, left), which confirms a previous report [25]. However, no difference was found in Bcl-2 levels of patient naïve CD4 cells compared to normal naïve CD4 cells. Mean fluorescence intensity (MFI) was 173 ± 32 and 174 ± 42 for patient and normal, respectively (Fig. 4a,b, middle), indicating that Bcl-2 levels are not decreased in patient naïve CD4 cells. The overall Bcl-2 attenuation was found to reflect decreased Bcl-2 levels in patient memory CD4 cells compared to normal memory CD4 cells (Fig. 4a,b, right). We also directly examined survival capacity of naïve CD4 T cells. These cells (CD4+CD45RA+) were isolated by negative selection and cultured in the absence of exogenous agents. The number of surviving cells quantified after 3 days was not different for patients, 155 ± 34 cells/µl compared to 161 ± 25 cells/µl for normal individuals (n = 4 paired experiments) (Fig. 4c).
Fig. 4.

Bcl-2 expression, Ki-67 expression, and survival of subsets of normal and patient T cells. (a,b) Bcl-2 expression of naïve and memory CD4 cells. Cells labelled with marker antibodies were stained intracellularly for Bcl-2. (a) Histograms of total, naïve (CD45RA+) and memory (CD45RA–) CD4 cells of a normal individual ( ) and a WAS patient (
 ). (b) Mean fluorescence intensity of Bcl-2 staining ± SEM for 4 normal individuals and 3 WAS patients. (c) Survival in vitro of isolated naïve CD4 cells. CD4 cells (CD4+CD45RA+) isolated by negative selection were cultured for 3 days without exogenous agent, and the number of surviving cells was determined by flow cytometry. Shown are mean data for cells of normal individuals (
 ) and WAS patients (
 ). (n = 4). (d) Ki-67 expression of naïve and memory CD4 cells. Cells labelled with marker antibodies were stained intracellularly for Ki-67, and the percent positive cells for normal individuals (^) and WAS patients (
 ) was quantified by flow cytometry. The bars represent mean values.
Next, we examined whether the reduction of CD4 naïve cells might result from an altered proliferation rate. Patient cells were stained for Ki-67, a nuclear antigen expressed throughout all phases of the cell cycle except G0[26]. Among patient naïve CD4 cells, the percent positive for Ki-67, 0·39 ± 0·09%, was not significantly different from normal, 0·23 ± 0·05% (NS) (Fig. 4d, left), suggesting that the deficit of CD4 naive cells did not result from an altered proliferation rate. Among patient memory CD4 cells, Ki-67 expressing cells were at increased frequency, 3·13 ± 0·44%, compared to normal memory CD4 cells, 1·22 ± 0·12% (P < 0·01) (Fig. 4d, right), possibly due to the patients’ higher percent of effector memory cells (Discussion). Taken together, normal survival capacity and normal proliferation of patient CD4 naïve cells strongly suggest that defective output of CD4 cells is the cause of the observed reduction of patient CD4 naïve cells.
Discussion
The evaluation of blood samples of 27 patients provided detailed and in some cases surprising data that quantify and characterize the peripheral blood lymphocyte compartment of WAS patients of various ages. The data are highly informative in revealing a significant decrease of T and B lymphocytes. This decrease is selective since NK cells are present in normal number. The cell deficit was most pronounced for infant patients. The decreased number of T cells largely reflects a decrease of naïve cells. For patient naïve CD4 cells, expression of Bcl-2, survival in vitro, and Ki-67 expression were all found to be normal, suggesting that enhanced cell death and altered proliferation are not significant contributors to the cell deficit.
The present study provides substantial documentation that T and B lymphocyte number is low in WAS patients from early age, likely from birth. This decrease, although it is consistent with the early onset of recurrent infections in many patients [27], was initially surprising since an earlier study had concluded that lymphocyte loss begins after age six [15]. In the earlier study, longitudinal data from 4 patients were compared to literature values for the normal range. The present cross-sectional findings are based on comparing data for 9 WAS infants to data for 11 normal infants studied under the same conditions. Importantly, the high variance of lymphocyte number in the normal infants can make quantitative differences unapparent at the level of an individual patient. In such a setting, the detection of differences that are of substantial but not overwhelming magnitude requires that populations be compared. Documentation of such quantitative differences, although not of a diagnostic value, can, as in the present case, be of a primary significance for understanding the aetiology of the disease.
The findings that the T and B lymphocyte deficit is most pronounced in the youngest patient group and that the deficit of T lymphocytes preferentially affects naïve cells strongly suggest that the underlying mechanism is deficient output. Deficient output is consistent with histomorphological findings of decreased lymphocyte cellularity in the thymus of two WAS infants [10] and thymic involution in two additional patients [11]. WASP, which is absent or defective in the patients’ cells, plays a key role in antigen receptor mediated activation of mature lymphocytes [3] and may be needed also at an earlier stage of lymphocyte development. For example, the absence of WASP in thymocytes may reduce the overall strength of signals delivered via the antigen receptor complex during positive or negative selection, leading to reduced output of mature T lymphocytes. The postulated involvement of WASP in antigen receptor mediated maturation events is consistent with the selective deficit of T and B lymphocytes and normal number of NK cells. Indeed, defective maturation of thymocytes and decreased numbers of peripheral lymphocytes have been found in a murine model of WASP deletion [28]. Also, mice deficient in other TCR signalling molecules, Lck [29], ZAP-70 [30] and Vav [31], exhibit severely perturbed thymocyte maturation and a deficit of peripheral T lymphocytes.
Previous studies reported attenuated levels of Bcl-2 and accelerated apoptosis of WAS patient lymphocytes [25,32]. Our findings also show attenuated Bcl-2 levels in patient CD4 cells; however, we do not think that enhanced cell death is a significant contributor to the lymphocyte deficit reported here. Subset analysis for patient CD4 cells showed that the deficit was most pronounced for the naïve subpopulation, but the Bcl-2 decrease was entirely a feature of the memory cells. In addition, when isolated naïve CD4 cells were cultured without exogenous agent, cell survival was nearly identical for WAS and normal cells. Since Ki-67 expression of CD4 naïve cells was low and not different between patients and normal controls, these findings fail to support enhanced cell death or altered proliferation as significant contributors to the deficit of patient naive CD4 cells.
The goal of the present study was to characterize cellular phenotype for the disease as a whole in relation to normal cellular phenotype. The comparison of the subcategories, i.e. severe WAS versus mild WAS, would require a larger number of patients within each subcategory (age plus clinical phenotype). Disease severity and cellular phenotype could not be correlated in this study. For example, B cell counts were not statistically different for WAS infants with mild versus severe phenotype (t-test, P = 0.36), although a difference might be found with sufficient sample size. Future establishment of longitudinal databases will allow cohorts of patients to be followed world-wide, providing data to confirm the current findings and to enable analysis by disease severity.
In summary, the findings document an early and selective deficit of naïve T and B lymphocytes in peripheral blood of WAS patients including the youngest patients. The composite data redefine the cell phenotype in the WAS, which can no longer be considered as the progressive loss of T lymphocytes, but rather as a ‘from infancy’ decreased number of both T and B lymphocytes. The data reflect the disease as it presents in a contemporary medical setting; patient selection was random (all patient samples received over 3 years) and includes diverse mutations and clinical phenotypes. Although further studies are needed, the composite data strongly suggest that the patients’ decreased cell numbers are due to deficient output, possibly resulting from impaired lymphocyte maturation. Deficient output of T and B lymphocytes, although not previously suspected, is consistent with the clinical phenotype of the disease and is likely important in the aetiology of the immunodeficiency. The findings suggest ‘enhancement of lymphocyte output’ as a potential clinical target for future therapeutic interventions.
Acknowledgments
This work was supported by grants HL59561 and AI39574 from the National Institutes of Health and the Jeffrey Modell Foundation. We thank F. Morgan Smyrl and Tatiana Radigina for flow cytometry measurements, Dr Dianne Kenney for encouragement in initiating the study, Dr Premlata Shankar for suggestions, and Drs Maxim Lutskiy, Charaf Benarafa, Premlata Shankar and Heinz Remold for critical manuscript review. We are grateful to the patients and families and control blood donors for their cooperation.
Supplementary Material
The following Supplementary Material is available from: http://www.blackwellpublishing.com/products/journals/suppmat/CEI/CEI2409/CEI2409sm.htm
Subsets of CD4 cells (expressed as percentage of total CD4 cells) in normal individuals and WAS patients. Shown are naïve (CD45RA+) (top panels), the central memory (CD45RA–CCR7+) (middle panels) and effector memory (CD45RA–CCR7–) cells (bottom panels). Comparable results were obtained when naïve cells were defined as CD45RA+CCR7+ (not shown). Note that the scale for older children (2–16 years) is compressed relative to the scale for infants (0–2 year); both are linear. Data for adults (16–50 years) are shown as cluster dot plots without reference to age. In adults, the patient CD4 cells showed a significant (P < 0·01) reduction in the percent of CD45RA+ naïve CD4 cells and a reciprocal increase of the percent of CD45RA–CCR7– effector memory cells (P < 0·01).
Subsets of CD8 cells (expressed as percent of total CD8 cells) in normal individuals and WAS patients. Shown, from the top, are the naïve (CD45RA+CCR7+), central memory (CD45RA–CCR7+), effector memory (CD45RA–CCR7–) and terminally differentiated effectors (CD45RA+CCR7–). The 3-part age scale (abscissa) for infants, children and adults is the same as in Fig. A. The percentage of patient naïve (CD45RA+CCR7+) CD8 cells are significantly reduced in infancy (P < 0·01) and also significantly reduced in adult patients (P < 0·01). As noted for CD4 cells, in adult patients significant percent increase in effector memory CD8 cells is observed (P < 0·05).
Cell counts of lymphocytes and subsets.
References
- 1.Wiskott A. Familiarer, angeobren Morbus Werlhofi? Monatschrift Kinderheil. 1937;68:212–6. [Google Scholar]
- 2.Aldrich R, Steinberg A, Campbell D. Pedigree demonstrating a sex-linked recessive condition characterized by draining ears, eczematoid dermatitis and blood diarrhea. Pediatrics. 1954;13:133–8. [PubMed] [Google Scholar]
- 3.Molina IJ, Sancho J, Terhorst C, Rosen FS, Remold-O’Donnell E. T cells of patients with the Wiskott–Aldrich syndrome have a restricted defect in proliferative responses. J Immunol. 1993;151:4383–90. [PubMed] [Google Scholar]
- 4.Thrasher AJ. WASp in immune-system organization and function. Nat Rev Immunol. 2002;2:635–46. doi: 10.1038/nri884. [DOI] [PubMed] [Google Scholar]
- 5.Kenney D, Cairns L, Remold-O’Donnell E, Peterson J, Rosen FS, Parkman R. Morphological abnormalities in the lymphocytes of patients with the Wiskott–Aldrich syndrome. Blood. 1986;68:1329–32. [PubMed] [Google Scholar]
- 6.Dupre L, Aiuti A, Trifari S, Martino S, Saracco P, Bordignon C, Roncarolo MG. Wiskott–Aldrich syndrome protein regulates lipid raft dynamics during immunological synapse formation. Immunity. 2002;17:157–66. doi: 10.1016/s1074-7613(02)00360-6. [DOI] [PubMed] [Google Scholar]
- 7.Gallego MD, Santamaria M, Pena J, Molina IJ. Defective actin reorganization and polymerization of Wiskott-Aldrich T cells in response to CD3-mediated stimulation. Blood. 1997;90:3089–97. [PubMed] [Google Scholar]
- 8.Wada T, Schurman SH, Otsu M, Garabedian EK, Ochs HD, Nelson DL, Candotti F. Somatic mosaicism in Wiskott–Aldrich syndrome suggests in vivo reversion by a DNA slippage mechanism. Proc Natl Acad Sci USA. 2001;98:8697–702. doi: 10.1073/pnas.151260498. [DOI] [PMC free article] [PubMed] [Google Scholar]
- 9.Facchetti F, Blanzuoli L, Vermi W, Notarangelo LD, Giliani S, Fiorini M, Fasth A, Stewart DM, Nelson DL. Defective actin polymerization in EBV-transformed B-cell lines from patients with the Wiskott–Aldrich syndrome. J Pathol. 1998;185:99–107. doi: 10.1002/(SICI)1096-9896(199805)185:1<99::AID-PATH48>3.0.CO;2-L. [DOI] [PubMed] [Google Scholar]
- 10.Wolff JA. Wiskott–Aldrich syndrome: clinical, immunologic, and pathologic observations. J Pediatr. 1967;70:221–32. doi: 10.1016/s0022-3476(67)80417-7. [DOI] [PubMed] [Google Scholar]
- 11.Cooper MD, Chae HP, Lowman JT, Krivit W, Good RA. Wiskott–Aldrich syndrome. An immunologic deficiency disease involving the afferent limb of immunity. Am J Med. 1968;44:499–513. doi: 10.1016/0002-9343(68)90051-x. [DOI] [PubMed] [Google Scholar]
- 12.Sullivan KE, Mullen CA, Blaese RM, Winkelstein JA. A multiinstitutional survey of the Wiskott–Aldrich syndrome. J Pediatr. 1994;125:876–85. doi: 10.1016/s0022-3476(05)82002-5. [DOI] [PubMed] [Google Scholar]
- 13.Morio T, Takase K, Okawa H, et al. The increase of non-MHC-restricted cytotoxic cells (gamma/delta-TCR-bearing T cells or NK cells) and the abnormal differentiation of B cells in Wiskott–Aldrich syndrome. Clin Immunol Immunopathol. 1989;52:279–90. doi: 10.1016/0090-1229(89)90179-7. [DOI] [PubMed] [Google Scholar]
- 14.Gerwin N, Friedrich C, Perez-Atayde A, Rosen FS, Gutierrez-Ramos JC. Multiple antigens are altered on T and B lymphocytes from peripheral blood and spleen of patients with Wiskott–Aldrich syndrome. Clin Exp Immunol. 1996;106:208–17. doi: 10.1046/j.1365-2249.1996.d01-853.x. [DOI] [PMC free article] [PubMed] [Google Scholar]
- 15.Ochs HD, Slichter SJ, Harker LA, Von Behrens WE, Clark RA, Wedgwood RJ. The Wiskott–Aldrich syndrome. studies of lymphocytes, granulocytes, and platelets. Blood. 1980;55:243–52. [PubMed] [Google Scholar]
- 16.Shcherbina A, Rosen FS, Remold-O’Donnell E. WASP levels in platelets and lymphocytes of Wiskott–Aldrich syndrome patients correlate with cell dysfunction. J Immunol. 1999;163:6314–20. [PubMed] [Google Scholar]
- 17.Conley ME, Notarangelo LD, Etzioni A. Diagnostic criteria for primary immunodeficiencies. Representing PAGID (Pan-American Group for Immunodeficiency) and ESID (European Society for Immunodeficiencies) Clin Immunol. 1999;93:190–7. doi: 10.1006/clim.1999.4799. [DOI] [PubMed] [Google Scholar]
- 18.Deenick EK, Hasbold J, Hodgkin PD. Switching to IgG3, IgG2b, and IgA is division linked and independent, revealing a stochastic framework for describing differentiation. J Immunol. 1999;163:4707–14. [PubMed] [Google Scholar]
- 19.Perry III GS, Spector BD, Schuman LM, et al. The Wiskott–Aldrich syndrome in the United States and Canada (1892–1979) J Pediatr. 1980;97:72–8. doi: 10.1016/s0022-3476(80)80133-8. [DOI] [PubMed] [Google Scholar]
- 20.Krivit W, Good RA. Aldrich's Syndrome (Thrombocytopenia, Eczema, and Infection in Infants) Am Med Assoc J Dis Children. 1959;97:133–53. doi: 10.1001/archpedi.1959.02070010139001. [DOI] [PubMed] [Google Scholar]
- 21.Comans-Bitter WM, de Groot R, van den Beemd R, Neijens HJ, Hop WC, Groeneveld K, Hooijkaas H, van Dongen JJ. Immunophenotyping of blood lymphocytes in childhood. Reference values for lymphocyte subpopulations. J Pediatr. 1997;130:388–93. doi: 10.1016/s0022-3476(97)70200-2. [DOI] [PubMed] [Google Scholar]
- 22.Bonilla FA, Oettgen HC. Normal ranges for lymphocyte subsets in children. J Pediatr. 1997;130:347–9. [PubMed] [Google Scholar]
- 23.Sallusto F, Lenig D, Forster R, Lipp M, Lanzavecchia A. Two subsets of memory T lymphocytes with distinct homing potentials and effector functions. Nature. 1999;401:708–12. doi: 10.1038/44385. [DOI] [PubMed] [Google Scholar]
- 24.Cory S. Regulation of lymphocyte survival by the bcl-2 gene family. Annu Rev Immunol. 1995;13:513–43. doi: 10.1146/annurev.iy.13.040195.002501. [DOI] [PubMed] [Google Scholar]
- 25.Rawlings SL, Crooks GM, Bockstoce D, Barsky LW, Parkman R, Weinberg KI. Spontaneous apoptosis in lymphocytes from patients with Wiskott–Aldrich syndrome: correlation of accelerated cell death and attenuated bcl-2 expression. Blood. 1999;94:3872–82. [PubMed] [Google Scholar]
- 26.Gerdes J, Lemke H, Baisch H, Wacker HH, Schwab U, Stein H. Cell cycle analysis of a cell proliferation-associated human nuclear antigen defined by the monoclonal antibody Ki-67. J Immunol. 1984;133:1710–5. [PubMed] [Google Scholar]
- 27.Ochs HD. The Wiskott–Aldrich syndrome. Semin Hematol. 1998;35:332–45. [PubMed] [Google Scholar]
- 28.Zhang J, Shehabeldin A, da Cruz LA, et al. Antigen receptor-induced activation and cytoskeletal rearrangement are impaired in Wiskott–Aldrich syndrome protein × deficient lymphocytes. J Exp Med. 1999;190:1329–42. doi: 10.1084/jem.190.9.1329. [DOI] [PMC free article] [PubMed] [Google Scholar]
- 29.Molina TJ, Kishihara K, Siderovski DP, et al. Profound block in thymocyte development in mice lacking p56lck. Nature. 1992;357:161–4. doi: 10.1038/357161a0. [DOI] [PubMed] [Google Scholar]
- 30.Negishi I, Motoyama N, Nakayama K, Senju S, Hatakeyama S, Zhang Q, Chan AC, Loh DY. Essential role for ZAP-70 in both positive and negative selection of thymocytes. Nature. 1995;376:435–8. doi: 10.1038/376435a0. [DOI] [PubMed] [Google Scholar]
- 31.Turner M, Mee PJ, Walters AE, Quinn ME, Mellor AL, Zamoyska R, Tybulewicz VL. A requirement for the Rho-family GTP exchange factor Vav in positive and negative selection of thymocytes. Immunity. 1997;7:451–60. doi: 10.1016/s1074-7613(00)80367-2. [DOI] [PubMed] [Google Scholar]
- 32.Rengan R, Ochs HD, Sweet LI, Keil ML, Gunning WT, Lachant NA, Boxer LA, Omann GM. Actin cytoskeletal function is spared, but apoptosis is increased, in WAS patient hematopoietic cells. Blood. 2000;95:1283–92. [PubMed] [Google Scholar]
Associated Data
This section collects any data citations, data availability statements, or supplementary materials included in this article.
Supplementary Materials
Subsets of CD4 cells (expressed as percentage of total CD4 cells) in normal individuals and WAS patients. Shown are naïve (CD45RA+) (top panels), the central memory (CD45RA–CCR7+) (middle panels) and effector memory (CD45RA–CCR7–) cells (bottom panels). Comparable results were obtained when naïve cells were defined as CD45RA+CCR7+ (not shown). Note that the scale for older children (2–16 years) is compressed relative to the scale for infants (0–2 year); both are linear. Data for adults (16–50 years) are shown as cluster dot plots without reference to age. In adults, the patient CD4 cells showed a significant (P < 0·01) reduction in the percent of CD45RA+ naïve CD4 cells and a reciprocal increase of the percent of CD45RA–CCR7– effector memory cells (P < 0·01).
Subsets of CD8 cells (expressed as percent of total CD8 cells) in normal individuals and WAS patients. Shown, from the top, are the naïve (CD45RA+CCR7+), central memory (CD45RA–CCR7+), effector memory (CD45RA–CCR7–) and terminally differentiated effectors (CD45RA+CCR7–). The 3-part age scale (abscissa) for infants, children and adults is the same as in Fig. A. The percentage of patient naïve (CD45RA+CCR7+) CD8 cells are significantly reduced in infancy (P < 0·01) and also significantly reduced in adult patients (P < 0·01). As noted for CD4 cells, in adult patients significant percent increase in effector memory CD8 cells is observed (P < 0·05).
Cell counts of lymphocytes and subsets.