Abstract
Selective IgA deficiency is the most common form of primary immunodeficiency, the molecular basis of which is unknown. To investigate the cause of selective IgA deficiency, we examined what stage of B-cell differentiation was blocked. DNA and RNA were extracted from three Japanese patients with selective IgA deficiency and three with a partial IgA deficiency. In selective IgA deficiency patients, Iα germline transcript expression levels decreased and α circle transcripts were not detected. Stimulation with PMA and TGF-β1 up-regulated Iα germline and α circle transcripts. In some patients, IgA secretion was induced by stimulation with anti-CD40, IL-4 and IL-10. In partial IgA deficiency patients, Iα germline, α circle transcripts and Cα mature transcripts were detected in the absence of stimulation. Our findings suggest that the decreased expression level of Iα germline transcripts before a class switch might be critical for the pathogenesis of some patients with selective IgA deficiency. However, in patients with a partial IgA deficiency, B-cell differentiation might be disturbed after a class switch.
Keywords: selective IgA deficiency, partial IgA deficiency, germline transcripts, circle transcripts, TGF-β1
INTRODUCTION
Selective IgA deficiency is a common form of primary immunodeficiency in Caucasians. However, there is a difference in frequency between the Caucasian and Asian populations (approximately 1 in 700 Caucasians and 1 in 18 500 Japanese being affected) [1,2]. Some IgA deficiency individuals have increased susceptibility to upper respiratory tract or gastrointestinal infections. Although the frequency of IgA deficiency is relatively high, the molecular basis of this disease is unknown and it is sometimes associated with deficiency of the IgG subclass or IgE and with common variable immunodeficiency [3–5]. Some IgG subclass deficiencies are caused by CH-gene deletions [6–8]. In addition, some cases of secondary IgA deficiency are caused by antiepileptic drugs [9], the others being associated with autoimmune disorders and malignancy. In patients with partial IgA deficiency whose serum IgA level is 2SD below normal levels [10], the serum IgA level increases with age. Therefore, it is conceivable that the mechanism underlying the IgA deficiency pathogenesis is heterogeneous [11].
B cells differentiate to IgA-bearing cells through a DNA recombination process that joins the Sµ to the Sα region with a deletion of the intervening sequence and this process is initiated by Iα germline transcripts. After switching, B cells normally differentiate from membrane IgA-bearing to IgA-secreting cells. The IgA deficiency may result from a defect or blockade at several levels, such as: 1) a structural gene defect; 2) impaired switching, which may be due to the lack of a specific switch recombinase, activation-induced cytidine deaminase (AID) [12], polymorphism, or accessibility of the S or I region; 3) failure of IgA-bearing B cells to differentiate into plasma cells; and 4) a defect at the transcriptional and/or at the post-transcriptional level [13]. There is an Sµ/Sα fragment or Sα/Sµ fragment of circular DNA in the IgA class switch recombination (CSR). Recently, Kinoshita et al. [14] examined whether isotype-specific transcripts are generated from I promoters located on excised circular DNA and found that isotype-specific I-Cµ transcripts, termed circle transcripts, were produced only in cells that express AID and undergo CSR in mice. Kinetic analysis of circle transcripts showed that they disappeared more quickly after the removal of cytokine stimulation than germline transcripts, circular DNA, or AID expression. Thus, circle transcripts are a hallmark of active CSR. In this study, to investigate the pathogenesis of IgA deficiency, we examined what stage of B-cell differentiation was blocked in this protein deficiency.
METHODS
Patients
Patients 1, 2 and 3 had a primary selective IgA deficiency whose serum IgA level was below the detection limit; patients 4, 5 and 6 had a partial IgA deficiency whose serum IgA level was above 5 mg/dL but 2SD below normal levels [10] at more than one year old, as shown in Table 1. Informed consent was obtained from all these patients or their parents.
Table 1.
Immunlogical data of patients
| Serum Ig (mg/dl)† | Surface Ig-bearing B cells (%) | IgG subclass (mg/dl) | ||||||||||
|---|---|---|---|---|---|---|---|---|---|---|---|---|
| Patient no. | Sex | Age | IgG | IgA | IgM | IgG | IgA | IgM | IgG1 | IgG2 | IgG3 | IgG4 |
| Selective IgA deficiency | ||||||||||||
| 1 | M | 6 years | 1120 (630–1490) | <5 (45–258) | 110 (72–305) | 1 | 0 | 23 | 619 | 255 | 57·3 | 33·9 |
| 2 | F | 14 years | 1750 (760–1680) | <5 (77–371) | 259 (69–296) | 1 | 1 | 13 | 630 | 625 | 35·1 | 18·4 |
| 3 | F | 7 years | 1430 (660–1340) | <5 (51–279) | 104 (73–310) | 0 | 0 | 5 | 893 | 382 | 47·4 | 59·4 |
| Partial IgA deficiency | ||||||||||||
| 4 | M | 21 months | 889 (460–1220) | 13 (16–128) | 69 (57–260) | 1 | 1 | 3 | 466 | 98.4 | 13·5 | 16·2 |
| 5 | F | 16 months | 465 (460–1220) | 9 (16–128) | 70 (57–260) | 1 | 0 | 5 | 306 | 69.3 | 27·6 | 3·8 |
| 6 | M | 18 months | 474 (460–1220) | 10 (16–128) | 83 (57–260) | 2 | 0 | 11 | 295 | 97.0 | 40·0 | 4·4 |
Normal range (2·5–97·5 percentile) of serum Ig are given in brackets where appropriate; they are from Normal Range for Clinical Testing of Japanese Children[15].
Cell preparation and culture
Peripheral blood mononuclear cells (PBMCs) were isolated from the heparinized blood of patients and control donors by gradient centrifugation in Ficoll-Paque (Amersham Bioscience, Uppsala, Sweden) [16]. PBMCs were suspended at a density of 106/ml in an RPMI 1640 medium supplemented with 10% heat-inactivated fetal calf serum, l-glutamin (2 mmol/l), penicillin (100 U/ml) and streptomycin (100µg/ml). PBMCs (106/ml) were cultured in the presence or absence of phorbol myristate acetate (PMA) (10 ng/ml) (Sigma Aldrich, St. Louis, MO, USA) and recombinant human-TGF-β1 (1 ng/ml) (R & D systems, Inc., Wiesbaden, Germany) for 24 h. Further, PBMCs obtained from patients of the selective IgA deficiency were cultured in the presence or absence of anti-CD40, IL-4 and IL-10 for seven days.
DNA transfer blot analysis and sequencing of IgA constant region
Genomic DNA was purified from a polynuclear cell fraction with a Sepa Gene (Sanko Jyunyaku, Tokyo, Japan). DNA transfer blot analysis was performed according to a previous report using a Cα 2 probe, which was a 2-kb Pst I fragment from ch. h. Igα−25 [17].
The fragments of the I promoter region, exon1, exon2, exon3 and the membrane exon of the α 1 gene were amplified, ligated to a T-vector (Novagen, Madison, WI, USA) and sequenced using an ABI 377 DNA Sequencing System (Applied Biosystems, Indianapolis, IN, USA).
PCR amplification of α 1 hs1, 2 enhancer
DNA fragments, including the region of variable number of tandem repeats (VNTR), of the α 1 hs1, 2 enhancer were amplified with consensus-flanking primers and the cycling conditions were as follows: sense 5′-GGGTCCTGGTCCCAAAGATGGC-3′ and antisense 5′-TTCCCAGGGGTCCTGTGGGTCC-3′[18]; 94°C for 1 min, 64°C for 1 min and 72°C for 1 min for 40 cycles.
cDNA synthesis
RNA was extracted from PBMCs cultured in the presence or absence of PMA and TGF-β1 for 24 h using an Isogen kit (Nippon Gene, Tokyo, Japan) and cDNA synthesis from 2µg of RNA was performed using a cDNA synthesis kit according to the manufacturer's instructions.
Semiquantitative PCR analysis of Iα germline transcripts
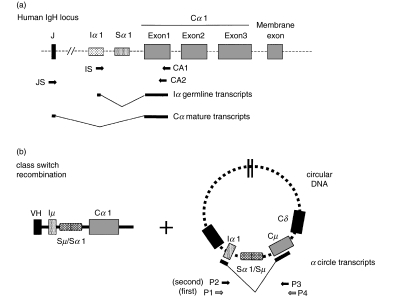
Figure 1 schematically shows the locations of oligomers used in the following experiments in the regions of JH, Iα 1, Cα 1 and Cµ. PCR amplification of the Iα germline transcripts was carried out using the primers and cycling conditions as follows. The sense primer was chosen from the 3′ region of the Iα 1 exon and the antisense primer was obtained from the 3′ region of the Cα 1 exon1 [19]. The following primers were used: IS, sense 5′-TGAGTGGACCTGCCATGA-3′(GenBank accession number-L04540), CA1, antisense 5′-CTGGGATTCGTGTAGT GCTT-3′ (J00220) (Fig. 1). For unstimulated cDNA; 94°C for 1 min, 58°C for 1 min and 72°C for 1 min for 28, 32, 36, 40 cycles. For stimulated cDNA; 94°C for 1 min, 58°C for 1 min and 72°C for 1 min for 35 cycles. The plasmid containing a 337 bp cDNA fragment from Iα germline transcripts was partially substituted with a 267 bp fragment from BLM cDNA [20] and was used as a competitor DNA. The PCR product of the wild type was 337 bp and that of the competitor was 287 bp. Each template contained 1µl of cDNA from 2µg of RNA extracted from PBMCs cultured in the presence of PMA and TGF-β1 and one of fivefold dilutions of the competitor DNA.
Fig. 1.
(a) Schematic of PCR strategies. The human IgH locus after VDJ rearrangement is shown schematically at the top. Primers are indicated by arrows. The PCR fragments amplified from cDNA are indicated by thick lines with a V-shaped line representing splicing. (b) Schematic of PCR strategies for circle transcripts. The IgA class switch recombination is shown. Thick lines below circular DNA indicate exons of α circle transcripts connected with a V-shaped line representing splicing.
Nested PCR analysis of α circle transcripts
Nested PCR analysis of α circle transcripts was carried out using the primers and cycling conditions as follows. The sense primer was chosen from the 3′ region of the Iα 1 exon and the antisense primer was obtained from the 3′ region of the Cµ. In the first round, the primers P1 and P4 were used at 95°C for 9 min in the denaturing step, 95°C for 1 min, 51°C for 1 min and 72°C for 2 min for 35 cycles. In the second round, the primers P2 (IS) and P3 were used at 94°C for 1 min, 58°C for 1 min and 72°C for 1 min for 35 cycles. The primers were: P1, 5′-CACAGCCAGC GAGGCAGAGC-3′ (L04540), P2, 5′-TGAGTGGACCTGC CATGA-3′ (L04540), P3, 5′-CGTCTGTGCCTGCATGACG-3′ (X14940), P4, 5′-ACGAAGACGCTCACTTTGGG-3′ (X14940) (Fig. 1).
PCR analysis of Cα mature transcripts
PCR amplification of Cα mature transcripts was carried out using the primers and cycling conditions as follows. The JH consensus sequence was used as the sense primer and the antisense primer was obtained from the 3′ region of the Cα 1 exon1. The following primers were used: JS, sense 5′-CCTGGTCAC CGTCTCCTCA-3′ (L20778), CA2, antisense 5′-ACGTGGCAT GTCACGGACTT-3′ (J00220) (Fig. 1); 94°C for 1 min, 59°C for 1min and 72°C for 1 min for 32, 34, 36 and 38 cycles.
Assay of IgA secretion
The concentration of IgA in the supernatant of PBMCs cultured in the presence or absence of anti-CD40, IL-4 and IL-10 for seven days was assayed by an enzyme-linked immunosorbent assay kit (Cygnus Technologies, Southport, NC, USA).
RESULTS
Southern blot analysis of Cα constant region
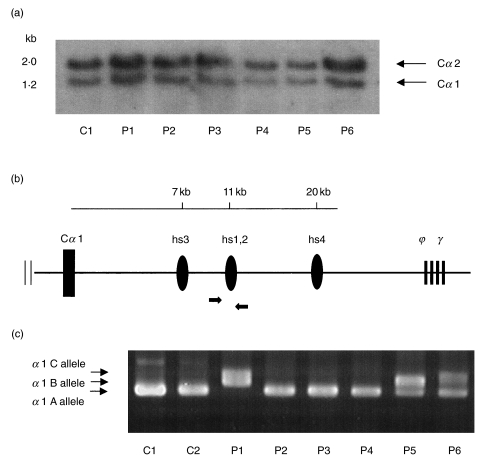
PstI-digested DNA samples from the six patients and one control subject were analysed using a Cα 2 gene probe. Human Cα genes are sufficiently homologous and detect both Cα 1 and Cα 2 genes. As shown in Fig. 2a, the large deletion of the constant region on the Cα genes was not detected in all subjects.
Fig. 2.
(a) Cα gene hybridization pattern. PstI-digested DNA samples from control (C1) and patients (P1–P6) were analysed by Southern blot analysis. The probe was a 2-kb Cα 2 fragment. The length in kb of each Cα gene, is indicated. (b) Schematic of PCR strategies for the detection of α 1 hs1, 2 enhancer located between Cα 1 and ϕγ. The α 1 hs3, α 1 hs1, 2, and α 1 hs4 fragments are located 7, 11, and 20kb downstream of the Cα 1 gene, respectively (20). Primers are indicated by arrows. (c) PCR fragments of α 1 hs1, 2 enhancer from genome DNA are shown. PCR products of sizes 462 bp, 515 bp and 568 bp for α 1 A, α 1 B and α 1 C, respectively. C1 and C2, normal controls; P1–P6, patients 1–6.
Genome sequence of Cα constant region
To examine the mutation of the α heavy chain, PCR analysis was performed using the primers of the I promoter region, exon1, exon2, exon3 and the membrane exon of the α 1 gene. There were no mutations in these regions. The polymorphism of the Cα 1 gene 882G→C (E175D) in exon2 was detected in patients 1, 3 and 5.
PCR amplification of α 1 hs1, 2 enhancer
We analysed the α hs1, 2 enhancer, which strongly regulates human IgH expression and is located within 12 kb downstream of both the human Ig Cα 1 and Cα 2 genes [18,21]. The α 1 hs1, 2 enhancer is located between Cα 1 and ϕγ (Fig. 2b). As shown in Fig. 2c, a fragment of the α 1 hs1, 2 enhancer was detected in all subjects. α 1 hs1, 2 has three variants with VNTR, namely α 1 A, α 1B and α 1C (including one, two and three repeats, respectively) [18]. The sizes of the PCR products were 462 bp, 515 bp and 568 bp for α 1 A, α 1 B and α 1 C, respectively. Controls 1 and 2, patients 2, 3 and 4 had the α 1 A/A allele, patient 1 had α 1B/C, patient 5 had α 1 A/B and patient 6 had α 1 A/C.
Germline transcript expression in IgA deficiency
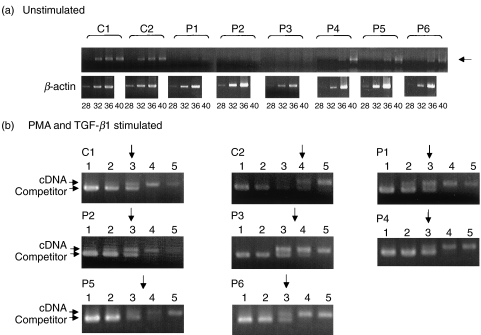
Germline transcripts are indispensable for the initiation of CSR. We examined the expression of Iα germline transcripts using a semiquantitative PCR analysis. First, the expression of the Iα germline transcripts of unstimulated PBMCs was examined by RT-PCR using different cycles and that expression from patients 1, 2 and 3 was not clearly detected even after 40 cycles were run and the expression levels were markedly lower than those in controls. In patients 4, 5 and 6, the expression levels were slightly lower than those in controls but the Iα germline transcripts were detected at significant levels (Fig. 3a). Next, competitive PCR analysis was applied to measure the expression level of Iα germline transcripts of PBMCs stimulated by PMA and TGF-β1. In both controls and IgA deficiency patients, the target cDNA and competitor were almost equivalent between lane 3 and lane 4 (Fig. 3b). The Iα germline transcripts of PBMCs from the selective and partial IgA deficiency patients were induced by PMA and TGF-β1 at a level almost equal to those in controls. The Iα germline transcripts of PBMCs from the selective and partial IgA deficiency patients were induced by PMA and TGF-β1 at a level almost equal to those in controls.
Fig. 3.
(a) Expression of Iα germline transcripts in unstimulated PBMCs. Semiquantitative determination using RT-PCR analysis. In each case, 28, 32, 36 and 40 cycles were run. β-actin was used as a control with a run of 28, 32 and 36 cycles. The position of target cDNA is indicated by an arrow. C1 and C2, normal controls; P1–P6, patients 1–6. (b) Competitive PCR of the expression of Iα germline transcripts. Each template contained the same amount of cDNA synthesized from RNA extracted from PBMCs after stimulation with PMA and TGF-β1 and one of fivefold dilutions of Iα germline transcript competitor (lanes 1–5). Each equivalent point is indicated by an arrow. C1 and C2, normal controls; P1–P6, patients 1–6.
Circle transcript expression in IgA deficiency
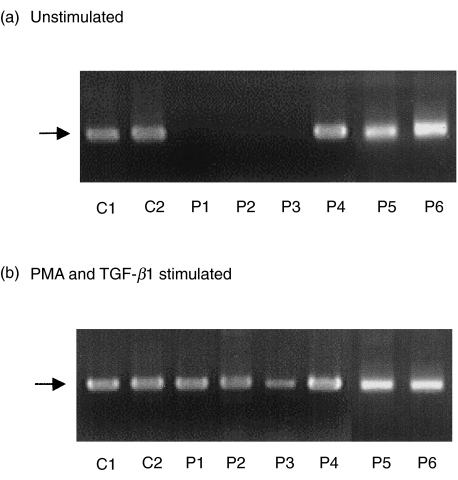
To determine whether the CSR from IgM to IgA could occur in the IgA deficiency patients, the expression of the α circle transcripts was examined. The α circle transcripts were generated from Iα promoters located on excised circular DNA and Cµ (Fig. 1b). Because the circle transcripts were not clearly detected at first PCR (data not shown) even in controls, we performed nested PCR and the α circle transcripts were detected in controls, patients 4, 5 and 6, but not in patients 1, 2 and 3 (Fig. 4). However, the circle transcripts were induced in PBMCs from patients 1, 2 and 3 after stimulation with PMA and TGF-β1.
Fig. 4.
Detection of α circle transcripts in PBMCs cultured without or with PMA and TGF-β1. The second PCR fragments of α circle transcripts are shown and are indicated by arrows. C1 and C2, normal controls; P1–P6, patients 1–6.
Mature transcript expression in IgA deficiency
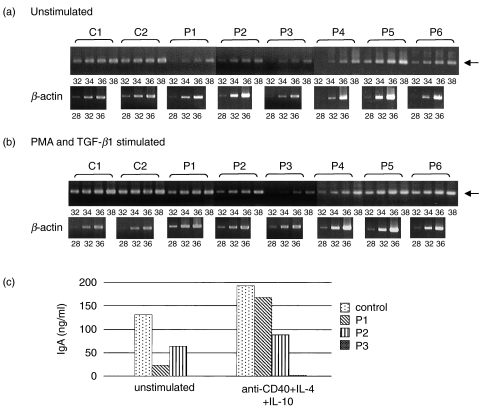
We further examined the expression of Cα mature transcripts, including both their membrane and secreted forms, by RT-PCR using different cycles. As shown in Fig. 5a, the expression levels of the Cα mature transcripts of unstimulated PBMCs from patients 1, 2, 3 and 4 decreased. In patients 5 and 6, the expression levels of the Cα mature transcripts decreased slightly compared to controls. The Cα mature transcripts were induced by PMA and TGF-β1 in patients 1 and 2. In patient 3, the Cα mature transcripts were not markedly induced by PMA and TGF-β1 stimulation (Fig. 5b).
Fig. 5.
Expression of Cα mature transcripts in PBMCs cultured without (a) or with (b) PMA and TGF-β1. Semiquantitative determination using RT-PCR analysis. In each case, 32, 34, 36 and 38 cycles were run. β-actin was used as a control with a run of 28, 32 and 36 cycles. The positions of target cDNA are indicated by arrows. C1 and C2, normal controls; P1–P6, patients 1–6. (c) IgA secretion was induced by activation of PBMCs. PBMCs (106/mL) were cultured in the presence or absence of anti-CD40, IL-4, and IL-10 for seven days. Concentration of IgA in the supernatant of PBMCs was measured by an enzyme-linked immunosorbent assay. P1–P3, patients 1–3.
IgA secretion induced by anti-CD40, IL-4 and IL-10
IgA secretion by CD40-activated PBMCs from patients with the selective IgA deficiency was examined. Anti-CD40, IL-4 and IL-10 induced IgA secretion in PBMCs from control and patient 1. In patient 2, IgA secretion was slightly induced. However, in patient 3, it was not induced by the same stimulation (Fig. 5c).
DISCUSSION
In this study, we demonstrated the following in selective IgA deficiency patients: 1) Cα genes were not deleted; 2) expression levels of Iα germline transcripts of unstimulated PBMCs markedly decreased; 3) Iα germline transcripts were induced by PMA and TGF-β1; 4) α circle transcripts of unstimulated PBMCs were not detected; 5) α circle transcripts were detected after stimulation; 6) Cα mature transcripts were induced by PMA and TGF-β1; and 7) IgA secretion was induced by appropriate stimulation.
Thus, the decreased expression level of the Iα germline transcripts is critical for the pathogenesis of the selective IgA deficiency in our patients and it is possible to induce IgA CSR in these patients. In partial IgA deficiency patients, although the expression levels of the Iα germline transcripts were slightly lower than controls, α circle and mature transcripts were detected. The number of surface IgA-bearing B cells was low in all of the IgA deficiency patients. It is suggested that a defect of the membrane-bound IgA at the post-transcriptional level may cause low IgA production in partial IgA deficiency patients. The expression of the membrane-bound immunoglobulin is indispensable for the generation of efficient primary and secondary immunoglobulin responses [22]. In this study, there was no mutation of the alternative splice site for the membrane exon of the Cα 1 gene.
The Iα germline transcripts are conceivably critical for the initiation of switching from Cµ to Cα. In a previous study, it was reported that the Iα germline transcripts were absent in peripheral B cells of IgA deficiency patients, suggesting the impairment of IgA switching [13]. However, it was also reported that the Iα germline transcripts were detected in all of the IgA deficiency patients tested as well as in normal controls [23]. Consistent with previous reports, our study revealed two different types of defects in B-cell differentiation – one was a decreased Cα mRNA level in IgA-switched B cells and the other was a switching defect, which may be present in IgA deficiency patients.
It is possible that some stimulation corresponding to that with PMA and TGF-β1 is reduced or blocked in selective IgA deficiency patients. In patients 1 and 2 but not 3, PMA and TGF-β1 could induced the α germline and mature transcripts and CD40 and appropriate cytokines induced IgA production. Therefore, in patient 3, the PMA and TGF-β1 pathways might be blocked, which were common signals in CD40 and cytokines, such as mitogen-activated protein kinase [24,25] and protein kinase C [26] signal transduction. In patient 1 and 2, distinct signal pathways between TGF-β1 and CD40 might be disturbed in B cells. Muller et al. reported that the serum levels of TGF-β1 in IgA deficiency patients were low [27]. In our cases, there was no difference in the level of TGF-β1 in plasma among selective IgA deficiency patients, partial IgA deficiency patients and controls (data not shown).
In recent studies, many lines of evidence have been presented indicating that primary IgA deficiency is inherited and associated with a certain major histocompatibility complex-conserved haplotype mainly in populations of the western world [28–30]. However, there are only a few studies that show an association of haplotypes, such as [HLA-A1, B8, DR3][30], with the IgA deficiency in Japanese patients [31]. In our study, the decreased expression level of the Iα germline transcripts is critical for the pathogenesis of the selective IgA deficiency in some patients. Partial IgA deficiency has distinct causes from those of the selective IgA deficiency. Since in most of the partial IgA deficiency patients the serum IgA level normalizes with age, the existence of suppressor factors for IgA B-cell differentiation may be assumed. In our cases, B-cell differentiation in selective IgA deficiency patients showed impairment before the CSR stage, while B-cell differentiation in partial IgA deficiency patients showed impairment after the CSR stage.
REFERENCES
- 1.World Health Organisation. Primary immunodeficiency diseases. Report of a WHO scientific group. Clin Exp Immunol. 1997;109(Suppl. 1):1–28. [PubMed] [Google Scholar]
- 2.Kanoh T, Mizumoto T, Yasuda N, et al. Selective IgA Deficiency in Japanese Blood Donors: frequency and statistical analysis. Vox Sang. 1986;50:81–6. doi: 10.1111/j.1423-0410.1986.tb04851.x. [DOI] [PubMed] [Google Scholar]
- 3.Espanol T, Catala M, Hernandez M, Caragol I, Bertran JM. Development of a common variable immunodeficiency in IgA deficient patients. Clin Immunol Immunopathol. 1996;80:333–5. doi: 10.1006/clin.1996.0132. [DOI] [PubMed] [Google Scholar]
- 4.Johnson ML, Keeton LG, Zhu ZB, Volanakis JE, Cooper MD, Schroeder JR. Age-related changes in serum immunoglobulins in patients with familial IgA deficiency and common variable immunodeficiency (CVID) Clin Exp Immunol. 1997;108:477–83. doi: 10.1046/j.1365-2249.1997.3801278.x. [DOI] [PMC free article] [PubMed] [Google Scholar]
- 5.Seligmann M, Aucouturier P, Danon F, Preudhomme JL. Changes in serum immunogulobulin patterns in adults with common variable immunodeficiency. Clin Exp Immunol. 1991;84:23–7. doi: 10.1111/j.1365-2249.1991.tb08118.x. [DOI] [PMC free article] [PubMed] [Google Scholar]
- 6.Bottaro A, de Marchi M, de Lange GG, Carbonara AO. Gene deletions in the human immunoglobulin heavy chain constant region gene cluster. Exp Clin Immunogenet. 1989;6:55–9. [PubMed] [Google Scholar]
- 7.Lefranc MP, Hammarstrom L, Smith CI, Lefranc G. Gene deletions in the human immunoglobulin heavy chain constant region locus: molecular and immunological analysis. Immunodefic Rev. 1991;2:265–81. [PubMed] [Google Scholar]
- 8.Terada T, Kaneko H, Li A, Kasahara K, Ibe M, Yokota S, Kondo N. Analysis of Ig subclass deficiency: First reported case of IgG2, IgG4, and IgA deficiency caused by deletion of Cα 1, ϕCγ, Cγ2, Cγ4, and Cɛ in a Mongoloid patient. J Allergy Clin Immunol. 2001;108:602–6. doi: 10.1067/mai.2001.118293. [DOI] [PubMed] [Google Scholar]
- 9.Maeoka Y, Hara T, Dejima S, Takeshita K. IgA and IgG2 deficiency associated with zonisamide therapy: a case report. Epilepsia. 1997;38:611–3. doi: 10.1111/j.1528-1157.1997.tb01147.x. [DOI] [PubMed] [Google Scholar]
- 10.Nagao AT, Mai FH, Pereira AB, Carnerio-Sampaio MMS. Measurement of salivary, urinary and fecal secretory IgA levels in children with partial or total IgA deficiency. J Invest Allergol Clin Immunol. 1994;4:234–7. [PubMed] [Google Scholar]
- 11.Burrows PD, Cooper MD. Iga Deficiency Adv Immunol. 1997;65:245–76. [PubMed] [Google Scholar]
- 12.Arakawa H, Hauschild J, Buerstedde JM. Requirement of the activation-induced deaminase (AID) gene for immunoglobulin gene conversion. Science. 2002;295:1301–6. doi: 10.1126/science.1067308. [DOI] [PubMed] [Google Scholar]
- 13.Islam KB, Baskin B, Nilsson L, Hammarstom L, Sideras P, Smith CIE. Molecular analysis of IgA deficiency. Evidence for impaired switching to IgA. J Immunol. 1994;152:1442–52. [PubMed] [Google Scholar]
- 14.Kinoshita K, Harigai M, Fagarasan S, Muramatsu M, Honjo T. A hallmark of active class switch recombination: Transcripts directed by I promoters on looped-out circular DNAs. Proc Natl Acad Sci USA. 2001;98:12620–3. doi: 10.1073/pnas.221454398. [DOI] [PMC free article] [PubMed] [Google Scholar]
- 15.The study team for the normal range of children. Tokyo: Japan Public Health Association(in Japanese); 1996. Normal range for clinical testing of Japanese children; pp. 263–78. [Google Scholar]
- 16.Kondo N, Fukutomi O, Agata H, et al. The role of T lymphocytes in patients with food-sensitive atopic dermatitis. J Allergy Clin Immunol. 1993;91:658–68. doi: 10.1016/0091-6749(93)90272-h. [DOI] [PubMed] [Google Scholar]
- 17.Kaneko H, Kondo N, Motoyoshi F, Mori Y, Kobayashi Y, Ozawa T, Orii T. Expression of the alpha-chain gene in heterogeneous IgA immunodeficiency. Scand J Immunol. 1990;32:483–9. doi: 10.1111/j.1365-3083.1990.tb03188.x. [DOI] [PubMed] [Google Scholar]
- 18.Denizot Y, Pinaud E, Aupetit C, Morvan CL, Magnoux E, Aldigier JC, Cogne M. Polymorphism of the human α 1 immunoglobulin gene 3′ enhancer hs1, 2 and its relation to gene expression. Immunology. 2001;103:35–40. doi: 10.1046/j.1365-2567.2001.01217.x. [DOI] [PMC free article] [PubMed] [Google Scholar]
- 19.Nilsson L, Islam KB, Olafsson O, Zalcberg I, Samakovlis C, Hammarstrom L, Smith CIE, Sideras P. Structure of TGF-β1-induced human immunoglobulin Cα 1 and Cα 2 germ-line transcripts. Int Immunol. 1991;3:1107–15. doi: 10.1093/intimm/3.11.1107. [DOI] [PubMed] [Google Scholar]
- 20.Ellis NA, Groden JYeTZ, Straughen J, Lennon DJ, Ciocci S, Proytcheva M, Gernan J. The Bloom's syndrome gene product is homologous to RecQ helicases. Cell. 1995;83:655–66. doi: 10.1016/0092-8674(95)90105-1. [DOI] [PubMed] [Google Scholar]
- 21.Hu Y, Pan Q, Pardali E, Mills FC, Bernestein RM, Max EE, Sideras P, Hammarstrom L. Regulation of germline promoters by the two human Ig heavy chain 3′α enhancers. J Immunol. 2000;164:6380–6. doi: 10.4049/jimmunol.164.12.6380. [DOI] [PubMed] [Google Scholar]
- 22.Tashita H, Fukao T, Kaneko H, Teramoto T, Inoue R, Kasahara K, Kondo N. Molecular basis of selective IgG2 deficiency. The mutated membrane-bound form of γ 2 heavy chain caused complete IgG2 deficiency in two Japanese sibilings. J Clin Invest. 1998;101:677–81. doi: 10.1172/JCI1672. [DOI] [PMC free article] [PubMed] [Google Scholar]
- 23.Wang Z, Yunis D, Irigoyen M, Kitchens B, Bottaro A, Alt FW, Alper CA. Discordance between IgA switching at the DNA level and IgA expression at the mRNA level in IgA-deficient patients. Clin Immunol. 1999;91(3):263–70. doi: 10.1006/clim.1999.4702. [DOI] [PubMed] [Google Scholar]
- 24.Zhang K, Zhang L, Zhu D, Bae D, Nel A, Saxon A. CD40-mediated p38 mitogen-activated protein kinase activation is required for immunoglobulin class switch recombination to IgE. J Allergy Clin Immunol. 2002;110:421–8. doi: 10.1067/mai.2002.126382. [DOI] [PubMed] [Google Scholar]
- 25.Yamaguchi K, Shirakabe K, Shibuya H, et al. Identification of a member of the MAPKKK family as a potential mediator of TGFβ signal transduction. Science. 1995;270:2008–11. doi: 10.1126/science.270.5244.2008. [DOI] [PubMed] [Google Scholar]
- 26.Yan JC, Wu ZG, Kong XT, Zong RQ, Zhan LZ. Effect of CD40–CD40 ligand interaction on diacylglycerol-protein kinase C and inositol triphosphate- Ca2+ signal transduction pathway in human umbilical vein endotherial cells. Clin Chim Acta. 2003;337:133–40. doi: 10.1016/j.cccn.2003.08.007. [DOI] [PubMed] [Google Scholar]
- 27.Muller F, Aukrust P, Nilssen DE, Froland SS. Reduced serum level of transforming growth factor-β in patients with IgA deficiency. Clin Immunol Immunopathol. 1995;76:203–8. doi: 10.1006/clin.1995.1116. [DOI] [PubMed] [Google Scholar]
- 28.Vorechovsky I, Webster ADB, Plebani A, Hammarstrom L. Genetic linkage of IgA deficiency to the major histocompatibility complex: evidence for allele segregation distortion, parent-of-origin penetrance differences and the role of anti-IgA antibodies in disease predisposition. Am J Hum Genet. 1999;64:1096–109. doi: 10.1086/302326. [DOI] [PMC free article] [PubMed] [Google Scholar]
- 29.Kralovicova J, Hammarstrom L, Plebani A, Webster ADB, Vorechovsky I. Fine-scale mapping at IGAD1 and genome-wide genetic linkage analysis implicate HLA-DQ/DR as a major susceptibility locus in selective IgA deficiency and common variable immunodeficiency. J Immunol. 2003;170:2765–75. doi: 10.4049/jimmunol.170.5.2765. [DOI] [PubMed] [Google Scholar]
- 30.Price P, Witt C, Allcock R, et al. The genetic basis for the association of the 8.1 ancestral haplotype (A1,B8,DR3) with multiple immunopathological diseases. Immunol Rev. 1999;167:257–74. doi: 10.1111/j.1600-065x.1999.tb01398.x. [DOI] [PubMed] [Google Scholar]
- 31.Futakami Y, Suto K, Onodera Y, et al. HLA antigen in Japanese blood donors with IgA deficiency(in Japanese) Jp J Transfus Med. 2002;48:298–03. [Google Scholar]


