Abstract
We have previously studied the effect of three different treatment regimens with interferon (IFN)-α alone or in combination with amantadine or ribavirin on viral kinetics in the first month of therapy. To understand the regulation of cytokine immune response during early inhibition of HCV replication, we analysed the longitudinal profile of proinflammatory markers (soluble TNFRs), of type 1 cytokines [IFN-γand interleukin (IL-12)], and of a type 2 cytokine (IL-10). Twenty-two chronic hepatitis C patients received daily therapy for 6 months. Sera were collected at baseline, at 6, 12, 24, 30 and 48 h and at the 3rd, 7th, 15th and 30th days of treatment. All cytokines and receptors were evaluated by enzyme linked immunosorbent assay (ELISA). At baseline, a correlation was found between the two soluble TNFRs (P < 0·0001) and between the soluble TNFRs and ALT levels (P < 0·003), as shown previously. Regardless of the type of treatment, lower levels of soluble TNFR-p75 were present from day 3 in patients who had significant virus decay at day 30 (P < 0·01). Baseline IL-10 levels correlated with TNFR-p75 (P < 0·01) and with treatment response (P < 0·05) and a significant IL-10 reduction from baseline was observed from day 3 among responders, irrespective of the type of treatments (P < 0·05). IL-12 and IFN-γ levels did not differ according to treatment or outcome. These findings suggest a pivotal role for IL-10 in orchestrating the antiviral immune response. Its early decline can favour the shift from a Th2 to a Th1 immune response, which has been shown to be associated with a long-term virological response to treatment.
Keywords: chronic hepatitis C, cytokines, IFN-α therapy, IL-10, sTNF-α receptors
INTRODUCTION
Hepatitis C virus (HCV) is a major cause of chronic liver infection worldwide [1] and over the last decade there have been significant advances in the treatment of chronic HCV infection. Current standard treatment is based on the combination of interferon (IFN)-α plus ribavirin, while the use of amantadine is still debated [2,3].
Viral factors, such as genotype and viral load, as well as host factors can affect clinical course and response to therapy. Among the host factors, the balance of the two arms of the immune system, the innate and the adaptive one, which interact with each other also through a cytokine network, plays an important role in the pathogenesis and clinical outcome of HCV-related hepatitis. Cytokines are produced immediately by cells of the innate system, such as macrophages, natural killer cells, dendritic cells and neutrophils, in response to pathogens or danger signals and can affect directly or indirectly lymphocytes or antigen-presenting cells to induce an adaptive immune response [4]. Indeed, the function of a given cytokine is determined by its tissue level, the nature of target cells and activating signal, the timing and sequence of cytokine exposure [5].
To examine whether antiviral treatment can affect cytokine profile in the early phase of therapy, we studied three groups of patients enrolled into a recently published pilot study in which we have evaluated the effect of three different therapeutic regimens: IFN alone, IFN plus amantadine and IFN plus ribavirin on viral clearance kinetic [6].
In the present study, we analysed first the baseline levels and the kinetic in each therapeutic regimen of soluble tumour necrosis factor (TNF)-α receptors (sTNFRs), as proinflammatory markers, of IL-10, a monocyte-macrophage and Th2-derived cytokine, of IL-12, a Th1-stimulating and monocyte-macrophage-derived cytokine and of INF-γ, a Th1 cytokine. Finally, we compared them with the outcome of the antiviral treatment.
MATERIALS AND METHODS
Patients
A series of 22 consecutive patients with chronic active hepatitis C but without cirrhosis in the liver biopsy (METAVIR score 1 or 2), previously untreated, was enrolled into the study (Table 1). Written informed consent was obtained from all participants. Patients were assigned randomly to receive a course of treatment of 6 months with: IFN 3 MU daily (IFN group, seven patients); or IFN 3 MU daily plus amantadine 200 mg p.o. in a single daily dose (IFN + A group, seven patients); or IFN 3 MU daily plus ribavirin 1–1·2 g (according to body weight) p.o. in two divided doses (IFN + R group, eight patients). All patients were hepatitis B surface antigen and antibody to HIV negative. Blood samples were drawn at baseline, at 6, 12, 24, 30 and 48 h from the beginning of the treatment, at the 3rd, 7th and 15th days and then monthly during the treatment. Serum was separated within 2 h from the collection and stored at −80°C until use. Viraemia was evaluated qualitatively by the Cobas Amplicor HCV (cut-off 100 copies/ml; Roche Spa, Milan, Italy) and quantitatively by the Cobas Amplicor HCV Monitor (cut-off 1000 copies/ml; Roche Spa). The HCV genotype was determined for each patient by Inno-LiPA HCV II (Innogenetics, Ghent, Belgium). Liver function tests were evaluated at baseline, at the 7th and 15th days and then monthly.
Table 1.
Characteristics of the patients
| IFN | IFN + amantadine | IFN + ribavirin | |
|---|---|---|---|
| Age (median and range) | 41 (62–25) | 40 (65–24) | 50 (58–27) |
| M/F | 5/2 | 5/2 | 6/2 |
| Genotype 1b | 2 of 7 | 3 of 7 | 3 of 8 |
| HCV-RNA (106copies/ml) (median and range) | 2·74 (0·58–12·7) | 6·28 (0·36–8·98) | 4·98 (2·8–9·17) |
| ALT IU/l (median and range) | 109 (209–71) | 109 (161–62) | 98 (125–63) |
SolubleTNF-α receptor assays
Soluble TNFRs with biological activity were measured in diluted sera (1 : 5) by an enzyme linked binding assay (ELIBA) with a TNF-α horseradish peroxidase conjugate as detecting agent, as described previously [7]. Briefly, 96-well microtitre plates (Maxisorp Nunc, Denmark) were coated for 24 h at room temperature with TNF-binding non-inhibitory monoclonal antibodies against TNFR-p55 (clone htr-20) or -p75 (clone utr-4). The plates were saturated with 1% bovine serum albumin (BSA), 0·1% phenol and 0·1% Tween-20. In a single-step reaction, sera were incubated with TNF-α enzyme conjugate in the microtitre plates. Bound TNF-α was measured enzymatically with tetramethyl-benzidene as substrate and reading was conducted at 450 nm. Standard curves were generated with recombinant sTNFR-p55 or -p75 and the concentrations of sTNFRs were determined by interpolation from the standard curve. The lower limit of detection for both types of the receptors was 60 pg/ml. The assays showed no cross-reactions to cytokines (e.g. TNF-β) or cytokine receptors (IFN-γ R, IL-6R, IL-2R).
IL-12 measurement
Serum levels of IL-12 heterodimer were determined by a specific enzyme linked immunosorbent assay (ELISA) using a rat monoclonal antibody (clone 20C2) reacting with a conformational epitope on the 75-kDa heterodimer IL-12 molecule, as described previously, with minor modifications [8]. Briefly, 96-well microtitre plates (Nunc Maxisorp, Denmark) were coated with 100 µl of the primary monoclonal antibody against IL-12 (2·5 µg/ml in 0·01 m bicarbonate buffer, pH 9·6) and incubated overnight at 4°C. The coated plates were washed three times in deionized water and the remaining non-specific protein binding capacity of the wells was blocked with 0·5% BSA in phosphate buffered saline (PBS, pH 7·4) overnight at 4°C. Serum samples diluted 1 : 5, and serial dilutions of the recombinant standards (IL-12) were added to the plates and incubated for 2 h at 20°C. After washing with PBS containing 0·05% Tween 20 buffer, 100 µl of secondary antibody (clone 4D6-POD, working concentration 125 ng/ml) was added for 2 h. The enzyme reaction was developed using 100 µl of 10 mmol/l tetramethylbenzidine (TMB), 80 mmol/l H2O2 and 30 mmol/l potassium citrate (pH 4·1). After 10 min incubation at room temperature, the reaction was terminated with 50 µl of 1 m H3Po4 and the optical density (OD) read at 450 nm (Dynatech MR 700 automated plate reader). Each sample was tested in duplicate and the values determined from the standard curve (range 0–800 pg/ml), constructed using the serial dilutions of recombinant IL-12 standards. The detection limit was <10 pg/ml with the intra- and interassay variances being 6·3 ± 2·5.
Assays for IFN-γ and IL-10
Serum IFN-γ levels were measured with a sandwich ELISA (antibodies were kindly donated by Dr H. Gallati, Hoffmann-La Roche, Basel, Switzerland) as described previously [9]. Serum samples, diluted 1 : 5, were compared with serial dilutions of recombinant standards IFN-γ (specific activity 2 × 10⁸ U/mg).
Optical density readings were performed at 450 nm. The ELISA was sensitive to IFN-γ levels above 3 pg/ml. The inter- and intra-assay coefficients of variation were 8% and 5%. The specificity was confirmed by testing the assays against other human cytokines (500 pg/ml of recombinant TNF-α, IL-1α, IL-β and IL-6) which showed no cross-reactivity. Serum levels of IL-10 were measured using a commercially available ELISA according to the manufacturer's instructions (Meddgenisx, Fleurus, Belgium).
Statistical analysis
The results were analysed with non-parametric tests (χ2 Wilcoxon, Mann–Whitney U and Spearman rank correlation tests) as appropriate. All calculations were performed on a personal computer with Statistica (StatSoft, USA).
RESULTS
Treatment responses
As described previously, the initial viral decay curves showed an exponential decline of the circulating viraemia from baseline to 30 h of treatment, followed by a slower viral decline from 30 h to 15 days and onwards. At 15 days the residual viral fraction was of 2·0%, 0·2% and 0·3% for the IFN, IFN + A and IFN + R regimes, respectively. After the first month of treatment, three patients in the IFN group, five in the IFN + A group and four in the IFN + R group presented with a significant response to antiviral treatment (>3 log reduction). At the same time-point, four patients in the IFN group and six in each of the INF + A and IFN + R groups had normal ALT levels. Sustained response at 6 months post-treatment was reached by one patient only in the IFN group (14·2%), and by three patients in the IFN + A group (42·8%) and in the IFN + R group (37·5%).
Soluble TNF-α receptors
At baseline, a significant correlation was present between the levels of the sTNFR-p55 and -p75 (r = 0·804; P < 0·0001, Spearman's rank test). Moreover, the two sTNF-α receptors correlated with the intensity of hepatocytolysis, as expressed as ALT levels (TNFR-p55 versus ALT; r = 0·42; P < 0·049; TNFR-p75 versus ALT r = 0·61, P < 0·003, Spearman's rank test).
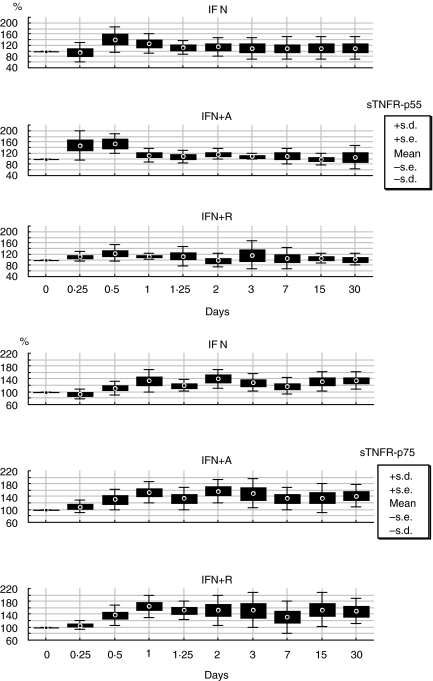
The longitudinal analysis of the two soluble TNF-α receptors, showed as percentage of variation from baseline, demonstrates the early induction of the receptors, after starting therapy, without any statistical difference at any time point during the treatment period and among the antiviral treatment regimens (Fig. 1).
Fig. 1.
Longitudinal variation in percentage from baseline according to treatment schedules of sTNFR-p55 and sTNFR-p75.
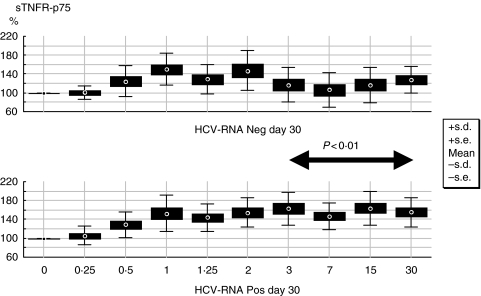
When we analysed sTNFR-p55 and p75 levels according to the virological response at day 30, significant lower levels of p75 were already present after 3 days of treatment and afterwards in patients with a significant response to treatment irrespective of therapeutic regimen (P = 0·01; Mann–Whitney U-test for each time-point) (Fig. 2).
Fig. 2.
Longitudinal variation in percentage from baseline of sTNFR-p75 according to virological response at day 30 of treatment.
Cytokine profile
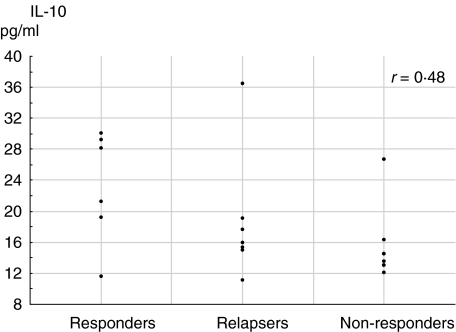
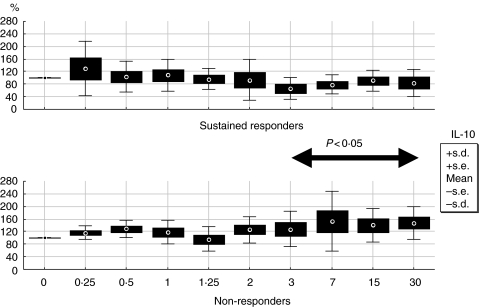
The baseline values of IL-10 correlated with sTNFR-p75 (r = 0·54, P < 0·01; Spearman's rank test) but not to sTNFR-p55. With regard to the final outcome, IL-10 baseline levels correlated with treatment response (r = 0·48, P < 0·05, Spearman's rank test) (Fig. 3) and when analysed by the percentage of variations from baseline, significant lower levels of IL-10 were present from day 3 onwards in sustained responders versus non-responders (P < 0·05; Mann–Whitney U-test for each time-point) (Fig. 4).
Fig. 3.
Correlation between baseline levels of IL 10 and final treatment outcome (all patients are included, so some points are close to overlapping in the graph).
Fig. 4.
Longitudinal variation in percentage from baseline of IL-10 in sustained responders versus non-responders. Relapsers are not represented in this graph.
The analysis of baseline values for serum IL-12 and IFN-γ demonstrated neither difference nor correlation related to type of treatment, HCV-RNA level at day 30 or response to treatment. Neither difference was present in the longitudinal analysis of the two cytokines when evaluated as percentage of variation from baseline in respect to treatment regimens, HCV-RNA level at day 30 or response to treatment.
The homogeneity of the histology status did not allow any further considerations in respect to cytokine kinetic, type of treatment or response to treatment.
DISCUSSION
In a previous work we studied the clearance kinetic of HCV under three different antiviral therapies in the first month of treatment to understand the mechanisms of action and their efficacy [6]. In the present work we sought to investigate whether antiviral therapy can affect cytokine as well as virological profiles, and if a successful response to therapy correlated with particular cytokine regulations.
We evaluated serum levels of two cytokines, IL-12 and IFN-γ, involved in a polarized Th1 response and of IL-10, involved in a Th2 response. In addition, as markers of inflammation, we considered soluble TNFR, p55 and p75, which are constitutively present in serum and derived after receptor shedding upon cellular activation to the same inflammatory stimuli that induce TNF-α production [10]. In particular both receptors are responsible for distinct TNF-α activity: TNFR-p55 mediates cytotoxicity, fibroblast proliferation and antiviral activity, whereas p75 is involved in thymocyte proliferation, cytotoxic T lymphocyte proliferation and induction of granulocyte/macrophage colony stimulating factor synthesis [11].
We could not find any difference in all the cytokines and sTNFRs profiles at any time-point during the first month of treatment among the three treatment regimens: IFN, IFN + amantadine and IFN + ribavirin.
At baseline, TNFR-p55 and -p75 levels correlated with each other and with the degree of liver disease, as already reported in previous work showing that both TNFR-p55 and -p75 levels are significantly elevated in chronic hepatitis C, reflecting ongoing disease activity, but without correlation with the response to treatment [12–14]. Instead, in the longitudinal evaluation, patients who had a significant response to treatment at day 30 showed decreasing levels of TNFR-p75 from day 3 of treatment, which seemed to parallel the progressive reduction in the inflammation.
Regarding IL-12 and IFN-γ, the study of the in vivo kinetics during the first month of therapy showed no differences relating not only to the type of treatment but also to the clinical outcome of the patients.
With regard to IL-10, our data demonstrate that (1) at baseline the serum levels of sTNF-α receptors correlated directly with the serum levels of IL-10; (2) treatment response correlated positively with higher pretreatment levels of IL-10; and (3) IL-10 levels decreased in patients that responded to therapy irrespective to the type of treatment.
We realize that given the relatively small number of patients, final conclusions may be difficult to draw. Nevertheless, from our findings two observations arise.
First, the detection of a decreasing IL-10 pattern in sustained responders, who have also higher baseline levels in comparison to non-responders, suggests a pivotal role of this cytokine in orchestrating an adequate immune response to HCV in the first month. IL-10 is a pleiotropic cytokine, acting in different phases of the immune response. It is secreted by cells of the innate immune system as well as by lymphocytes, performing differently according to the phase of the early or adaptive immune response [15]. IL-10 has anti-inflammatory and immunosuppressive functions: it inhibits cell functions such as T cell proliferation, major histocompatibility complex expression, IL-2 receptor expression and natural killer activity [16]. Recently it has been demonstrated that IL-10 genes, as well as other cytokines genes, are polymorphic at specific sites, and these polymorphisms have been associated with differing production of specific cytokines [17,18]. It has been postulated that the interference with Th1 cells by increased production of Th2 cytokines may be one mechanism whereby the host immune system is compromised in chronic HCV disease. Indeed, the development of chronic HCV infection has been associated with high levels of IL-10 and Th2-type cytokines [16,19–21]. Moreover, it has also been shown that a lower Th1/Th2 ratio before IFN therapy favours a sustained virological response [22,23] and that the inheritance of the IL-10 promoter alleles, which show high IL-10 production, correlates positively with response to therapy [18,22,24,25]. Nevertheless, the clearance of HCV has been associated with a strong Th1 cells and Th1 cytokines response in acute [26] and chronic [1,27,28] HCV infection.
Our analysis provides evidence that a change from high to low IL-10 production occurs very early after starting therapy and is seen, despite the treatment type, in patients who will become sustained responders. It has been shown that IFN therapy can decrease IL-10 secretion, as well as IL-4 secretion, but this effect seems to appear later during treatment [16,29]. In our previous work we showed that IFN is the most effective antiviral drug in the early phase of treatment, while ribavirine and amantadine seem to play a role only later [6]. There is growing evidence that HCV causes disregulation of the immune system through many mechanisms, such as the interactions between the core protein and C1qr or the E2 and CD81, as summarized recently in several reviews [25,30,31]. It is therefore conceivable that the early decline of HCV viraemia caused by the antiviral therapy could induce a shift within the immune system with a decrease of the Th2 immune response, which would unleash a Th1 polarized response.
The second observation is that the cytokines variation in our study was independent from the addition of a second drug. This suggests that ribavirina and amantadine exert mainly antiviral effects, at least in the first period, without influencing directly the immune response even if an immune modulation has been described for each of them [27,32,33].
Understanding the mechanisms of early viral clearance in patients with chronic HCV infection who respond to therapy may potentially allow the optimization of therapy and the development of new immunomodulatory agents or approaches.
References
- 1.Lauer GM, Walker BD. Hepatitis C virus infection. N Engl J Med. 2001;345:41–52. doi: 10.1056/NEJM200107053450107. [DOI] [PubMed] [Google Scholar]
- 2.Torre F, Picciotto A. Amantadine: a different approach. J Hepatol. 2002;36:705. doi: 10.1016/s0168-8278(02)00030-2. [DOI] [PubMed] [Google Scholar]
- 3.Berg T, Kronenberger B, Hinrichsen H, et al. Triple therapy with amantadine in treatment-naive patients with chronic hepatitis C: a placebo-controlled trial. Hepatology. 2003;37:1359–67. doi: 10.1053/jhep.2003.50219. [DOI] [PubMed] [Google Scholar]
- 4.Belardelli F, Ferrantini M. Cytokines as a link between innate and adaptive antitumor immunity. Trends Immunol. 2002;23:201–8. doi: 10.1016/s1471-4906(02)02195-6. [DOI] [PubMed] [Google Scholar]
- 5.Cavaillon JM. Pro- versus anti-inflammatory cytokines: myth or reality. Cell Mol Biol (Noisy le Grand) 2001;47:695–702. [PubMed] [Google Scholar]
- 6.Torre F, Giusto R, Grasso A, et al. Clearance kinetics of hepatitis C virus under different antiviral therapies. J Med Virol. 2001;64:455–9. doi: 10.1002/jmv.1071. [DOI] [PubMed] [Google Scholar]
- 7.Marinos G, Naoumov NV, Rossol S, et al. Tumor necrosis factor receptors in patients with chronic hepatitis B virus infection. Gastroenterology. 1995;108:1453–63. doi: 10.1016/0016-5085(95)90694-0. [DOI] [PubMed] [Google Scholar]
- 8.Rossol S, Marinos G, Carucci M, et al. Interleukin 12 induction of Th1 cytokines is important for viral clearance in chronic hepatitis B. J Clin Invest. 1997;99:3025–33. doi: 10.1172/JCI119498. [DOI] [PMC free article] [PubMed] [Google Scholar]
- 9.Rossol S, Voth R, Laubenstein HP, et al. Interferon production in patients infected with HIV-1. J Infect Dis. 1989;159:815–21. doi: 10.1093/infdis/159.5.815. [DOI] [PubMed] [Google Scholar]
- 10.Aderka D, Engelmann H, Maor Y, et al. Stabilization of the bioactivity of tumour necrosis factor by its soluble receptors. J Exp Med. 1992;175:323–9. doi: 10.1084/jem.175.2.323. [DOI] [PMC free article] [PubMed] [Google Scholar]
- 11.Tartaglia LA, Goeddel DV. Two TNF receptors. Immunol Today. 1992;13:151–3. doi: 10.1016/0167-5699(92)90116-O. [DOI] [PubMed] [Google Scholar]
- 12.Nelson DR, Lim HL, Marousis CG, et al. Activation of tumor necrosis factor-alpha system in chronic hepatitis C virus infection. Dig Dis Sci. 1997;42:2487–94. doi: 10.1023/a:1018804426724. [DOI] [PubMed] [Google Scholar]
- 13.Zylberberg H, Rimaniol AC, Pol S, et al. Soluble tumor necrosis factor receptors in chronic hepatitis C: a correlation with histological fibrosis and activity. J Hepatol. 1999;30:185–91. doi: 10.1016/s0168-8278(99)80060-9. [DOI] [PubMed] [Google Scholar]
- 14.Kallinowski B, Haseroth K, Marinos G, et al. Induction of tumour necrosis factor (TNF) receptor type p55 and p75 in patients with chronic hepatitis C virus (HCV) infection. Clin Exp Immunol. 1998;111:269–77. doi: 10.1046/j.1365-2249.1998.00469.x. [DOI] [PMC free article] [PubMed] [Google Scholar]
- 15.Mocellin S, Panelli MC, Wang E, et al. The dual role of IL-10. Trends Immunol. 2003;24:36–43. doi: 10.1016/s1471-4906(02)00009-1. [DOI] [PubMed] [Google Scholar]
- 16.Cacciarelli TV, Martinez OM, Gish RG, et al. Immunoregulatory cytokines in chronic hepatitis C virus infection: pre- and posttreatment with interferon alfa. Hepatology. 1996;24:6–9. doi: 10.1002/hep.510240102. [DOI] [PubMed] [Google Scholar]
- 17.Bidwell J, Keen L, Gallagher G, et al. Cytokine gene polymorphisms in human disease: on-line databases. Genes Immunol. 2001;2(Suppl 1):61. doi: 10.1038/sj.gene.6363733. [DOI] [PubMed] [Google Scholar]
- 18.Lio D, Caruso C, Di Stefano R, et al. IL-10 and TNF-α polymorphisms and the recovery from HCV infection. Human Immunol. 2003;64:674–80. doi: 10.1016/s0198-8859(03)00080-6. [DOI] [PubMed] [Google Scholar]
- 19.Tsai SL, Liaw YF, Chen MH, et al. Detection of type 2-like T-helper cells in hepatitis C virus infection: implications for hepatitis C virus chronicity. Hepatology. 1997;25:449–58. doi: 10.1002/hep.510250233. [DOI] [PubMed] [Google Scholar]
- 20.Kakumu S, Okumura A, Ishikawa T, et al. Production of interleukins 10 and 12 by peripheral blood mononuclear cells (PBMC) in chronic hepatitis C virus (HCV) infection. Clin Exp Immunol. 1997;108:138–43. doi: 10.1046/j.1365-2249.1997.d01-987.x. [DOI] [PMC free article] [PubMed] [Google Scholar]
- 21.Eckels DD, Tabatabail N, Bian TH, et al. In vitro human Th-cell responses to a recombinant hepatitis C virus antigen: failure in IL-2 production despite proliferation. Hum Immunol. 1999;60:187–99. doi: 10.1016/s0198-8859(98)00111-6. [DOI] [PubMed] [Google Scholar]
- 22.Masaki N, Fukushima S, Hayashi S. Lower Th-1/Th-2 ratio before interferon therapy may favor long-term virological responses in patients with chronic hepatitis C. Dig Dis Sci. 2002;47:2163–9. doi: 10.1023/a:1020114722763. [DOI] [PubMed] [Google Scholar]
- 23.Piazzolla G, Tortorella C, Fiore G, et al. Interleukin-12 p40/p70 ratio and in vivo responsiveness to IFN-alpha treatment in chronic hepatitis C. J Interferon Cytokine Res. 2001;21:453–61. doi: 10.1089/10799900152434303. [DOI] [PubMed] [Google Scholar]
- 24.Knapp S, Hennig BJW, Frodsham AJ, et al. Interleukin-10 promoter polymorphisms and the outcome of hepatitis C virus infection. Immunogenetics. 2003;55:362–9. doi: 10.1007/s00251-003-0594-5. [DOI] [PubMed] [Google Scholar]
- 25.Bertoletti A, Ferrari C. Kinetics of the immune response during HBV and HCV infection. Hepatology. 2003;38:4–13. doi: 10.1053/jhep.2003.50310. [DOI] [PubMed] [Google Scholar]
- 26.Thimme R, Oldach D, Chang KM, et al. Determinants of viral clearance and persistence during acute hepatitis C virus infection. J Exp Med. 2001;194:1395–406. doi: 10.1084/jem.194.10.1395. [DOI] [PMC free article] [PubMed] [Google Scholar]
- 27.Cramp ME, Rossol S, Chokshi S, et al. Hepatitis C virus-specific T-cell reactivity during interferon and ribavirin treatment in chronic hepatitis C. Gastroenterology. 2000;118:346–55. doi: 10.1016/s0016-5085(00)70217-4. [DOI] [PubMed] [Google Scholar]
- 28.Sreenarasimhaiah J, Jaramillo A, Crippin J, et al. Concomitant augmentation of type 1 CD4(+) and CD8(+) T-cell responses during successful interferon-alpha and ribavirin treatment for chronic hepatitis C virus infection. Hum Immunol. 2003;64:497–504. doi: 10.1016/s0198-8859(03)00041-7. [DOI] [PubMed] [Google Scholar]
- 29.Kakumu S, Okumura A, Ishikawa T, et al. Serum levels of IL-10, IL-15 and soluble tumour necrosis factor-alpha (TNF-alpha) receptors in type C chronic liver disease. Clin Exp Immunol. 1997;109:458–63. doi: 10.1046/j.1365-2249.1997.4861382.x. [DOI] [PMC free article] [PubMed] [Google Scholar]
- 30.Hahn YS. Subversion of immune responses by hepatitis C virus: immunomodulatory strategies beyond evasion? Curr Opin Immunol. 2003;15:443–9. doi: 10.1016/s0952-7915(03)00076-1. [DOI] [PubMed] [Google Scholar]
- 31.Racanelli V, Rehermann B. Hepatitis C virus infection: when silence is deception. Trends Immunol. 2003;24:456–64. doi: 10.1016/s1471-4906(03)00178-9. [DOI] [PubMed] [Google Scholar]
- 32.Tam RC, Pai B, Bard J, et al. Ribavirin polarizes human T cell responses towards a Type 1 cytokine profile. J Hepatol. 1999;30:376–82. doi: 10.1016/s0168-8278(99)80093-2. [DOI] [PubMed] [Google Scholar]
- 33.Tribl GG, Wober C, Schonborn V, et al. Amantadine in Parkinson's disease: lymphocyte subsets and IL-2 secreting T cell precursor frequencies. Exp Gerontol. 2001;36:1761–71. doi: 10.1016/s0531-5565(01)00128-0. [DOI] [PubMed] [Google Scholar]


