Abstract
Monocyte-derived dendritic cells (MdDCs) from many patients with common variable immunodeficiency (CVID) have been shown recently to have reduced expression of surface molecules associated with maturity. Using flow cytometry and confocal microscopy, we now show that this is due to a partial failure to fix Class II DR molecules on the surface during procedures that induce full maturation in vitro in cells from normal subjects. Major histocompatibility complex (MHC) class I, CD86 and CD83 expression were expressed normally, but CD40 was reduced. These abnormalities are unlikely to be due to prior in vivo exposure of monocytes to lipopolysaccharide (LPS), as addition of LPS to monocytes from normal subjects in vitro caused a different pattern of changes. CVID MdDCs retained Class II DR in the cytoplasm during maturation, showed increased internalization of cross-linked Class II DR surface molecules and were unable to polarize DR within a lipid raft at contact sites with autologous lymphocytes. These cells retained some features of monocytes, such as the ability to phagocytose large numbers of fixed yeast and fluorescent carboxylated microspheres and expression of surface CD14. These abnormalities, if reflected in vivo, could compromise antigen presentation and may be a fundamental defect in the mechanism of the antibody deficiency in a substantial subset of CVID patients.
Keywords: common variable immunodeficiency, dendritic cell, maturation, MHC class II DR, phagocytosis
Introduction
Common variable immunodeficiency (CVID) is a heterogeneous condition characterized by reduced serum concentrations of all antibody isotypes and susceptibility to recurrent respiratory and gastrointestinal infections [1]. Circulating B cells of the majority of CVID patients fail to produce immunoglobulin other than IgM in vitro [2] and have been found to lack several co-stimulatory molecules that contribute to antigen presentation [3]. Both in vitro and in vivo antigen-specific T cell responses are impaired in many patients, suggesting a failure of the cognate interaction between T cells and antigen-presenting cells [4,5].
Monocyte-derived dendritic cells (MdDCs) from some CVID patients display deficient major histocompatibility complex (MHC) class II DR expression, defective induction of T cell proliferation and abnormal cytokine production [6–8]. B cell antibody isotype switching is induced by dendritic cell signals, and interaction with follicular dendritic cells in germinal centres is central to the formation of plasma cells and specific T cell responses [9,10]. In this study we further define the nature of the defect in MdDC maturation.
Materials and methods
Patients
Following informed consent and approval of the local Ethics Committee, blood samples were obtained from 27 randomly selected patients (15 females, 12 males, mean age 34 years, range 21–65 years) attending the Royal Free clinic with a diagnosis of CVID using International Union of Immunological Societies (IUIS) criteria [11]. These patients have recently been screened for CVID-associated mutations in TACI [12], and two were found to be heterozygous for the C104R mutation. Twenty-two healthy adult volunteers provided blood for normal comparison.
Differentiation of MdDCs
MdDCs were generated from peripheral blood, as described previously [6]. The lipopolysaccharide (LPS) contamination of medium and reagents was below detectable limits using the limulus assay (Sigma, Poole, UK). LPS (Sigma L6529) was added to some cultures 24 h after plating, at concentrations of 100 pg−1 µg/ml as indicated. Maturation of cultured monocytes was initiated on day 6 by pipetting (20 cycles) and transfer of cells from six- to 96-well plates [13] with or without the addition of 25 ng/ml tumour necrosis factor (TNF)-α (Peprotec, London, UK) or LPS at 100 ng/ml. CD14+ cell-depleted peripheral blood mononuclear cells (PBMC) [magnetic activated cell sorting (MACS) bead system, Miltenyi Biotec, Bisley, UK] were washed and frozen in 10% dimethylsulphoxide (DMSO)/50% fetal bovine serum (FBS)/40% Xvivo15 (Cambrex BioScience, Nottingham, UK) at the beginning of the experiment; these cells were then thawed, incubated with LPS (100 ng/ml for 30 min) and replated with matured dendritic cells for examination by laser scanning confocal microscopy.
Phagocytosis
Saccharomyces cerevisiae was grown in 10% FBS/RPMI-1640 (Cambrex BioScience) overnight at 37°C, washed in RPMI-1640, fixed in Leukoperm (BUFO9B; Serotec, Oxford, UK) and stained with ethidium bromide (10 ng/ml; Sigma) for 10 min. Yeast were washed twice each in DMSO and phosphate-buffered saline (PBS) and resuspended in PBS at 1 × 10⁸/ml. Yeast and phycoerythrin (PE)-conjugated carboxylated beads (6 µm diameter; Molecular Probes, Eugene, OR, USA) were added to monocyte cultures on day 6 at 100 : 1 and 10 : 1 ratios. Attached unincorporated beads and yeast were removed prior to fluorescence activated cell sorter (FACS) analysis by treatment with 1% trypsin/PBS at 37°C for 15 min or cold DMSO [14] for 5 min. The removal of surface-attached particles was confirmed by confocal microscopy.
Confocal microscopy
Adherent PBMC or CD14+ column purified monocytes were cultured on 20 × 22 mm glass coverslips (0·1 mm thickness) for 6 or 7 days immersed in six-well plates in 3 ml of Xvivo15 supplemented with 10% FBS, 100 ng/ml granulocyte–macrophage colony-stimulating factor (GM-CSF) and 50 ng/ml interleukin (IL)-4. Cells were washed gently in 0·5 ml PBS three times, fixed in freshly made 1% paraformaldehyde/PBS overnight at 4°C, washed and permeabilized in 0·5 ml 0·01% saponin/PBS/1% mouse serum for 10 min at 4°C. Cells were washed and stained with mouse anti-human MHC class II DR fluorescein isothiocyanate (FITC) (0·1 µg/ml, Pharmingen, Oxford, UK) and 1 ng/ml propidium iodide in 0·5 ml 0·01% saponin/PBS/1% mouse serum for 30 min. The coverslips were then washed in 0·01% saponin/PBS and PBS, and mounted on glass slides in one drop of Dako (Cambridge, UK) fluorescent mountant. To examine internalization of MHC class II DR molecules, coverslips were washed at 4°C on day 6, or on day 7 after 24 h exposure to 100 ng/ml LPS or 25 ng/ml TNF-α, and stained with unconjugated mouse anti-human MHC class II DR (clone RF2D, a gift from Eira Rawlins) on ice for 15 min. Cells were washed with cold PBS/1% mouse serum and stained with AlexaFluor 546 conjugated goat anti-mouse IgG (1/100 000 dilution, 1 ng/ml, Molecular Probes, Eugene, OR, USA) for 5 min at 4°C and 10 or 30 min at 37°C. Cells were washed, fixed in fresh 2% paraformaldehyde (PFA)/PBS for 1 h and counterstained with FITC-conjugated cholera toxin (1 µg/ml; Calbiochem, San Diego, CA, USA) before washing and mounting. Confocal images were acquired on a Zeiss LSM 510 confocal microscope using Bio-Rad Lasersharp software (BioRad, Hemel Hempstead, UK). At least 50 cells from each of eight CVID and five healthy individuals were examined for internal and external localization of MHC class II DR in five separate experiments.
Flow cytometry
Cells were stained with antibody and washed twice with 200 µl of cold RPMI-1640/0·01% sodium azide centrifuged at 870 g for 5 min in 96-well plates at 50–100 000 cells per well. Murine FITC-conjugated anti-human antibodies to MHC II DR, CD83, CD14 (555560, 556855 and 555398, respectively; Pharmingen) or CD86 (MCA 119F; Serotec), a PE-conjugated anti-MHC class I DR, CD83 (347401 and 348237; Becton Dickinson Biosciences, Oxford, UK) or CD14 (FO844; Dako) antibody and Cy-Chrome conjugated antibody against CD40 (555590; Becton Dickinson Biociences) or human leucocyte antigen (HLA) class I ABC (555554; Pharmingen) were premixed in replica 96-well plates and applied to cells for 30 min. Control wells were stained with mouse isotype antibodies IgG1 FITC, IgG1 PE and IgG1 Cy-Chrome (345815, 345816 and 345817; Becton Dickinson), IgG2 FITC and PE (556577 and 554690; Pharmingen). Stained cells were washed twice, resuspended in 100 µl PBS and transferred to LP2 tubes (LK00023; Thermo Electron Corp., Basingstoke, UK) and analysed with a Becton Dickinson FACScan. A single set of FL1, FL2, FL3 and FL4 parameter settings for acquisition of dendritic cells, as well as culture densities and conditions, were rigidly maintained throughout the entire series of flow cytometry experiments.
Statistical analysis
Statistical analyses were performed using spss for Windows and Microsoft Excel. Levels of cytokines and numbers of cells expressing surface molecules were tested using an independent sample two-tailed t-test (assuming normal distribution of data), and also by the Mann–Whitney test for nonparametric data. Spearman’s rho was used to test for correlations. P-values < 0·05 were considered significant.
Results
Expression of differentiation and maturation surface molecules
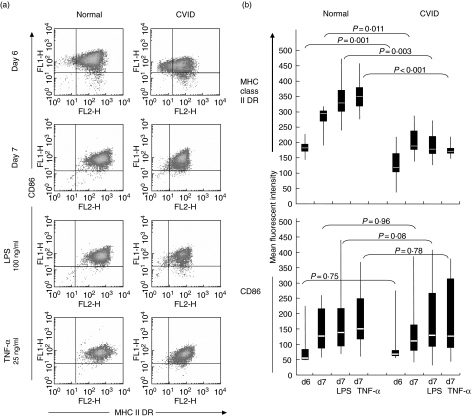
Expression of MHC class II DR on the surface of immature MdDCs was delayed in CVID patients compared to those of normal subjects. Whereas immature normal MdDC, cultured for 6 days, virtually all expressed CD86 and MHC class II DR molecules to high intensity, a substantial proportion of cells (12·3–41·6%, mean 19·7%) from CVID patients failed to express one or both molecules (Fig. 1a). Induction of MdDC maturation by repeated pipetting of cells on day 6 of culture increased DR expression on cells from all normal individuals, but cells from many CVID patients failed to increase DR expression, and overall expression was much lower than on normal cells on days 6 and 7 (Fig. 1a, b). Additional exposure to LPS or TNF-α at day 6 resulted in the increased expression of CD86 molecules on the majority of both normal and CVID cells on day 7 of culture (lower panels, Fig. 1a, b). However, MHC class II DR surface intensity on CVID cells was much reduced compared to normal cells following TNF-α or LPS treatment, and in some cases was less than pipetting alone (top panel, Fig. 1b). Mean fluorescent intensity of MHC class II DR significantly correlated with the MFI for CD86 from day 6 to day 7 (P = 0·05, 0·01 and 0·01 for pipetted, LPS treated and TNF-α treated cells, respectively) from normal subjects but were unassociated on CVID cells (P > 0·05 for all three treatments using Spearman’s rank order correlation).
Fig 1.
Expression of major histocompatibility complex (MHC) Class II DR and CD86 in healthy and common variable immunodeficiency (CVID) patients. (a) Co-expression of MHC class II DR and CD86 molecules on day 6 of culture, day 7 after pipetting, with lipopolysaccharide (LPS) (100 ng/ml) and tumour necrosis factor (TNF-α) (25 ng/ml) treatment of normal and CVID monocyte-derived dendritic cells measured by flow cytometry. Plots representative of 20 separate experiments. (b) Data displayed as median, complete range (vertical line) and 25–75% quartile ranges (box) of control (n = 21) and CVID (n = 22) of MHC class II and CD86 expression. P-values comparing sample means were generated by t-test. The Mann–Whitney nonparametric test confirmed the significance levels for all comparisons of DR expression and the lack of significance for the CD86 comparisons.
On day 7, CVID MdDCs retained a proportion of cells with low expression of MHC class II DR after pipetting on day 6, and treatment with LPS or TNF-α reduced the mean DR expression relative to pipetting alone (191 ± 1721 and 171 ± 426 versus 206 ± 2958, respectively) (Fig. 1b). The mean intensity of expression of DR in CVID MdDC differed from normal immature (P = 0·01), pipetted (P = 0·001), LPS (P = 0·03) and TNF-α-treated (P < 0·01) MdDC, whereas CD86 expression was not significantly different (P = 0·08) between immature, pipetted and treated normal and CVID MdDC.
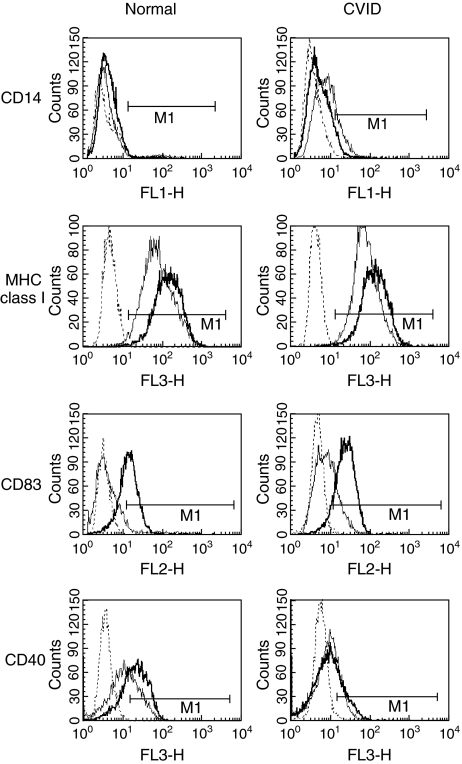
Expression of MHC class I (ABC), CD83, CD14 and CD40 on immature (day 6) cells from normal and CVID individuals is overlayed in Fig. 2, showing intensity of expression after treatment with LPS and TNF-α. MHC class I intensity of expression was high in both normal and CVID cells, and increased marginally with treatment in both groups. CD83 was usually detected on a higher proportion (mean expression 6·4% ± 5·1%) of untreated CVID cells (n = 21), as opposed to 2·3% ± 0·91% mean expression in normal cells (n = 20), but was elevated equivalently after LPS and TNF-α treatment. There was no difference in CD40 expression on immature DCs from normal or CVID patients, but CD40 was consistently lower in the CVID cells after LPS and TNF-α treatment. Mean CD40 expression of 19 CVID LPS-treated MdMC samples was 28·4 ± 12·3% compared with 67·8 ± 22·2% of 20 normal samples (P < 0·01), and TNF-α-treated mean CVID CD40 expression was 24·6 ± 18·9% compared with 72·4 ± 16·3% in normal individuals (P = 0·02). Residual CD14 was retained on a higher proportion of immature CVID cells at day 6 (range 0·2–17·2%, mean 7·3%versus 0·1–4·3% range, mean 1·1% normal expression, P = 0·02) but was mainly absent from mature pipetted and LPS/TNF-α-treated CVID and normal cells.
Fig 2.
Change in expression with maturation of normal and common variable immunodeficiency (CVID) dendritic cells. Expression of CD14, major histocompatibility complex (MHC) class I (ABC), CD83 and CD40 in normal and CVID individuals on day 7 without treatment (thin line) overlayed with plots of lipoloysaccharide (LPS) treated cells (thick line). Dotted histograms represent staining with isotype matched control antibody. Data representative of 18 separate experiments.
Effect of LPS on DC maturation
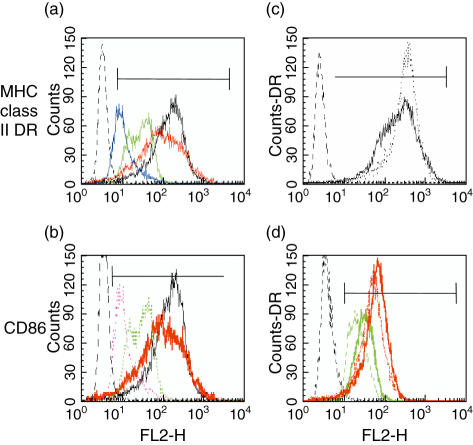
LPS added prior to day 3 of culture of PBMCs or CD14+ cells prevented maturation of MdDC from normal subjects (Fig. 3). Some of the phenotypic effects observed for surface molecules on CVID cells were mimicked by LPS exposure. Concentrations of LPS, 100 ng−1 µg, present as a 24-h pulse or continuously from day 1 of culture, restricted cell size and the development of surface dendrites, limited MHC class I (ABC) and class II DR, and CD86 less extensively (Fig. 3a, b), but had no effect on CD83 expression. Moreover, contrary to the normal increase in expression of DR by immature normal MdDC to first LPS exposure on day 6 (Fig. 3c), both DR and Class I ABC molecules were reduced further with subsequent re-exposure to LPS at day 6 of culture (Fig. 3d). A similar restriction in the development of surface MHC intensity with 100 ng/ml or more of LPS was observed in cultured CVID cells (data not shown). Effects of LPS exposure on surface DR expression were reduced below 100 ng/ml with no effect at picomolar concentrations.
Fig 3.
Effect of lipopolysaccharide (LPS) on the maturation of normal dendritic cells. Expression of major histocompatibility complex (MHC) class II DR and CD86 in normal monocyte-derived dendritic cells (MdDC). (a,b) Cultured without LPS (black) or with the addition of 1 µg/ml (blue/dotted purple), 100 ng/ml (green) or 10 ng/ml LPS (red) applied for 24 h on day 2 of culture; (c) DR after addition of LPS on day 6 (dotted line) to untreated cells (black); (d) DR after the re-addition (dotted lines) of LPS on day 6 to cells cultured with (solid lines) 1 µg/ml (green) or 100 ng/ml LPS (red) applied for 24 h on day 2 of culture. Dotted histogram on left is isotype control. Plots representative of four experiments.
Confocal microscopy
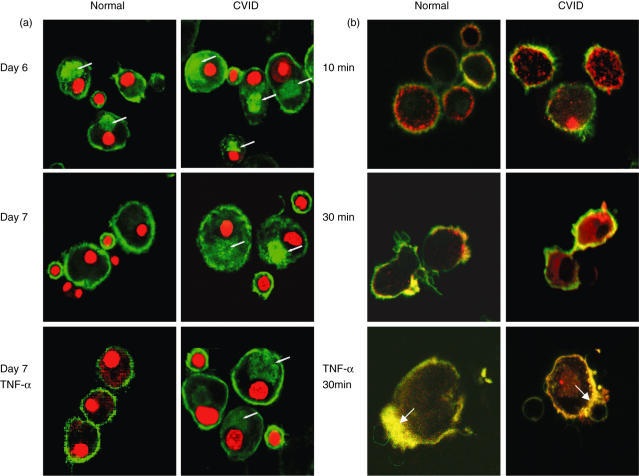
MHC class II molecules in CD19+ B cells present in the culture of adherent monocytes was restricted to the surface, whereas internal MHC class II could be detected in immature MdDC of both normal and CVID individuals (Fig. 4a, upper panels). Internal MHC class II structures, however, were frequently larger and more intensely stained in immature CVID MdDC, whereas surface expression of MHC was generally more intense in normal immature and treated normal MdDC. The majority of mature untreated normal MdDC, as well as those normal cells treated with TNF-α and LPS (not shown), demonstrated largely depleted internal MHC class II DR molecules. In contrast, most CVID cells cultured for 7 days (middle panel) still retained a considerable proportion of MHC (10–40% of total intensity) in the cytoplasm. Treatment of CVID MdDCs with LPS or TNF-α did not prevent the majority of cells exhibiting detectable internal MHC class II structures (lower panel).
Fig 4.
Confocal microscopy imaging of major histocompatibility complex (MHC) Class II DR expression in normal and common variable immunodeficiency (CVID) dendritic cells. (a) Normal and CVID dendritic cells on days 6 and 7 of culture without treatment and 24 h after tumour necrosis factor (TNF-α) stimulation, and incubated with lipopolysaccharide (LPS)-treated CD14+ depleted peripheral blood mononuclear cells (PBMCs), were fixed, permeabilized and stained with anti-MHC class II DR fluorescein isothiocyanate (FITC)-conjugated antibody and propidium iodide. Transverse plane images show external and internal (arrow) stores of MHC molecules (green) before and after maturation. Data representative of eight separate experiments. (b) Internalization of cross-linked MHC class II DR antibody after 10 and 30 min in mature and in TNF-α-treated dendritic cells (30 min). Live cells were incubated with unconjugated mouse antibodies to MHC class II DR on ice and cross-linked with goat anti-mouse Alexifluor 586-conjugated antibodies (red) at 37°C. Cells were subsequently fixed and stained with FITC-conjugated cholera toxin (green). Coincidence of MHC class II DR and GM1 proteins is seen as yellow, accumulating at contact points (arrow) between monocyte-derived dendritic cells (MdDC) and LPS-treated lymphocytes. Cells representative of five experiments.
In non-fixed cells surface movement of molecules was present in both normal and CVID immature dendritic cells (Fig. 4b, upper panels). Cholera toxin, which binds to GM1 and co-localizes with the immunological synapse, showed intense focal accumulation of surface MHC class II molecules in mature normal cells (middle panel), accentuated by TNF-α treatment (lower panel). Focal accumulation of MHC and overlap with cholera toxin at contact points of MdDC with lymphocytes was much less evident in mature CVID cells and co-localization was not greatly increased by TNF-α treatment seen in normal MdDCs (Fig. 4b, lower panels, indicated by arrows). Internalization of MHC class II molecules at 10 and 30 min was more advanced in the majority of CVID cells. Internalization was completely abrogated in normal cells by TNF-α treatment, whereas internalization of cross-linked CVID MHC class II molecules persisted in LPS-treated CVID cells.
Phagocytic capacity
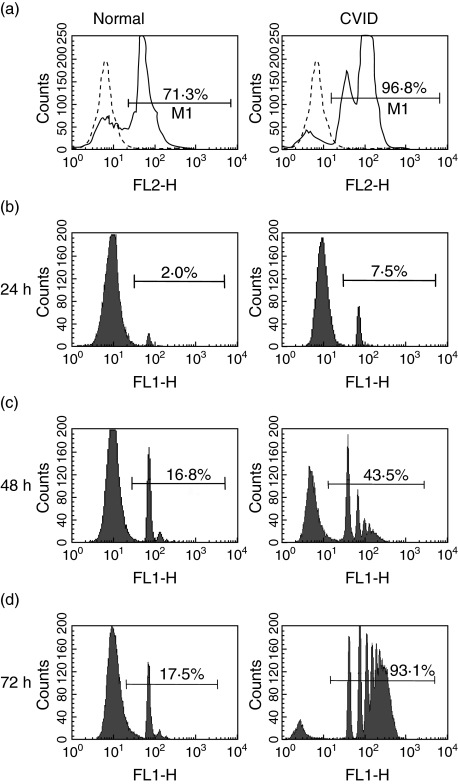
Incorporation of yeast following a pulse of limited duration generated a two- to threefold increase in intensity of internalized fluorescence yeast in CVID cells (mean fluorescent intensity n = 8; 89·6 ± 47) relative to normal immature dendritic cells (MFI n = 8; 38·5 ± 27). Whereas normal MdDC phagocytosed microparticles slowly and reached a plateau after 48 h, with few cells incorporating more than 3 microparticles, uptake by CVID MdDC was progressive, with most cells incorporating more than 5 microparticles after 3 days (Fig. 5). Immature CVID MdDC demonstrated a 3·5-fold difference in the initial bead uptake in 24 h and greater than fivefold accumulation of microparticles in 3 days (Table 1). Unlike normal cells, TNF-α treatment of CVID dendritic cells did not inhibit the uptake of carboxylated beads.
Fig 5.
Phagocytosis in normal and common variable immunodeficiency (CVID) dendritic cells. Purified normal and CVID monocytes, cultured for 6 days, incubated with (a) fixed ethidium bromide stained yeast in 1 : 10 ratio for 30 min, prior to washing and analysis by flow cytometry after 24 h; (b,c,d) fluoresceinated carboxylated microparticles in a 1 : 10 ratio for 1, 2 and 3 days before washing and flow cytometry. Each peak represents an increase in the number of internalized microparticles. Data representive of 12 experiments.
Table 1.
Incorporation of carboxylated microparticles in normal and common variable immunodeficiency (CVID) monocyte-derived dendritic cells (MdDC).
| Time | Normal MdDC n = 11 | CVID MdDC n = 12 | |
|---|---|---|---|
| Untreated MdDC | 24 h | 5·6 ± 4·4 | 16·1 ± 8·2 |
| 48 h | 16·1 ± 8·2 | 41·6 ± 21·2* | |
| 72 h | 19·3 ± 12·6 | 83·6 ± 15·5** | |
| TNF-α-treated MdDC | 48 h | 3·1 ± 1·6 | 17·8 ± 6·7** |
P < 0·05
P < 0·01. TNF: tumour necrosis factor.
Discussion
The acquisition of surface MHC class II DR is delayed in cultured CVID monocytes compared to cells from normal individuals, and remains lower after exposure to maturation stimuli. Furthermore, conventional dendritic cell maturation signals did not induce complete export of internal MHC class II molecules to the plasma membranes of CVID cells, as occurred with normal cells. Additionally, stimulated CVID MdDCs showed a high level of internalization of surface molecules, a process that was greatly reduced in immature normal MdDCs and virtually absent in mature and stimulated normal MdDCs. Further evidence of disordered CVID MdDC maturation was shown by the observation that physical manipulation of immature cultured monocytes, a moderate dendritic cell maturation stimulus [13], increased surface expression of class II MHC molecules on most CVID cells to a greater degree than LPS and TNF-α treatment.
Exposure to LPS in early monocyte culture blocks DC differentiation in vitro and in mouse models [14,15]. Despite receiving regular immunoglobulin that should contain some IgG antibodies to LPS, CVID patients may be exposed to high circulating concentrations of bacterial LPS because of inadequate amounts of neutralizing antibodies. However, the addition of LPS had a wider effect on DC maturation with a reduction in the surface expression of both HLA Class 1 and Class II molecules and CD86. This suggests that pre-exposure to LPS in vivo is not likely to be a factor in compromising the ability of monocytes to develop into DCs in vitro.
CD40 expression was poorly up-regulated by stimulation, as observed previously [7], and CD14, a molecule usually completely lost in the transition from monocytes to DCs, was retained in many of the cells from CVID patients. Although ingestion of carboxylated microspheres does not itself induce dendritic cell maturation [16], MdDC from healthy individuals reached a limit within 48 h while CVID MdDC accumulated microspheres progressively. TNF-α and LPS-treated CVID MdDC continued to ingest microspheres, indicating further a reduced ability to respond to maturation stimuli.
Confocal microscopy showed that conventional stimuli do not induce complete export of MHC Class II molecules to the surface of MdDCs from many CVID patients. Upon activation of normal dendritic cells, peptide-loaded MHC II molecules are transported from multi-laminate late endosomal and lysosomal compartments [17,18] to the cell surface via specialized tubulin extensions [19]. Loaded MHC molecules are then distributed in lipid raft microdomains to form the immunological synapse between T cells and antigen-presenting cells [20,21], the correct formation of which is fundamental to the generation of specific immune responses. Whereas the development of normal antigen presenting/T cell contact for less than 30 min allows normal immune synapse formation, complete segregation of MHC to focal points did not occur in CVID MdDCs. Lipid rafts, indicated by the co-aggregation of MHC molecules and cholera toxin-bound GM1, congregated rapidly in the contact area between normal MdDCs and lymphocytes, and was enhanced by the addition of TNF-α or LPS. However, these changes were poorly developed in MdDCs from CVID patients and would compromise antigen presentation if mirrored in vivo.
An important question is whether the MdDC abnormalities described above are the main cause of the immunodeficiency or are a co-factor for the development of CVID in a substantial subset of patients. The latter is supported by the finding of MdDC abnormalities in two patients who are heterozygous for mutations in the gene coding for TACI [12], a ligand involved in B cell differentiation and immunoglobulin class switching in the germinal centre. There is great variability in the severity of the clinical phenotype in patients who are either homozygous or heterozygous for these mutations, suggesting that environmental and/or genetic co-factors are important. The defect in MdDC function described here could be such a co-factor by compromising antigen presentation and consequently reducing T cell help for B cell maturation.
Acknowledgments
We thank Sister Cilla Freud and Royal Free Hospital Cockayne ward staff for assistance with patient samples and Richard Morris (UCL Primary Care and Population Sciences) for statistical advice. The work was part funded by a European Union grant (IMPAD-QLRT-2001-01536).
References
- 1.Hammarstrom L, Vorechovsky I, Webster D. Selective IgA deficiency (SIgAD) and common variable immunodeficiency (CVID) Clin Exp Immunol. 2000;120:225–31. doi: 10.1046/j.1365-2249.2000.01131.x. [DOI] [PMC free article] [PubMed] [Google Scholar]
- 2.Bryant A, Calver NC, Toubi E, Webster AD, Farrant J. Classification of patients with common variable immunodeficiency by B cell secretion of IgM and IgG in response to anti-IgM and interleukin-2. Clin Immunol Immunopathol. 1990;56:239–48. doi: 10.1016/0090-1229(90)90145-g. [DOI] [PubMed] [Google Scholar]
- 3.Groth C, Drager R, Warnatz K, et al. Deficit in up-regulation of CD86 in CVID B cells. Clin Exp Immunol. 2002;129:133–9. doi: 10.1046/j.1365-2249.2002.01883.x. [DOI] [PMC free article] [PubMed] [Google Scholar]
- 4.Kondratenko I, Amlot PL, Webster AD, Farrant J. Lack of specific antibody response in common variable immunodeficiency (CVID) associated with failure in production of antigen-specific memory T cells. Clin Exp Immunol. 1997;108:9–13. doi: 10.1046/j.1365-2249.1997.d01-993.x. [DOI] [PMC free article] [PubMed] [Google Scholar]
- 5.Stagg AJ, Funauchi M, Knight SC, Webster AD, Farrant J. Failure in antigen responses by T cells from patients with common variable immunodeficiency (CVID) Clin Exp Immunol. 1994;96:48–53. doi: 10.1111/j.1365-2249.1994.tb06228.x. [DOI] [PMC free article] [PubMed] [Google Scholar]
- 6.Scott-Taylor TH, Green MR, Eren E, Webster AD. Monocyte derived dendritic cell responses in common variable immunodeficiency. Clin Exp Immunol. 2004;138:484–90. doi: 10.1111/j.1365-2249.2004.02640.x. [DOI] [PMC free article] [PubMed] [Google Scholar]
- 7.Bayry J, Lacroix-Desmazes S, Kazatchkine MD, et al. Common variable immunodeficiency is associated with defective functions of dendritic cells. Blood. 2004;104:2441–3. doi: 10.1182/blood-2004-04-1325. [DOI] [PubMed] [Google Scholar]
- 8.Cunningham-Rundles C, Radigan L. Deficient IL-12 and dendritic cell function in common variable immune deficiency. Clin Immunol. 2005;115:147–53. doi: 10.1016/j.clim.2004.12.007. [DOI] [PubMed] [Google Scholar]
- 9.Kosco-Vilbois MH, Scheidegger D. Follicular dendritic cells: antigen retention, B cell activation, and cytokine production. Curr Top Microbiol Immunol. 1995;201:69–82. doi: 10.1007/978-3-642-79603-6_4. [DOI] [PubMed] [Google Scholar]
- 10.Tew JG, Wu J, Qin D, Helm S, Burton GF, Szakal AK. Follicular dendritic cells and presentation of antigen and costimulatory signals to B cells. Immunol Rev. 1997;156:39–52. doi: 10.1111/j.1600-065x.1997.tb00957.x. [DOI] [PubMed] [Google Scholar]
- 11.Conley ME, Notarangelo LD, Etzioni A. Diagnostic criteria for primary immunodeficiencies. Clin Immunol. 1999;93:190–7. doi: 10.1006/clim.1999.4799. [DOI] [PubMed] [Google Scholar]
- 12.Salzer UHM, Chapel ADB, Webster ADB, et al. Mutations in TNFRSF13B, which encodes TACI, are associated with common variable immunodeficiency in humans. Nat Genet. 2005;37:793–4. doi: 10.1038/ng1600. [DOI] [PubMed] [Google Scholar]
- 13.Gallucci S, Lolkema M, Matzinger P. Natural adjuvants: endogenous activators of dendritic cells. Nat Med. 1999;5:1249–55. doi: 10.1038/15200. [DOI] [PubMed] [Google Scholar]
- 14.Palucka KA, Taquet N, Sanchez-Chapuis F, Gluckman JC. Lipopolysaccharide can block the potential of monocytes to differentiate into dendritic cells. J Leukoc Biol. 1999;65:232–40. doi: 10.1002/jlb.65.2.232. [DOI] [PubMed] [Google Scholar]
- 15.Rotta G, Edwards EW, Sangaletti S, et al. Lipopolysaccharide or whole bacteria block the conversion of inflammatory monocytes into dendritic cells in vivo. J Exp Med. 2003;198:1253–63. doi: 10.1084/jem.20030335. [DOI] [PMC free article] [PubMed] [Google Scholar]
- 16.Waeckerle-Men Y, Scandella E, Uetz-Von Allmen E, et al. Phenotype and functional analysis of human monocyte-derived dendritic cells loaded with biodegradable poly(lactide-co-glycolide) microspheres for immunotherapy. J Immunol Meth. 2004;287:109–24. doi: 10.1016/j.jim.2004.01.010. [DOI] [PubMed] [Google Scholar]
- 17.Kleijmeer M, Ramm G, Schuurhuis D, et al. Reorganization of multivesicular bodies regulates MHC class II antigen presentation by dendritic cells. J Cell Biol. 2001;155:53–63. doi: 10.1083/jcb.200103071. [DOI] [PMC free article] [PubMed] [Google Scholar]
- 18.Geuze HJ. The role of endosomes and lysosomes in MHC class II functioning. Immunol Today. 1998;19:282–7. doi: 10.1016/s0167-5699(98)01269-9. [DOI] [PubMed] [Google Scholar]
- 19.Barois N, de Saint-Vis B, Lebecque S, Geuze HJ, Kleijmeer MJ. MHC class II compartments in human dendritic cells undergo profound structural changes upon activation. Traffic. 2002;3:894–905. doi: 10.1034/j.1600-0854.2002.31205.x. [DOI] [PubMed] [Google Scholar]
- 20.Harder T, Simons K. Clusters of glycolipid and glycosylphosphatidylinositol-anchored proteins in lymphoid cells: accumulation of actin regulated by local tyrosine phosphorylation. Eur J Immunol. 1999;29:556–62. doi: 10.1002/(SICI)1521-4141(199902)29:02<556::AID-IMMU556>3.0.CO;2-2. [DOI] [PubMed] [Google Scholar]
- 21.Al-Alwan MM, Liwski RS, Haeryfar SM, et al. Cutting edge: dendritic cell actin cytoskeletal polarization during immunological synapse formation is highly antigen-dependent. J Immunol. 2003;171:4479–83. doi: 10.4049/jimmunol.171.9.4479. [DOI] [PubMed] [Google Scholar]


