Abstract
Purpose
To study electrically elicited responses (EERs) that are produced by epiretinal stimulation of normal and degenerated retina.
Methods
Three biological models of retinal degeneration are compared: normal and rd1 mouse, normal and RCD1 dog, and human with retinitis pigmentosa. In mouse, epiretinal stimulation was accomplished by means of a wire inserted in the vitreous cavity, and single-unit activity was recorded in visual cortex. In dog and human, an implantable retinal stimulator was used to stimulate the retina, and evoked potentials were recorded from the cortical surface (dog) or scalp (human).
Results
Analysis of EERs revealed distinct early (less than 10 ms) and late (greater than 50 ms) responses. Synaptic blockers abolished the late response but not the early response. For eliciting the early response in normal and rd mice, a square pulse stimulus was more efficient than the sine wave or pulse train. In normal and degenerate canine retina, electrically elicited responses also exhibited early and late phases. EERs in a retinal prosthesis test subject (with retinitis pigmentosa) showed latency similar to the canine, but no evidence of an early response, possibly due to the lack of sensitivity in scalp (human) vs cortical surface (canine) electrode placement.
Conclusion
EERs could be elicited from both normal and degenerated retina. Mouse, dog, and human EERs showed common characteristics.
INTRODUCTION
The aim of the study was to demonstrate the occurrence of visual cortical activity in response to electrical stimulation of the normal and degenerate retina. Although studies of electrically elicited cortical activity have already been performed in normal animals, few studies have been conducted in animals with degenerated retina that may constitute models of human retinal diseases (retinitis pigmentosa).1 Previous studies have used isolated retina to investigate properties of the retinal response to varying types of electrical stimulation.2–5 These experiments have demonstrated that retinal ganglion cell responses can be elicited with electrical current limits considered safe for long-term stimulation. In addition, a clinical trial of a prototype implant in six test subjects has demonstrated the potential of an operational intraocular prosthesis.6,7 The test subjects who have, at best, light perception vision in the implanted eye can use the implant to detect motion and identify objects from a set. Although these results are encouraging for developing a retinal prosthesis that can provide a useful level of vision, it is important to explore parameters influencing the visual cortical evoked responses from electrical stimulation of the retina, because cortical activity will correlate better with psychophysical results.
Electrical evoked responses (EERs) of the visual system in response to transcorneal electrical stimulation have shed light on the understandings of the visual system. Experiments in artificial retinal degeneration rabbit model8–10 and humans11 indicated that the site activated by electrical stimulation in the retina is more proximal than the photoreceptors. Shimazu and associates12 suggested that ON bipolar cells are stimulated during the delivery of transcorneal electrical stimuli in normal cat. Studies of intraretinal stimulation in normal cats13 showed that the visual cortex could be activated by 30 to 100 μA single monophasic square pulse. An epiretinal stimulation study in rabbit demonstrated 10 μA threshold with pulse train stimulation.14 The purpose of this study was to explore EER in retinal degeneration and normal retina to epiretinal electrical stimulation.
METHODS
Experiments were conducted in a human with retinitis pigmentosa and in two animal models of retinal degeneration. Methods that are available in other publications are referenced when possible here. All animal procedures complied with the Association for Research in Vision and Ophthalmology statement for the use of animals in ophthalmic and vision research. All human research was approved by the University of Southern California Institutional Review Board, adhered to the Declaration of Helsinki, and was conducted as part of an Investigational Device Exemption clinical trial, approved by the Food and Drug Administration, and sponsored by Second Sight Medical Products, Inc.
MOUSE SURGERY AND EXPERIMENTAL METHOD
A total of 30 normal C57B7L/6J (Jackson Laboratory, Bar Harbor, Maine) mice (6 to 32 weeks old) and 22 retinal degenerated (rd) C3H (Jackson Laboratory) mice (6 to 8 weeks old) were used in this study. Six weeks after birth, rd mice undergo near-total vision loss. Mice were anesthetized with an initial 0.3 to 0.4 mL intraperitoneal injection of 10% urethane (Sigma-Aldrich, St Louis, Missouri, 4 mL/kg) and supplementary 0.1-mL doses if needed. Body temperature was monitored and maintained at 37.0°C with a heating pad. The mouse was then placed in a custom-built head holder to maintain the head in a fixed position and to allow access to the eye and head. A craniotomy was performed to expose a 4 × 4-mm area of the posterior cortex contralateral to the test eye. The pupil of the test eye was dilated with 2.5% phenylephrine hydrochloride and 1% tropicamide. A small incision just anterior to the limbus was made with a 23-gauge needle followed by injection of sodium hyaluronate (Healon GV, Pharmacia Columbus, Ohio) to tamponade the anterior chamber. The cornea button was then removed with scissors. A bent 31-gauge needle was inserted underneath the iris plane into the retrolental space, and additional sodium hyaluronate was injected into the vitreous cavity to expel the lens.
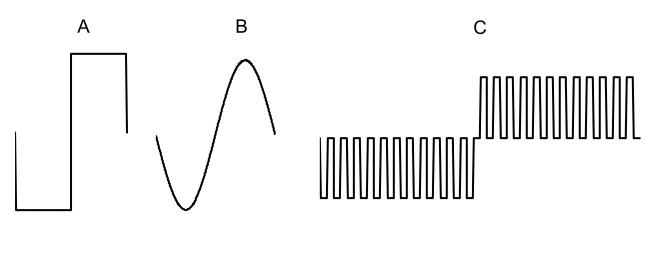
Light responses were obtained by illumination of the eye with 1,000-lumen xenon light source (model 201, ILC Technology, Sunnyvale, California), coupled to a fiber optic light probe. A computer-controlled shutter (Uniblitz T132, Vincent Associates, Rochester, New York) controlled the timing of light stimulation. A 125-μm-diameter platinum wire stimulating electrode, attached to a micromanipulator, was inserted into the vitreous cavity and positioned on the retinal surface. A return needle electrode was inserted subcutaneously in the back. Three types of stimulus pulses were used: a single biphasic pulse, 0.5 milliseconds (ms) per phase; a single cycle of 1-kHz sine wave; or a train of 12 monophasic pulses, 40 μs/phase with a 40-μs interpulse delay followed by 12 pulses of opposite polarity but identical timing. All pulses were charge balanced, biphasic, cathodic-first waveforms with duration of 0.48 to 0.5 ms of cathodic current (Figure 1).
FIGURE 1.
Diagram of stimulating current pulses used in mouse study. A, Square waveform is composed of a cathodic current pulse and a second anodic current pulse that balances the cathodic phase. There is no interphase delay between these two pulses. The total stimulation width is 1 ms. B, Sine waveform also has cathodic first current and 1 ms of stimulation. C, Pulse train waveform consists of 12 cathodic phases followed by another 12 anodic phases with interphase delay in between them. Each stimulus phase and interphase delay is 40 μs, and the total stimulation time is 0.96 ms (0.48 ms cathodic and 0.48 ms anodic) and delay time is 0.96 ms.
Bipolar tungsten double epoxy electrodes (A-M systems, Everett, Washington) with an impedance of 1 to 3 megaOhm at 1 kHz were used for intracortical recording. The recording electrodes were inserted 2.5 to 3 mm lateral to the lambda (intersection between occipital and temporal sutures). Recording ground needle electrode was placed subcutaneously behind the ear. Cortical action potentials were band-pass filtered (0.3 to 3 kHz), amplified (gain = 20,000), then digitized by a commercial electrophysiology test system (ACDaq, AC Instrumentation, Seattle, Washington). Stimulus threshold was defined as a cortical response, in a consistent location, in at least four of five consecutive records. A response was defined as twice the baseline noise.
After recording light and electrical threshold response in the normal mouse, continuous intravitreal infusion of 10 mM of cadmium chloride (CdCl2) was used to block the intraretinal synapses. Due to the fact that the vitreous cavity was filled with sodium hyaluronate, 1 cc of CdCl2 was delivered in four or five serial doses. Once the light response was no longer recordable, the electrically elicited response was recorded.
CANINE PREPARATION AND EER
Canines (two normal, two RCD115) were implanted with prototype retinal stimulators as described previously.16 Briefly, the stimulator had a 4 × 4 grid of platinum, disk electrodes (held in a silicone rubber substrate) attached to the epiretinal surface with a single retinal tack. Each electrode was 500 μm in diameter with 250 μm between the edges of the disks. The stimulator microelectronics were in a hermetic case outside the eye, but under the skin. For EER testing, an electrode was implanted on the surface of the occipital cortex, similar to descriptions in previous reports.17 In the experiments reported here, because both the stimulator and recording electrodes were implanted and could be accessed by either wireless link (stimulator) or percutaneous wire (recording), the animal did not require anesthesia for the test. Stimulation was controlled by a custom software system that programmed the implant. Data acquisition was accomplished by means of a Datawave recording system (Datawave Technologies, Inc) synchronized to the stimulus. The stimulus consisted of eight of 16 electrodes activated simultaneously (due to a limitation of the stimulator). The pulse rate was 1 pulse/second. All active electrodes used a biphasic pulse (1 ms cathodic, 1 ms delay, 1 ms anodic) with a maximum amplitude of 180 μA. The amplitude was limited because the main purpose of the experiment was to assess safety of stimulation up to 180 μA, and increasing above 180 μA would confound the results.16
HUMAN TESTING
Informed consent was obtained from a 74-year-old man with X-linked retinitis pigmentosa. A prototype retinal stimulator was implanted in the eye with worse bright flash perception thresholds. This eye had no light perception. Psychophysical testing of this individual has been reported previously.6,7 EER testing employed a custom software system, similar to that used in the canine research, to control the stimulator. Single-channel recordings were done with a standard VEP recording electrode configuration and with a Nicolet electroretinography system synchronized to the stimulator. Gold disk scalp electrodes were used to record signals. The test subject was lying down during testing and was asked not move his head or to speak to minimize muscle artifact in the recordings. Eight stimulating electrodes with the lowest perception thresholds were activated simultaneously at threshold plus 10%. Biphasic pulses were used on all electrodes (1 ms cathodic, 1 ms delay, 1 ms anodic). The pulse rate was 1 pulse/second.
RESULTS
Electrically elicited responses could be recorded from all normal and retinal degenerate models tested. The results for each will be presented and then compared in the discussion.
MOUSE EER
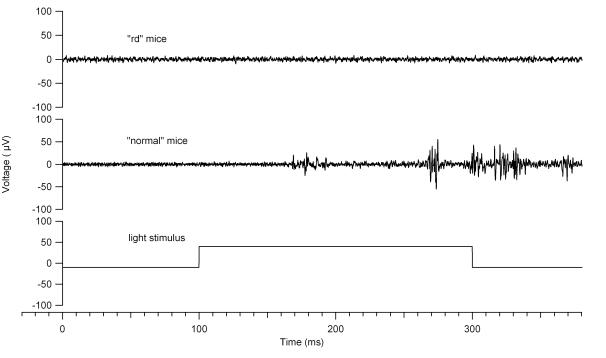
Three types of light evoked responses were identified during electrophysiological recording of the visual cortex of the normal mice: ON-OFF, ON, and OFF. Seventy-six percent were of an ON-OFF response with a mean ON-response latency of 79 ms (50 to 100 ms) after the onset of light stimulation. OFF-response latencies were more variable and averaged 197 ms (50 to 400 ms) after the termination of the light stimulus. Pure ON or OFF neuronal responses were recorded in 18% and 6% of the experiments, respectively. No light responses could be recorded from the rd mice (Figure 2).
FIGURE 2.
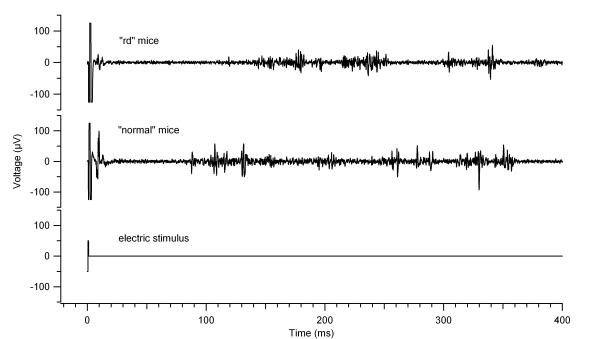
Light and electrical response in normal and retinal degenerate (rd) mice. The traces shown were repeatable over several trials. Top, Baseline recording (0 to 100 ms) demonstrates the rate of spontaneous activity. Light stimulation begins at 100 ms and ends at 300 ms. In the light response in normal mice, note that the latency of the ON response is 80 ms. No light response was noted in the rd mice. Bottom, The electrical stimulation starts at 0 ms and lasts for 1 ms. Note that the latency of the early response is 8 ms, whereas the late response is 87 ms. In rd mice, the early and late responses begin at 4 ms and 126 ms, respectively.
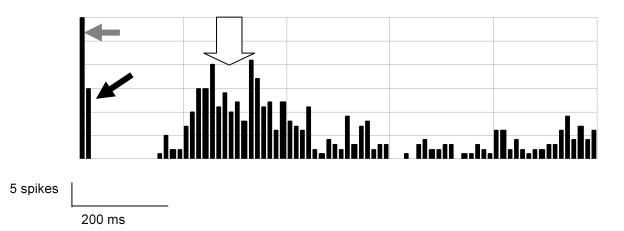
EER thresholds were obtained in 24 normal mice (after successfully recording a light response) and in 24 rd mice. In both normal and rd mice, EERs consistently showed two bursts of activity that were distinct and reproducible with respect to latency: an early response with a latency of less than 10 ms and a late response with an onset latency that was greater than 50 ms (Figure 3). Although the rd mice had no recordable light response in the primary visual cortex, the EER recorded from rd mice were very similar to the normal mice (Figure 2).
FIGURE 3.
Peristimulus histogram at 700-μA, 0.5-ms pulse, showing the early and late cortical spiking in an rd mouse. 10-ms bins are used, and 20 presentations were analyzed together. Grey arrow indicates stimulus artifact; black arrow, early response; white arrow, late response. After 600 ms, the activity returns to spontaneous rate.
Table 1 summarizes the stimulus threshold of different waveforms for early and late responses in both normal and rd mice. For eliciting the early response in normal mice, square waveform stimulus required less current and charge than the sine or pulse train waveform (P<.05). In rd mice, although the square waveform had the lowest threshold for the early response, the difference among the three waveforms was not significant (P = .136). For the late response, the square waveform had the lowest threshold in both normal and rd mice (P < .05).
TABLE 1.
RESPONSE THRESHOLD FOR NORMAL (N) AND RETINAL DEGENERATED (RD) MICE FOR THREE DIFFERENT STIMULUS WAVEFORMS
| N (24) MICE | RD (24) MICE | |||||
|---|---|---|---|---|---|---|
| CATEGORY | Early response, μA (20)* | Late response, μA (17)* | P value† | Early response, μA (17)* | Late response, μA (13)* | P value† |
| Square waveform | 203 ± 75‡ | 256 ± 166‡ | .943 | 468 ± 224 | 244 ± 100‡ | .001 |
| Sine waveform | 493 ± 155 | 492 ± 370 | .220 | 664 ± 327 | 450 ± 180 | .039 |
| Pulse train waveform | 672 ± 241 | 407 ± 117 | .028 | 667 ± 252 | 720 ± 164 | .708 |
| P value‡ | <.05 | <.05 | .136 | <.05 | ||
Number of experiments are shown in parantheses.
Mann-Whitney rank sum test.
One-way ANOVA rank test.
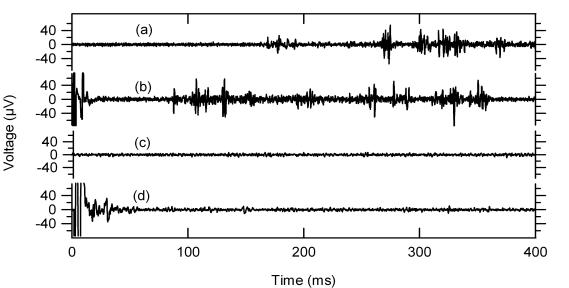
Vitreous infusion of CdCl2 blocked the light response and the late electrical response but not the early electrical response in normal mice (Figure 4). This was performed in five mice, and in all cases the late response was eliminated. The stimulus threshold for the early response was not affected by cadmium (Cd), and after its continuous infusion, the late response could not be elicited in any of the five experiments, even with increased stimulus current.
FIGURE 4.
Light and electrical elicited response (EER) in normal and degenerated mice. Traces (a) and (b) show normal response to light (a) and electrical (b) stimulation. Cadmium injection abolishes the light response (c), and the late phase of the EER (d), but not the early phase of the EER (d).
CANINE EER
Evoked potentials were obtained in normal and blind dogs (Figure 5). Eight stimulating electrodes were used in parallel (simultaneous stimulation) in order to evoke an adequate cortical signal. It was not possible to record the response from a single stimulating electrode, so threshold values were not measured. Both normal and blind dogs show evidence of a small early response, followed by a more robust late response. The normal dog response has shorter latencies than the blind dog response.
FIGURE 5.
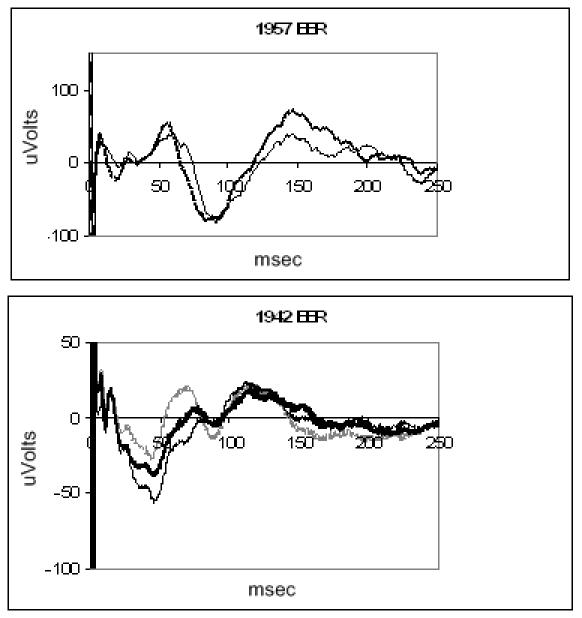
Electrically evoked response of blind canine (top) and normal canine (bottom) recorded with a subdural electrode. Each trace is the average of 100 presentations. The retina was stimulated through multiple electrodes.
HUMAN EER
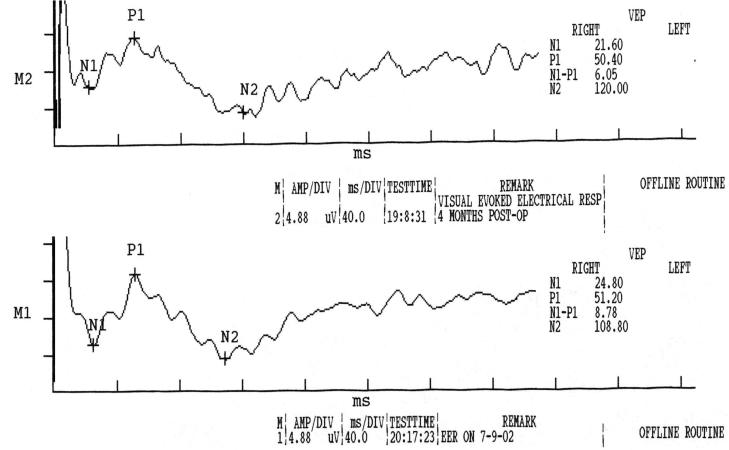
EERs were obtained from a blind human test subject on two occasions. One hundred stimuli were presented by means of the implanted stimulator and the waveforms averaged. The subject indicated that he saw light by holding up his hand, which he did the entire time during the testing. EERs were recorded 3 weeks apart and 4 to 5 months postimplantation (Figure 6). The records show a positive peak at 50 ms and a negative peak at 108 to 120 ms. Peak latencies are similar in the two records, but no clear evidence of distinct early responses is apparent.
FIGURE 6.
Electrically evoked response recorded with scalp electrodes from a single retinal prosthesis implant subject who is blind from retininitis pigmentosa. The traces were recorded 3 weeks apart. In both cases, eight electrodes were activated simultaneously to obtain an adequate signal. The average of 100 presentations is shown. Scale for both plots, 40 ms/div on x-axis, 4.88 μV/div on y-axis.
DISCUSSION
These experiments demonstrate that cortical potentials can be elicited with electrical stimulation in normal and degenerated retina in mouse, canine, and human models and that some similar characteristics were preserved across species. In mice, a number of stimuli were compared, whereas in canines and human, EER testing was limited in scope and sample size. In mice, for epiretinal stimulation, the biphasic square waveform was the most efficient in eliciting EER. In addition, two components of the EER were evident, namely, the early and the late responses. We speculate from the Cd data in mice that the origin of the early response is due to direct stimulation of the retinal ganglion cells or possibly displaced spiking amacrine cells. An electric current may excite nearby ganglion cell and/or more distant bipolar or photoreceptor cells.18
In a study that used isolated rabbit retina, electrical current applied to the epiretinal surface elicited action potentials in less than a millisecond, indicating direct activation of ganglion cells.19 However, spike pairs sometimes appeared a few milliseconds later, and these were attributed to transsynaptic mechanisms. Hence, epiretinal electric current can directly excite ganglion cells and elicit action potentials with short latency but can also excite the outer retina to elicit later responses.5, 20 The early component of the EER was smaller in canine, and the rate of spiking was less for the early response in mice. If human EER has an early response (which was not evident from the data presented), it may be difficult to record with scalp electrodes, which significantly attenuate cortical signals relative to electrodes that are directly contacting the cortex.17
The similarity of early and late responses in both normal and rd retina suggests that the stimulation of the photoreceptors does not contribute to the EER. The early response had a significantly lower threshold than the late response in the normal mice. This difference was not apparent in rd mouse. The early response threshold of the normal mice is significantly lower than the early response threshold of the rd mice, whereas the late response of normal and rd is similar. If the early response is attributed to direct ganglion cell stimulation, then the difference between normal and rd can be explained by the fact that the ganglion cell layer of rd mouse is degenerated, though not as severely as the photoreceptor outer segments. The bipolar layer is only slightly affected, and this can possibly explain the similarity between the late response threshold of normal and degenerated retina. Additionally, in canine the evoked potential latency was delayed in the RCD1 animal. Increased threshold and latency are consistent with electroretinography studies that show similar effects in diseased retina.21 The late response may be similar to the response to diffuse light stimulation, which activates a wide area of photoreceptors and excites the ganglion cells only after complex convergent connections within the retina.22
The latencies of the EERs in the human with retinitis pigmentosa and the RCD1 dog were remarkably similar. Both show a positive peak around 50 ms and a negative peak around 100 ms. This data is limited and needs a more comprehensive study, but these initial results suggest that the RCD1 dog is a good model not only for testing safety of stimulation, but also for retinal and cortical response measures. The genetic mutation in RCD1 is similar to a defect known to cause retinitis pigmentosa. The data in this study suggest that the subsequent response of the visual system to this defect is similar in canine and human.
PEER DISCUSSION
DR JOHN R. HECKENLIVELY
The authors report investigations of the electrically elicited response (EER) in normal and degenerated retinas. Their aim was to demonstrate that visual cortical brain activity can be detected in response to EER stimulation. They used animal models to investigate parameters of the response, including evaluating stimulus pulse characteristics that gave the best response. They previously determined that chronic electrical stimulation is safe in the long term. Their long term goal is to explore the use of electrical stimulation of the retina to bring vision to blind individuals.
The authors recorded ON- and OFF- responses in normal mice to use as a comparison for the EER response measurements. The rd mice did not show response to the light evoked testing. They then used the same mice with EER testing. In both normal and rd mice they found a similar early and late EER response at 10 and 50 milliseconds. They found that the light and late response in normal mice was blocked by a vitreous infusion of cadmium chloride, but the early response was not blocked. They conclude that similar cortical potentials can be elicited with electrical stimulation in normal and degeneration retina in mice, canine, and human, and some characteristics are preserved across species. The data suggests that the response is generated by the ganglion or possibly amacrine cells.
My main criticism of this paper is that the rationale for their experiments was not clearly laid out to orient the reader as to why they were doing these experiments, and how this work relates to their work on retinal prosthetics. They did not adequately explain the methodology that they are employing, including the rationale for the EER and what is known about the EER. There is an old body of literature on its use in complicated retinal detachment cases in the 1980’s. The use of a mass electrical stimulus to the retina is different from a focal one such as given by a retinal prosthesis, and this difference was not addressed in the paper. The use of cadmium chloride to block retinal synapses should be referenced and explained.
Yozo Miyake has investigated the EER over the last twenty years, first with Tatsuo Hirose in retinal detachment patients, and then with Watanabe looking at the retinal origins of the EER signals.1,2 He found electrical stimulation useful in clinical situations where there is a retinal detachment behind opaque media. He concluded that the test gave information on the optic nerve and status of the retinal circulation, which is known to nourish inner retina, mainly ganglion cells. In examining EERs in cats, Shimazu, Miyake, and Watanabe found the retinal ganglion cells and the ON-bipolar cells contributed to the cortical activity resulting from the corneal electrical stimulation.
Whether there is any relationship of the EER test to actual visual function has yet to be determined, though there was some evidence in the past when it was used as a prognostic tool to test patients with complicated retinal detachments. The results suggested that it was helpful in selecting cases where surgical intervention should be attempted.
This paper demonstrates that electrical stimulation of the retina generates recordable cortical activity in blind mice, dogs, and a human. However, much more work needs to be done to understand if electrical stimulation can be used to replace light stimuli in these unfortunate patients.
The authors are to be congratulated on taking on the challenge of developing a functional retinal prosthesis and for performing studies to better understand the usefulness of electrical stimulation in vision.
REFERENCES
- 1.Miyake Y, Hirose T, Hara A. Electrophysiological testing of visual functions for vitrectomy candidates. I. Results in eyes with known fundus diseases. Retina. 1983;3:86–94. doi: 10.1097/00006982-198300320-00003. [DOI] [PubMed] [Google Scholar]
- 2.Shimazu K, Miyake Y, Watanabe S. Retinal ganglion cell response properties in the transcorneal electrically evoked response of the visual system. Vision Res. 1999;39:2251–2260. doi: 10.1016/s0042-6989(98)00331-9. [DOI] [PubMed] [Google Scholar]
DR JOSE S. PULIDO
On the video that you showed, there was a continual movement of the light. How would that regulate via the implant, to allow for only those short pulses?
DR MARK S. HUMAYUN
I agree that we have not provided a clear rationale for our paper and that stems from the fact that some of this patient-related information is ongoing and proprietary. I was not able to then describe the extinction phenomena in the paper that Dr Heckenlively reviewed but I was better able to explain it in my presentation today.
There was a question about the EER and how the mass response may not, because you’re stimulating the whole eye, be indicative of a focal response when you have electrode array on the retina that is stimulating 200 microns. We believe that if we were just looking at the temporal dynamics of this response that the spatial characteristics would not affect the temporal characteristics of electrically elicited response. Our hypothesis was somewhat correct because it did help us solve this issue. Cadmium is not used very commonly in these sorts of experiments, although there are references that indicate that one millimolar Cadmium it’s a reversible synaptic blocker. 1
I agree that the EER relationship to visual function has never been proven. With that you are using EER to predict what light elicited visual response would be, but that is not what we are doing here. We are using the EER really to predict the relationship of how electronic vision would be. EER is electrically stimulated into the retina, and the electrical device is electrically stimulating. The whole concept of whether the EER is useful for light stimulation is controversial in the literature, but in terms of EER’s relevance to electrical stimulation of the retina, I think there is some use.2
Dr. Pulido notes that this bar is moving across very quickly and asks how set the parameters on each electrode in real time? What I did not show is that there is a pocket worn pager size device that actually in real time shortens the pulse width. We can dial in and set each electrode to the parameter we want, and then we could test the subject in an environment, and then re-program each electrode. It is much like a cochlear implant. 3 There is a fitting protocol that we go through for each electrode. We pre-set it on this little pager-size device, the subjects come in every week or two weeks, and we are able to tweak each electrode in each parameter.
REFERENCES
- 1.Atchison WD. Effects of neurotoxicants on synaptic transmission: lessons learned from electrophysiological studies. Neurotoxicol Teratol. 1988;10:393–416. doi: 10.1016/0892-0362(88)90001-3. [DOI] [PubMed] [Google Scholar]
- 2.Yanai D, Lakhanpal RR, Weiland JD, et al. The Value of Preoperative Tests in the Selection of Blind Patients for a Permanent Microelectronic Implant. Trans Am Ophthalmol Soc. 2003;101:223–228. [PMC free article] [PubMed] [Google Scholar]
- 3.Wilson BS, Schatzer R, Lopez-Poveda EA, Sun X, Lawson DT, Wolford RD. Two new directions in speech processor design for cochlear implants. Ear Hear. 2005;26:73S–81S. doi: 10.1097/00003446-200508001-00009. [DOI] [PubMed] [Google Scholar]
REFERENCES
- 1.Heckenlively JR, Boughman J, Friedman L. Diagnosis and classification of retinitis pigmentosa. In: Retinitis Pigmentosa Philadelphia: Lippincott; 1988.
- 2.Grumet AE, Wyatt JL, Rizzo JF. Multi-electrode stimulation and recording in the isolated retina. J Neurosci Methods. 2000;101:31–37. doi: 10.1016/s0165-0270(00)00246-6. [DOI] [PubMed] [Google Scholar]
- 3.Shyu JS, Maia M, Weiland JD, et al. Electrical stimulation of isolated rabbit retina. IEEE Trans Neural Syst Rehabil Eng. 2006 doi: 10.1109/TNSRE.2006.881536. in press. [DOI] [PubMed] [Google Scholar]
- 4.Jensen RJ, Ziv OR, Rizzo JF. Responses of rabbit retinal ganglion cells to electrical stimulation with an epiretinal electrode. J Neural Eng. 2005;2:S16–21. doi: 10.1088/1741-2560/2/1/003. [DOI] [PubMed] [Google Scholar]
- 5.Sekirnjak C, Hottowy P, Sher A, et al. Electrical stimulation of mammalian retinal ganglion cells with multi-electrode arrays. J Neurophysiol. 2006;95:3311–3327. doi: 10.1152/jn.01168.2005. [DOI] [PubMed] [Google Scholar]
- 6.Mahadevappa M, Weiland JD, Yanai D, et al. Perceptual thresholds and electrode impedance in three retinal prosthesis subjects. IEEE Trans Neural Syst Rehabil Eng. 2005;13:201–206. doi: 10.1109/TNSRE.2005.848687. [DOI] [PubMed] [Google Scholar]
- 7.Humayun MS, Weiland JD, Fujii GY, et al. Visual perception in a blind subject with a chronic microelectronic retinal prosthesis. Vision Res. 2003;43:2573–2581. doi: 10.1016/s0042-6989(03)00457-7. [DOI] [PubMed] [Google Scholar]
- 8.Potts AM, Inoue J. The electrically evoked response of the visual system (EER) III. Further consideration to the origin of the EER. Invest Ophthalmol. 1970;9:814–820. [PubMed] [Google Scholar]
- 9.Potts AM, Inoue J. The electrically evoked response (EER) of the visual system II. Effect of adaptation and retinitis pigmentosa. Invest Ophthalmol. 1969;8:605–610. [PubMed] [Google Scholar]
- 10.Potts AM, Inoue J, Buffum D. The electrically evoked response of the visual system (EER) Invest Ophthalmol. 1968;7:269–280. [PubMed] [Google Scholar]
- 11.Miyake Y, Yanagida K, Yagasaki K. [Clinical application of EER (electrically evoked response) (2) Analysis of EER in patients with dysfunctional rod or cone visual pathway (author’s transl)] Nippon Ganka Gakkai Zasshi. 1980;84:502–508. [PubMed] [Google Scholar]
- 12.Shimazu K, Miyake Y, Watanabe S. Retinal ganglion cell response properties in the transcorneal electrically evoked response of the visual system. Vision Res. 1999;39:2251–2257. doi: 10.1016/s0042-6989(98)00331-9. [DOI] [PubMed] [Google Scholar]
- 13.Dawson WW, Radtke ND. The electrical stimulation of the retina by indwelling electrodes. Invest Ophthalmol Vis Sci. 1977;16:249–257. [PubMed] [Google Scholar]
- 14.Walter P, Heimann K. Evoked cortical potentials after electrical stimulation of the inner retina in rabbits. Graefes Arch Clin Exp Ophthalmol. 2000;238:315–321. doi: 10.1007/s004170050358. [DOI] [PubMed] [Google Scholar]
- 15.Ray K, Baldwin VJ, Acland GM, et al. Molecular diagnostic tests for ascertainment of genotype at the rod cone dysplasia 1 (rcd1) locus in Irish setters. Curr Eye Res. 1995;14:243–250. doi: 10.3109/02713689509033521. [DOI] [PubMed] [Google Scholar]
- 16.Guven D, Weiland JD, Fujii GY, et al. Long-term stimulation by active epiretinal implants in normal and RCD1 dogs. J Neural Eng. 2005;2:65–73. doi: 10.1088/1741-2560/2/1/009. [DOI] [PubMed] [Google Scholar]
- 17.Margalit E, Weiland JD, Clatterbuck RJ, et al. Visual and electrical evoked response recorded from subdural electrodes implanted above the visual cortex in normal dogs under two methods of anesthesia. J Neurosci Methods. 2003;123:129–138. doi: 10.1016/s0165-0270(02)00345-x. [DOI] [PubMed] [Google Scholar]
- 18.Greenberg RJ, Velte TJ, Humayun MS, et al. A computational model of electrical stimulation of the retinal ganglion cell. IEEE Trans Biomed Eng. 1999;46:505–514. doi: 10.1109/10.759051. [DOI] [PubMed] [Google Scholar]
- 19.Grumet AE, Rizzo JF, Wyatt JL. Multi-electrode stimulation and recording in the isolated retina. J Neurosci Methods. 2000;3883:31–37. doi: 10.1016/s0165-0270(00)00246-6. [DOI] [PubMed] [Google Scholar]
- 20.Fried SI, Hsueh HA, Werblin FS. A method for generating precise temporal patterns of retinal spiking using prosthetic stimulation. J Neurophysiol. 2006;95:970–978. doi: 10.1152/jn.00849.2005. [DOI] [PubMed] [Google Scholar]
- 21.Berson EL. Electroretinographic findings in retinitis pigmentosa. Jpn J Ophthalmol. 1987;31:327–348. [PubMed] [Google Scholar]
- 22.Grafstein B, Murray M, Ingoglia MA. Protein synthesis and axonal transport in retinal ganglion cells of mice lacking visual receptors. Brain Res. 1972;44:37–43. doi: 10.1016/0006-8993(72)90364-2. [DOI] [PubMed] [Google Scholar]


