Abstract
Escherichia coli possesses three distinct formate dehydrogenase enzymes encoded by the fdnGHI, fdhF, and fdoGHI operons. To examine how two of the formate dehyrogenase operons (fdnGHI and fdhF) are expressed anaerobically in the presence of low, intermediate, and high levels of nitrate, nitrite, and formate, chemostat culture techniques were employed with fdnG-lacZ and fdhF-lacZ reporter fusions. Complementary patterns of gene expression were seen. Optimal fdhF-lacZ expression occurred only at low to intermediate levels of nitrate, while high nitrate levels caused up to 10-fold inhibition of gene expression. In contrast, fdnG-lacZ expression was induced 25-fold in the presence of intermediate to high nitrate concentrations. Consistent with prior reports, NarL was able to induce fdnG-lacZ expression. However, NarP could not induce expression; rather, it functioned as an antagonist of fdnG-lacZ expression under low-nitrate conditions (i.e., it was a negative regulator). Nitrite, a reported signal for the Nar sensory system, was unable to stimulate or suppress expression of either formate dehydrogenase operon via NarL and NarP. The different gene expression profiles of the alternative formate dehydrogenase operons suggest that the two enzymes have complementary physiological roles under environmental conditions when nitrate and formate levels are changing. Revised regulatory schemes for NarL- and NarP-dependent nitrate control are presented for each operon.
Escherichia coli synthesizes three formate dehydrogenase enzymes encoded by the fdnGHI, fdhF, and fdoGHI genes (4). Each enzyme oxidizes formate to CO2 and passes electrons to either the quinone pool or other proteins for subsequent reduction of anaerobic respiratory substrates, including nitrate, nitrite, trimethylamine N-oxide, dimethyl sulfoxide, and fumarate (13, 14). These alternative electron transfer reactions allow cellular energy conservation and ATP generation via the proton-translocating ATPase.
The formate dehydrogenase N (Fdh-N) enzyme is encoded by the fdnGHI operon located at 32 min on the E. coli chromosome. Synthesis of this membrane-bound enzyme is maximal under anaerobic cell growth conditions when nitrate is present (6, 12). The enzyme functions in the formate-nitrate respiratory chain by coupling to the NarG nitrate reductase for reduction of nitrate to nitrite. The nitrate induction of fdnG expression occurs at the level of transcription control, where NarL is a strong activator and NarP is a weak activator (11, 20).
Formate dehydrogenase H (Fdh-H) is encoded by the fdhF gene located at 92 min on the E. coli chromosome. The 80-kDa selenopolypeptide is part of the formate-hydrogen lyase complex and either is located in the cell cytoplasm or is loosely associated with the inner surface of the cytoplasmic membrane. Optimal Fdh-H synthesis requires anaerobic conditions and the presence of formate. Induction of fdhF transcription occurs via the formate-dependent FHLA regulator in combination with sigma-54 polymerase (3). It has also been proposed that FhlA provides for nitrate-dependent suppression of fdhF gene expression (24). Since nitrate suppresses Fdh-H synthesis, this enzyme is thought to play a role in fermentation and is not believed to be actively involved in electron transfer to either of the respiratory nitrate reductases (7).
The third formate dehydrogenase, formate dehydrogenase O (Fdh-O), is membrane bound and is structurally and immunologically related to Fdh-N. However, Fdh-O is synthesized at relatively low levels independent of either oxygen or nitrate availability (1); fdoGHI is located at 88 min on the E. coli chromosome. It has been proposed that Fdh-O couples with the NarZ membrane-bound nitrate reductase enzyme in a fashion similar to that used by the FdhN/NarG formate dehydrogenase-nitrate reductase complex. It is thought that the physiological role of this minor pathway is to ensure a rapid transition from aerobic to anaerobic growth before the alternative enzymes reach sufficient levels to assume their major respiratory roles (1).
Previous studies have reported the effects of high levels of nitrate and/or formate on anaerobic expression of the fdnGHI and fdhF genes. However, it is not known how gene expression varies in the presence of either low or intermediate levels of these two electron donors or when the alternative electron acceptor nitrite is present. To address these questions, we used continuous cell culture methods to examine fdnG-lacZ and fdhF-lacZ gene expression at low, intermediate, and high steady-state levels of nitrate, nitrite, and formate. On the basis of these studies we propose revised models for the regulation of each operon in response to nitrate. Our results also strongly suggest how each enzyme participates in electron flow to the alternative anaerobic respiratory chains during anaerobic growth.
MATERIALS AND METHODS
Bacteria, plasmids, and phages.
E. coli strain MC4100 (Table 1) was used for all chemostat and batch culture experiments (27). The lacZ reporter fusions used to monitor expression of the two formate dehydrogenase operons were λHW13 (fdhF-lacZ) and λHW12 (fdnG-lacZ). Because the fusions were integrated at the lambda att site on the chromosome, each strain was wild type for the fdhF and fdnGHI operons. The fdhF-lacZ fusion was constructed by generating a DNA fragment by PCR that contained the fdhF regulatory region extending from position −255 to position 143 relative to the start site of fdhF transcription (22). The resulting DNA fragment was then inserted into plasmid pRS415 (28) to obtain the fdhF-lacZ operon fusion plasmid designated pHW13. The DNA insert in pHW13 was sequenced to confirm the intended construction (23). The fdhF-lacZ fusion was then transferred onto λRS45 to generate λHW13. A high-titer lysate was then used to introduce a single copy of the phage into MC4100 as previously described (28). The fdnG-lacZ fusion (λHW12) was constructed by generation of a DNA fragment containing the fdnG upstream region from position −275 to position 82 relative to the start site of fdnG transcription by using PCR protocols (22). The subsequent cloning steps were the same as those described above for fdhF-lacZ. The fdhF-lacZ and fdnG-lacZ reporter fusions were introduced into the isogenic wild-type, narL, narP, and narL narP strains (Table 1) by P1 transduction methods as previously described (19).
TABLE 1.
Strains, plasmids, and phages
| Strain, phage, or plasmid | Parent | Genotype or phenotype | Reference or source |
|---|---|---|---|
| Bacteria | |||
| MC4100 | F−araD139 (argF-lac)U169 rpsL150 relA1 fib5301 deoC1 ptsF25 rbsR | 27 | |
| RCC70 | MC4100 | narL::kan | 32 |
| RCC71 | MC4100 | narP::kan | 32 |
| HL110 | HL101 | narL::kan narP::kan Tn10 | 32 |
| Plasmids | |||
| pHW12 | fdnG-lacZ | This study | |
| pHW13 | fdhF-lacZ | This study | |
| pRS415 | lacZ lacY+lacA+ | 28 | |
| Phages | |||
| λRS45 | lacZ | 28 | |
| λHW12 | λRS45 | fdnG-lacZ lacY+lacA+ | This study |
| λHW13 | λRS45 | fdnF-lacZ lacY+lacA+ | This study |
Cell growth.
For routine cell growth and plasmid construction, cells were grown in Luria-Bertani liquid or solid medium. For batch cell cultures, cells were grown in a glucose (40 mM) minimal medium (8). When indicated below, sodium nitrate (40 mM) or sodium nitrite (5 mM) was added to the growth medium after sterilization. Anaerobic cell growth was performed at 37°C in 10-ml anaerobic culture tubes fitted with butyl rubber stoppers (16). Cells grown overnight under identical conditions in the same medium were used for inoculation.
Continuous-culture experiments were performed in a Bioflo 3000 bioreactor (New Brunswick Scientific, Edison, N.J.) fitted with a 2-liter glass vessel and operated with a liquid working volume of 1 liter as previously described (33). A modified Vogel-Bonner medium supplemented with glucose (2.25 mM) was used to limit cell growth (carbon-limiting conditions) (31). During the experiments, the chemostat was maintained at a medium flow rate of 10 ml/min, which corresponded to a cell doubling time of 70 min. Anaerobic culture conditions were maintained by continuously sparging the vessel with oxygen-free nitrogen at a flow rate of 200 ml/min (31). To vary the concentration of nitrate, nitrite, or formate in the medium, NaNO3, NaNO2, or sodium formate was added at the concentrations indicated below after medium sterilization.
When the chemostat was shifted to new conditions, new steady-state levels were verified as previously described (33). The values obtained for each culture condition were independently determined at least twice, and there was less than 10% variation in the β-galactosidase activity. Strain stability and purity were monitored as described previously (31). β-Galactosidase assays were performed as described previously (8), and 1 U of β-galactosidase activity was defined as the amount of activity that resulted in hydrolysis of 1 nmol of o-nitrophenyl-α-d-galactopyranoside (ONPG) per min per mg of protein.
DNA footprint analysis.
A 398-bp DNA fragment containing the fdhF regulatory region from position −255 to position 143 relative to the start of transcription was used for DNA footprint experiments. The fragment was amplified by PCR from the chromosome and was introduced into plasmid pRS415 to obtain pHW13. PCR was then performed with plasmid pHW13 as the template. The PCR product was digested with either the EcoRI or HindIII restriction enzyme, end labeled with [γ32P]dATP (ICN, Inc.) by using the Klenow fragment of DNA polymerase I (New England Biolabs Inc.), and purified with a PCR clean-up kit (Qiagen). DNase I footprint assays were carried out in 30 μl of binding buffer [1 mM Tris (pH 7.5), 5 mM KCl, 0.1 mM EDTA, 0.1 mM dithiothreitol, 0.7 mM CaCl2, 33 μg of poly(dI-dC) per ml, 12% glycerol] with a final DNA concentration of 2 nM as described previously (18). Following phosphorylation of NarL with acetyl phosphate (26), the proteins were immediately diluted to the concentrations indicated below, and DNA binding was allowed to proceed at 22°C for 10 min. DNase I (2 μl of a 1:250 dilution of a 10-mg ml−1 stock solution in water; Sigma Chemical Co., St. Louis, Mo.) was added, and the preparation was incubated for 6 min at 22°C. Reactions were stopped by addition of 7 μl of stop buffer [0.1 M ETDA (pH 8), 1.7 M sodium acetate (pH 5), 100 μg of poly-(dI-dC) per ml]. Following precipitation, the samples were resuspended in loading dye, subjected to electrophoresis on an 8% polyacrylamide gel containing 6 M urea, and detected by autoradiography.
Determination of formate concentration.
The concentration of formate in the culture medium was determined as previously described by Boehringer-Manheim for UV detection of formic acid; the sensitivity was 0.2 mM (Boehringer-Mannheim technical bulletin).
Materials.
ONPG was purchased from Sigma Chemical Co., and Casamino Acids was obtained from Difco Laboratories, Detroit, Mich. Nitrogen gas was supplied by Arco, Inc. All other chemicals used in this study were reagent grade.
RESULTS
fdnG and fdhF operons are anaerobically expressed in a complementary pattern in response to nitrate availability.
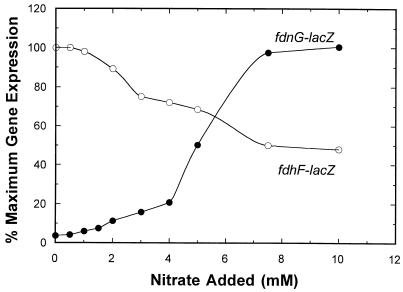
Since previous fdnG and fdhF regulatory studies were performed with anaerobic batch cultures by using high levels of nitrate and/or formate, little is known about how these two operons are expressed at low or intermediate levels of each environmental signal. To address these questions, we constructed fdhF-lacZ and fdnG-lacZ fusions and examined the expression of single copies under steady-state cell culture conditions under which the wild-type locus was preserved intact (see Materials and Methods). The effects of different levels of nitrate on gene expression are shown in Fig. 1. As anticipated from previous batch culture studies (11, 20), anaerobic fdnG-lacZ expression was lowest when nitrate was absent (ca. 180 U). When a low level of nitrate was added (range, 1 to 4 mM), gene expression gradually increased fourfold. At intermediate levels of nitrate (4 to 7 mM), fdnG-lacZ expression increased more rapidly (Fig. 1). At nitrate concentrations greater than 7 to 8 mM, gene expression remained constant. Interestingly, gene expression was modulated for a broad range of anion additions, and the induction pattern was reminiscent of that seen for the narG operon (33). Overall, anaerobic fdnG gene expression increased 25-fold.
FIG. 1.
Effect of nitrate on fdnG-lacZ and fdhF-lacZ expression during steady-state anaerobic cell growth. At each level of nitrate, the chemostat was sampled, and β-galactosidase activity was determined as described in Materials and Methods. After a shift to new conditions, a steady state was generally achieved within five residence times. Expression of the fdhF-lacZ fusion (○) and expression of the fdnG-lacZ fusion (•) were determined relative to the maximum level achieved for each fusion. The maximal fdnG-lacZ expression was 5,000 U, and the maximal fdhF-lacZ expression was 1,450 U.
Nitrate-dependent fdhF-lacZ expression in continuous cultures was measured under conditions identical to those described above for fdnG-lacZ expression (Fig. 1). The pattern of fdhF-lacZ expression during anaerobic growth was inverted compared to the pattern of fdnG-lacZ expression; fdhF-lacZ expression was highest in the absence of added nitrate and gradually decreased as nitrate levels were increased to 7 to 8 mM. Gene expression then remained relatively constant when higher nitrate levels were tested.
Since the E. coli cells were continually consuming nitrate by reducing it to nitrite with the NarG and NapF nitrate reductase enzymes (33), the nitrate addition levels indicated in Fig. 1 do not indicate the actual levels of nitrate remaining in the culture vessels. Therefore, the levels of nitrate and nitrite in the chemostat were determined for each steady-state condition shown in Fig. 1. The amount of nitrate or nitrite in the vessel was plotted versus the amount of nitrate added. The values are essentially identical to the values described in a previous report (33). Three conclusions are evident. First, fdhF expression was maximal when nitrate concentrations ranging from 0 to 1 mM were added; under these conditions free nitrate was either not detected in the vessel or the concentration was very low (ca. 0.2 μM). When the level of nitrate added was raised to 1 to 3 mM, gene expression was reduced by only 30%. Therefore, the cells apparently detected nitrate at or below the micromolar level and downregulated fdhF expression. Second, fdnG expression was most significantly affected only when the nitrate concentrations added were between 4 and 8 mM (Fig. 1). This corresponded to free nitrate levels in the vessel between 0.5 and 2 mM (33). Thus, expression of the fdhF and fdnG operons differed quantitatively with respect to the level of nitrate detected. Finally, changes in gene expression for both fusions were gradual rather than an abrupt on-off change in response to the signal (discussed below).
fdnG and fdhF operons are not significantly regulated in response to nitrite.
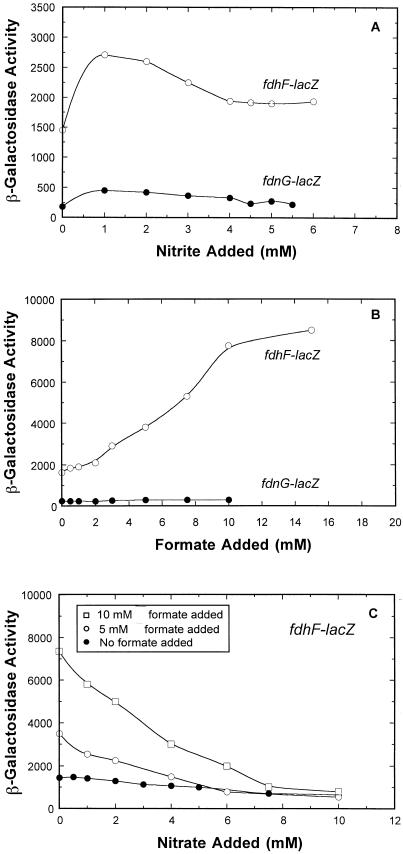
Anaerobic chemostat studies were also performed with nitrite added instead of nitrate (Fig. 2A). Expression of the fdnG-lacZ and fdhF-lacZ fusions was increased less than twofold over the entire range of the ligand tested (0 to 6 mM nitrite). Therefore, nitrite does not function as a significant environmental signal that controls expression of either formate dehydrogenase operon as nitrate does.
FIG. 2.
Effects of nitrite and formate on fdnG-lacZ and fdhF-lacZ expression under anaerobic conditions. The chemostat was sampled after each steady state was achieved, and β-galactosidase activity was determined as described in Materials and Methods. The cell growth conditions were identical to those used in the experiment whose results are shown Fig. 1, except that nitrate was omitted and different levels of nitrite (A), formate (B), or nitrate and formate (C) were present in the nutrient supply.
Effect of formate on fdnG-lacZ and fdhF-lacZ expression.
When formate was added to the chemostat at concentrations ranging from 0 to 15 mM, anaerobic fdhF-lacZ expression increased gradually over a fivefold range (Fig. 2B). This was anticipated as formate was previously shown to be an inducer of fdhF-lacZ expression (2, 15). In contrast to the effect on fdhF-lacZ expression, formate addition had no effect on fdnG-lacZ expression.
When nitrate-dependent fdhF-lacZ expression was examined after addition of different levels of formate (Fig. 2C), two things were evident. First, regardless of the level of formate added (0, 5, or 10 mM), anaerobic fdhF-lacZ expression was fully suppressed to a minimal level of about 800 U when a high level of nitrate (10 mM) was present. Second, addition of low to intermediate levels of nitrate resulted in an intermediate level of gene expression rather than an abrupt switch off. Therefore, the cells appeared to fine-tune the level of fdhF transcription (and presumably the level of Fdh-H) in response to the capacity of the cells to metabolize formate in the presence of nitrate (see below).
Effect of narL and narP mutations on nitrate-dependent fdhF-lacZ expression.
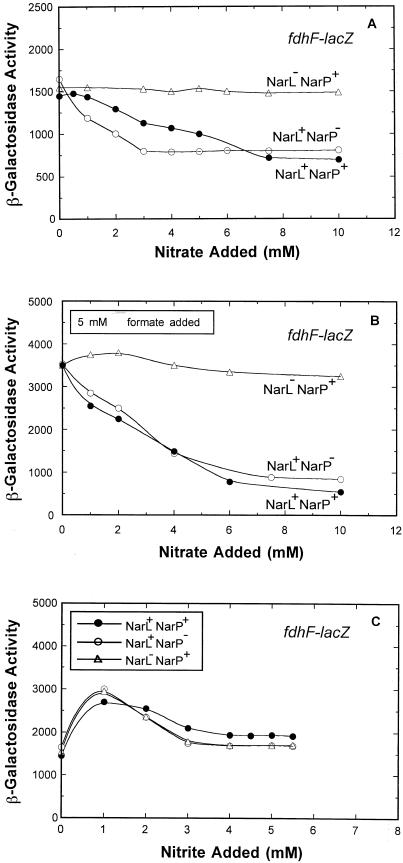
In previous batch culture experiments, neither NarL nor NarP was tested to determine its role in nitrate-dependent fdhF-lacZ expression (21, 29). We therefore examined this role under chemostat growth conditions (Fig. 3A). The narL strain was derepressed for fdhF-lacZ expression over the entire range of nitrate conditions tested. Therefore, NarL is a negative regulator of gene expression. The narP strain behaved like the wild-type strain at either very low or high nitrate concentrations. However, at moderate levels of nitrate, the fdhF-lacZ expression was less than that in the wild-type strain. The simplest interpretation of this gene expression profile is that NarP acts as an antagonist of NarL-dependent repression of fdhF-lacZ expression (compare the narL+narP+ strain to the narL+narP strain).
FIG. 3.
Effects of nitrate, nitrite, and formate on fdhF-lacZ expression in narL and narP strains. The cell growth conditions, harvesting methods, and enzyme assays were identical to those used in the experiment whose results are shown Fig. 1, except that different concentrations of nitrate (A), nitrate and formate (B), or nitrite (C) were added. •, expression in the wild-type strain; ○, expression in narP strain; ▵, expression in narL strain.
When 5 mM formate was added to the chemostat medium under nitrate-free culture conditions (Fig. 3B), fdhF-lacZ expression was elevated twofold relative to the expression in the absence of formate (Fig. 3A). Under these conditions, the sevenfold nitrate-dependent repression of fdhF-lacZ expression was eliminated in the narL mutant.
Nitrite had a less-than-twofold effect on fdhF-lacZ expression (Fig. 3C). Mutations in either narL or narP had no further effect on gene expression. Thus, nitrite does not serve as a direct environmental signal to modulate fdhF gene expression.
Effect of narL and narP mutations on nitrate-dependent fdnG-lacZ expression.
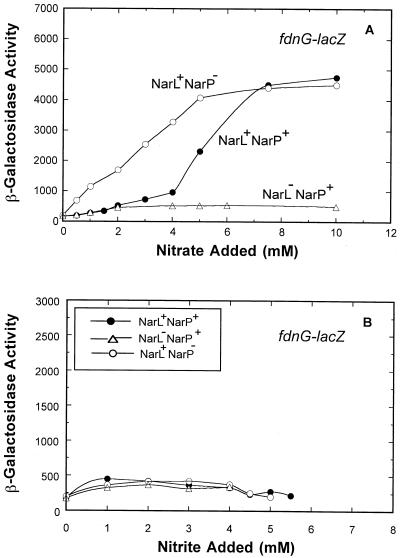
During steady-state growth (Fig. 1), nitrate-dependent fdnG-lacZ expression varied 25-fold. As anticipated from prior batch culture studies (20), nitrate induction was eliminated in a narL strain (Fig. 4A, compare the narL+narP+ strain to the narL narP+ strain). In contrast, NarP alone had a minor, fourfold effect on expression, as previously reported (11, 20). Moreover, the pattern of fdnG-lacZ expression in the narP strain was significantly different from the pattern of expression in the wild-type or narL strain (compare the narL+narP strain to the narL+narP+ strain). At low to intermediate levels of nitrate (2 to 6 mM) NarP appeared to antagonize the ability of NarL to activate fdnG operon expression. The level of free nitrate remaining in the growth vessel under these conditions was in the submicromolar to 0.1 mM range (33) (Fig. 2). Therefore, NarP provides a regulatory response to delay NarL-dependent induction of fdnG-lacZ expression when the nitrate concentration is low to intermediate.
FIG. 4.
Effects of nitrate and nitrite on fdnG-lacZ expression in narL and narP strains. The cell growth conditions, harvesting methods, and enzyme assays were identical to those used in the experiment whose results are shown Fig. 1, except that different concentrations of nitrate (A) or nitrite (B) were added. •, expression in the wild-type strain; ○, expression in narP strain; ▵, expression in narL strain.
When nitrite was used in place of nitrate, mutations in neither narL nor narP had any effect on fdnG-lacZ gene expression (Fig. 4B). Nitrite does not appear to be a significant environmental signal for fdnG gene regulation.
Comparison of fdnG-lacZ and fdhF-lacZ gene expression in batch culture and in continuous culture.
Since some of the chemostat data differed from results obtained previously in batch culture experiments, the fdnG-lacZ and fdhF-lacZ reporter strains described above were analyzed in anaerobic batch cultures by using the same strains and media (Tables 2 and 3). Overall, the gene expression patterns for each fusion were similar to the patterns for chemostat cell growth for high nitrate levels compared with no addition (10- and 2-fold control of fdnG-lacZ and fdhF-lacZ expression by nitrate, respectively). The effect of NarP on nitrate-dependent repression of fdnG-lacZ expression was not observed in batch cultures since this control was observed only at low to intermediate levels of the anion. The nitrate-dependent repression of fdhF-lacZ expression shown in Fig. 3B was confirmed by batch culture experiments in which NarL negatively regulated gene expression. Finally, nitrite had less than a twofold effect on the expression of either fusion in batch culture. Therefore, the two cell growth methods gave comparable results in response to saturating levels of nitrate, nitrite, or formate.
TABLE 2.
Anaerobic fdnG-lacZ expression in batch and continuous cultures in response to nitrate, nitrite, and formate availabilitya
| Strain | Batch expression with the following additions:
|
Chemostat expression with the following additions:
|
||||||
|---|---|---|---|---|---|---|---|---|
| None | NO3 | NO2 | HCOOH | None | NO3 | NO2 | HCOOH | |
| Wild type | 305 | 3,030 | 470 | 410 | 176 | 5,000 | 318 | 295 |
| narP | 295 | 3,110 | 465 | NDb | 200 | 4,390 | 220 | ND |
| narL | 285 | 535 | 285 | ND | 175 | 520 | 320 | ND |
Cells were grown on glucose minimal medium anaerobically as described in Materials and Methods. Where indicated, sodium nitrate (initial concentration, 40 mM), nitrite (5 mM), or formate (30 mM) was added. Units are given as nanomoles of ONPG hydrolyzed per minute per milligram of protein.
ND, not determined.
TABLE 3.
Anaerobic fdhF-lacZ expression in batch culture and continuous culturea
| Strain | Batch expression with the following additions:
|
Chemostat expression with the following additions:
|
||||||||
|---|---|---|---|---|---|---|---|---|---|---|
| None | NO3 | NO2 | HCOOH | Formate and nitrate | None | NO3 | NO2 | HCOOH | Formate and nitrate | |
| Wild type | 410 | 210 | 380 | 6,700 | 306 | 1,450 | 700 | 1,930 | 8,500 | 600 |
| narP | 700 | 275 | 635 | NDb | 858 | 1,955 | 950 | 1,700 | ND | 800 |
| narL | 580 | 615 | 530 | ND | 596 | 1,650 | 1,480 | 1,750 | ND | 3,200 |
Cells were grown on glucose minimal medium anaerobically as described in Materials and Methods. Where indicated, sodium nitrate (initial concentration, 40 mM), nitrite (5 mM), formate (30 mM), or formate (30 mM) plus nitrate (40 mM) was added.
ND, not determined. Units are given as nanomoles of ONPG hydrolyzed per minute per milligram of protein.
Does NarL bind directly at the fdhF promoter?
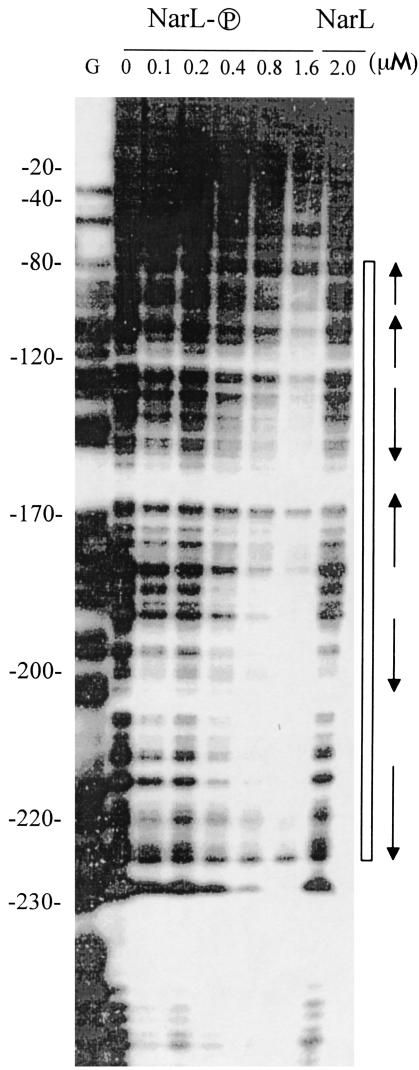
It has been proposed that nitrate control of fdhF expression is mediated by the formate FhlA regulator (21, 29). By using an alternative model, nitrate control could be provided directly by the NarL response regulator. To test if NarL can bind at the fdhF promoter, DNase I footprint experiments were performed with purified NarL protein. In the presence of 400 nM NarL phosphate, two regions of fdhF regulatory DNA were protected (Fig. 5). A 45-bp region extended from position −130 to position −175 relative to the start of fdhF transcription, and a 30-bp region extended from about position −190 to position −227. When an elevated level of NarL phosphate was used (800 nM), the footprint was gradually enlarged to about 147 bp (from position −80 to about position −227 or beyond to position −250). When nonphosphorylated NarL was used, no DNA protection was detected even when the NarL concentration was more than 2 μM (Fig. 5; data not shown). These findings indicate that NarL phosphate, but not the inactive dephosphorylated form of NarL, binds at the fdhF promoter to suppress fdhF gene expression.
FIG. 5.
DNase I footprint analysis of the fdhF regulatory region with NarL and NarL phosphate. Footprinting procedures and NarL phosphorylation were performed as described in Materials and Methods. The amount of protein used in each lane is indicated above the lane. The open box indicates the DNase I-protected regions. The arrows indicate the positions of potential NarL heptamer-like recognition sequences based on the NarL heptamer sequence of Darwin et al. (10).
Effect of formate addition during anaerobic growth.
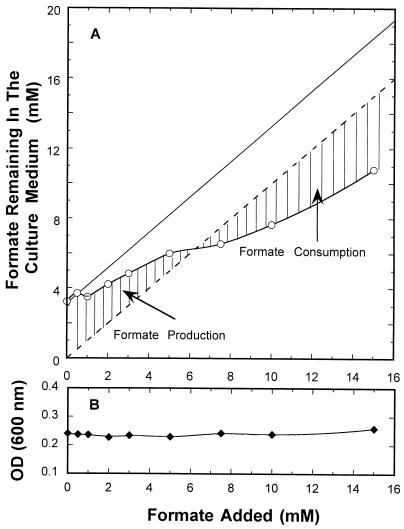
During anaerobic growth in minimal medium (i.e., when no formate was added to the growth vessel), the steady-state level of formate produced by wild-type E. coli was 3.2 mM (Fig. 6). This corresponds to about 1.5 mol of formate produced per mol of glucose consumed (when 2.25 mM glucose was added in the chemostat experiments [see Materials and Methods]). This suggests that there was little hydrogen produced via the formate-hydrogen lyase under these conditions and/or that little lactate was formed since a maximum of 2 mol of formate could be produced per mol of glucose consumed (5).
FIG. 6.
Steady-state levels of formate remaining in the growth vessel after different levels of formate were added. The chemostat conditions were identical to those described in the legend to Fig. 2. The vessel was sampled after each steady state was achieved, and the formate concentration was determined as described in Materials and Methods. The level of formate remaining (○) is indicated in panel A, while the solid line indicates the amount of added formate plus the amount of initial formate produced (3.25 mM) when no formate was added. The dotted line indicates the amount of formate expected if no formate was produced or consumed by the cells. (B) Optical density at 600 nm [OD (600 nm)] of the cells in the vessel.
When increasing amounts of formate were added in a stepwise fashion over the range from 0 to 15 mM, the amount of formate remaining in the vessel increased proportionally (Fig. 6). At the low formate levels (0 to 6.3 mM), the amount of formate remaining in the vessel was always higher than the amount of formate added. At higher formate concentrations (6.3 to 15 mM), the cells apparently consumed part of the added formate since the free formate level was always lower than the amount added. The amount of formate either produced or consumed could be estimated by determining the difference between the amount of formate added and the amount of formate remaining. The maximum amount of formate produced was 3.2 mM (when no formate was added), and the maximum amount of formate consumed was 4.2 mM (when 15 mM formate was added). The change from net production to net consumption occurred at 6.3 mM. It is not known if the formate consumed was converted to hydrogen gas or to protons, with the electrons passed to an electron acceptor(s). If cells consumed no formate, we expected to see the formate level indicated by the solid line in Fig. 6. Under no conditions was energy apparently conserved by the cells since the cell density (as measured by optical density at 600 nm) remained constant over the entire range of formate concentrations tested (Fig. 6B).
DISCUSSION
The chemostat studies described above documented how the fdnG and fdhF genes are differentially expressed in a complementary manner at low, intermediate, and high levels of nitrate, nitrite, and formate (Fig. 1 to 4). Our findings considerably extend the findings of previous studies of the anaerobic regulatory response and contradict the findings of some other studies that reported roles for nitrite in Nar regulon control (30). With the accompanying narL and narP mutant studies, revised roles for NarL and NarP in control of fdhF and fdnG gene expression may also be proposed.
Revised model for NarL and NarP control of fdnG gene expression.
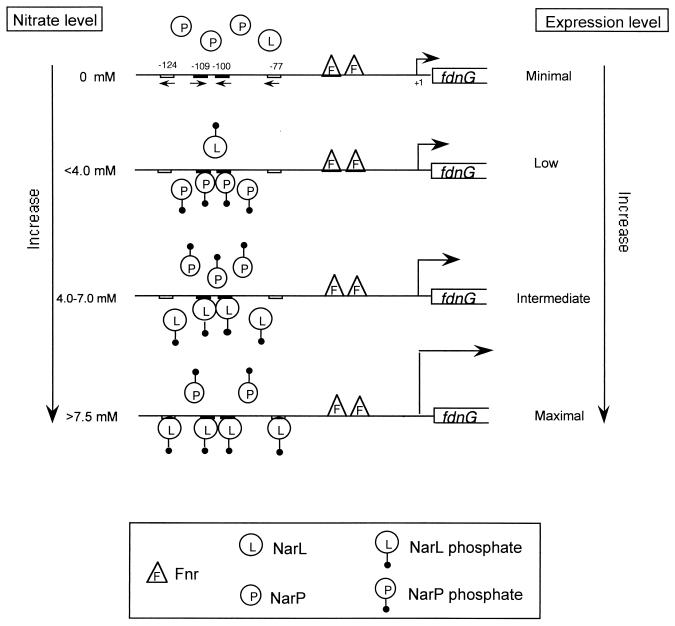
The chemostat fdnG gene expression data (Fig. 4) provide the basis for the regulatory model shown in Fig. 7. In the absence of nitrate, fdnG expression is minimal since the NarL and NarP regulatory proteins are in their inactivate forms and therefore unable to recognize and bind DNA. However, under low-nitrate conditions (1 to 4 mM added nitrate or less than 0.4 μM nitrate remaining) sufficient activation of NarP occurs, and the newly formed NarP phosphate then binds at the two NarP recognition heptamers centered at positions −109 and −100 upstream of the fdhG promoter (11). Under these conditions, NarL is also partially activated, resulting in NarL phosphate. However, the amounts of active NarL made are not sufficient to fully displace NarP phosphate at the two heptamer sites. Gene expression is thus intermediate. The chemostat data (Fig. 4A) imply that bound NarP phosphate is not competent for activating fdnG transcription since fdnG-lacZ expression was not affected in the narP+narL strain compared to expression in the narP+narL+ strain (see below). Whether the NarP phosphate bound to DNA is unable to productively interact with FNR or RNA polymerase to induce fdnG gene expression is not known. As additional NarL protein is activated in the presence of higher levels of nitrate (ca. 7 mM), it fully displaces the NarP phosphate from the DNA and maximally induces fdnG expression. In contrast to NarP, when NarL phosphate is bound to DNA, it can successfully interact with FNR and/or RNA polymerase to switch on fdnG gene expression. However, this regulatory switch operates more like a rheostat than an abrupt or on-off switch since gene expression increases gradually as the nitrate concentration is increased from 1 to 7 mM (Fig. 1). These in vivo data correlate well with the in vitro findings that NarX phosphorylation and NarL activation occur gradually over a range of nitrate concentrations (17). The Nar regulatory circuit clearly can sense and respond over 2 orders of magnitude of nitrate concentrations. Signal output through NarL phosphate and NarP phosphate continuously adjusts fdnG gene expression in response to the environmental signal input. Based on the in vivo data shown in Fig. 4B, nitrite is not able replace nitrate for activating fdnG expression in strains that are wild type for NarX and NarQ. Likewise, nitrite was an inferior activator of NarX in vitro (17). However, a putative role for NarQ in nitrite-dependent activation of fdnG (20) was not addressed in this study.
FIG. 7.
Model for regulation of fdnG operon expression. Under anaerobic conditions in the absence of nitrate the FNR protein induces fdnG operon expression. The presence of a low nitrate level weakly induces fdnG expression due to the low level of phosphorylated NarL protein. However, phosphorylated NarP protein bound at the same heptamer sites at positions −109 and −100 competes with NarL to antagonize its ability to stimulate transcription. NarP phosphate is unable to perform activation. At increased levels of nitrate, the NarL phosphate protein binds to the sites at positions −109 and −100 and replaces the NarP protein; NarL phosphate then maximally induces fdnG expression.
Previous studies reported that NarL was a strong activator of fdnG gene expression in response to nitrate, while NarP was reported to be a weak activator (by ca. fourfold) (20). Neither the chemostat studies nor the batch culture studies (Table 2) supported a significant role for NarP either. Rather, the chemostat experiments (Fig. 4A) revealed that NarP protein acts to antagonize or spoil the ability of the NarL protein to activate gene expression at intermediate nitrate levels (i.e., it functions as a negative regulator). NarP thus performs a unique role to fine-tune fdnG operon expression by delaying the ability of NarL to activate when nitrate levels are low. Both the NarL and NarP proteins were shown to bind the fdnG promoter region (11), thus demonstrating that each protein plays a direct role in gene expression. Interestingly, NarL and NarP operate differently at the napF promoter, where NarL blocks activation of NarP (30).
Revised model for NarL and NarP control of fdhF gene expression.
Although fdhF expression was reported to be activated by formate and repressed by nitrate, neither NarL nor NarP was tested to determine its role in nitrate- or nitrite-dependent fdhF gene expression (21, 29). In contrast, the FHLA regulator was proposed to provide gene control in response to both signals. Previous studies revealed that a decrease in the internal formate concentration leads to a reduction in the level of fdhF expression (i.e., there is NarL-independent fdhF repression). The chemostat results (Fig. 3A) and NarL footprint data (Fig. 5) strongly suggest that the Nar two-component system plays a direct role in fdhF gene expression.
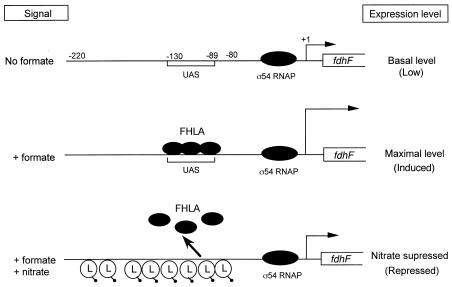
The data described above also provide the basis for a new regulatory model for nitrate control of fdhF expression (Fig. 8). In the absence of formate, fdhF gene expression is low. When formate is added exogenously, the FHLA protein is activated and binds to its upstream activator site (UAS) located at positions −130 to −89 relative to the start of fdhF transcription (25). Maximum gene expression occurs under high-formate conditions (ca. 10 mM). However, according to the current model, when nitrate is also present, the NarL regulatory protein is activated, and NarL phosphate then binds to the fdhF upstream region to suppress expression. NarL phosphate presumably displaces and/or interferes with the ability of FHLA to interact with sigma-54 polymerase bound at the fdhF promoter. NarP phosphate appears to be a mild antagonist of NarL phosphate binding to DNA when formate levels are low (Fig. 3A). This effect is diminished when the formate level is high (Fig. 3B). The interactions of the FHLA, NarL, and NarP regulators thus provide a means to continually adjust fdhF expression over a range of signal levels.
FIG. 8.
Proposed model for anaerobic regulation of fdhF gene expression by nitrate. FHLA is the formate-dependent transcriptional activator of fdhF gene expression. The fdhF promoter is sigma-54 protein dependent. Gene expression is low in the absence of added formate. However, in the presence of a high formate concentration, FHLA binds to the UAS region to activate fdhF gene expression. On the other hand, nitrate suppresses fdhF gene expression. The binding of the NarL phosphate protein at the fdhF promoter somehow interferes with binding of FHLA and/or sigma-54 RNA polymerase. Under these conditions, fdhF expression is repressed.
The NarL footprint data (Fig. 5) strongly support the hypothesis that NarL phosphate plays a direct role in the control of fdhF gene expression. Inspection of the DNA sequence in the NarL phosphate protected region revealed numerous (at least five to seven) NarL heptamer-like recognition sequences that are similar to the NarL heptamer sequence described by Darwin and coworkers (10). NarL binding to DNA could conceivably initiate at one or more of the heptamer sites, and adjacent sites are then occupied as higher levels of NarL phosphate are formed. However, inactive NarL (i.e., dephosphorylated NarL) does not bind and protect any region of the fdhF promoter DNA (Fig. 5, lane 2.0), in good agreement with the in vivo studies. This is the first example in which NarL phosphate plays a role in controlling a sigma-54-dependent promoter. Additional experiments are needed to identify the exact number, position, and orientation of NarL heptamer sites.
Nitrite is not an effective environmental signal for either fdhF or fdnG expression.
Neither NarL nor NarP significantly effects expression of either the fdhF or fdnG genes when nitrite is present (Figs. 3B and 4B). These findings are best explained by the observation that neither NarX (17) nor NarQ (data not shown) can respond to low or intermediate levels of nitrite in vitro. Only when nitrite is present at concentrations ranging from 5 to 10 mM is NarX partially activated. This is in contrast to the ability of NarX to respond to micromolar levels of nitrate (17).
The modest twofold stimulation of fdhF gene expression by nitrite is independent of the Nar regulatory system (Fig. 3C). Although the molecular basis for this control is unknown, it is interesting that this expression profile correlates with the nitrite-dependent stimulation of the nrfA promoter for synthesis of the Nrf nitrite reductase (32). This is consistent with transfer of electrons produced from oxidation of formate by FdhF to the Nrf enzyme for reduction of nitrite to ammonia.
Insight into how the fdnGHI and fdhF gene products function during anaerobic cell growth.
The roles of the fdnG and fdhF operons in E. coli metabolism have been addressed by a number of investigators (5). Fdh-N (FdnG) is considered to be primarily involved in the transfer of electrons from formate to nitrate via the NarGHI nitrate reductase. The gene expression patterns described above fully support this proposal (Fig. 1) (33). In fact, the fdnG gene expression profile suggests that Fdh-N is most abundant only at intermediate to high nitrate concentrations. This profile is nearly identical to the narG expression profile, in which the corresponding enzyme activities are in excellent agreement (33). At low nitrate concentrations (Fig. 1) the chemostat data suggest that there is restricted involvement of the fdnG formate dehydrogenase (Fdh-N) in the transfer of electrons to the NarG or Nap nitrate reductase or Nrf nitrite reductase pathway. It is not known if the Fdh-N and Fdn-H activities parallel the gene expression patterns. On the other hand, in the presence of no nitrate or in the presence of low nitrate concentrations when fdnG expression is low, fdhF expression is maximal. These are the conditions for optimal expression of the napF and nrfA genes (ca. 1 mM nitrate added or 0.4 μM free nitrate remaining) (32, 33) for the Nap nitrate reductase and the Nrf nitrite reductase.
A previous study showed that when cells are grown in batch culture in a rich medium containing nitrite in place of nitrate, all three formate dehydrogenases can contribute to formate-nitrite respiration (9); that is, measurable amounts of each enzyme are present in the cell membranes. The involvement of FdoGHI was estimated to be relatively minor (less than 10% of the entire capacity), while the Fdh-N and Fdh-H enzymes contributed about 40%. These studies are difficult to interpret since the cells were not growing in a steady state. Since neither fdhF nor fdnG expression is significantly affected by nitrite (Fig. 2A), the accumulation of this potential respiratory substrate under nitrate-reducing conditions does not provide additional signal input to control fdhF and fdnG expression via the Nar two-component regulatory circuit.
Although Fdh-H (fdhF) is considered to be a fermentative enzyme (5), fdhF expression is still optimal when nitrate is present at low levels (ca. 1 mM) (Fig. 1). Optimal nrfA nitrite reductase operon expression occurs under these conditions, as does napF nitrate reductase expression (32, 33). These data support the proposal that Fdh-H can participate in anaerobic respiration in the presence of nitrite (9), as well as under low-nitrate conditions. The Fdh-H enzyme, which functions under fermentation conditions when neither nitrite nor nitrate is present, does not support significant electron transfer to the NarG nitrate reductase (33).
The chemostat gene expression approach offers new insights into the relationship of nitrate, nitrite, and formate metabolism in E. coli. It also suggests how other enteric bacteria may control their anaerobic pathways when they perform mixed acid fermentation or anaerobic respiration. It will be interesting to explore the contribution of the third formate operon (fdoGHI), as well as the hydrogenase genes (hya,hyb,hyc), during anaerobic growth when alternative electron acceptors and donors are present.
Acknowledgments
We thank Mike Jarvis for assistance and advice concerning the NarL footprint experiments.
This study was supported in part by Public Health Service grant AI21678 from the National Institutes of Health.
REFERENCES
- 1.Abaibou, H., J. Pommier, S. Benoit, G. Giordano, and M. A. Mandrand-Berthelot. 1995. Expression and characterization of the Escherichia coli fdo locus and a possible physiological role for aerobic formate dehydrogenase. J. Bacteriol. 177:7141-7149. [DOI] [PMC free article] [PubMed] [Google Scholar]
- 2.Birkmann, A., and A. Bock. 1989. Characterization of a cis regulatory DNA element necessary for formate induction of the formate dehydrogenase gene (fdhF) of Escherichia coli. Mol. Microbiol. 3:187-195. [DOI] [PubMed] [Google Scholar]
- 3.Birkmann, A., R. G. Sawers, and A. Bock. 1987. Involvement of the ntrA gene product in the anaerobic metabolism of Escherichia coli. Mol. Gen. Genet. 210:535-542. [DOI] [PubMed] [Google Scholar]
- 4.Blattner, F. R., G. Plunkett 3rd, C. A. Bloch, N. T. Perna, V. Burland, M. Riley, J. Collado-Vides, J. D. Glasner, C. K. Rode, G. F. Mayhew, J. Gregor, N. W. Davis, H. A. Kirkpatrick, M. A. Goeden, D. J. Rose, B. Mau, and Y. Shao. 1997. The complete genome sequence of Escherichia coli K-12. Science 277:1453-1474. [DOI] [PubMed] [Google Scholar]
- 5.Bock, A., and G. Sawers. 1996. Fermentation, p. 262-282. In F. C. Neidhardt, R. Curtiss III, J. L. Ingraham, E. C. C. Lin, K. B. Low, B. Magasanik, W. S. Reznikoff, M. Riley, M. Schaechter, and H. E. Umbarger (ed.), Escherichia coli and Salmonella: cellular and molecular biology, 2nd ed., vol. 1. American Society for Microbiology, Washington, D.C.
- 6.Chaudhry, G. R., and C. H. MacGregor. 1983. Cytochrome b from Escherichia coli nitrate reductase; its properties and association with the enzyme complex. J. Biol. Chem. 258:5819-5827. [PubMed] [Google Scholar]
- 7.Cole, J. 1996. Nitrate reduction to ammonia by enteric bacteria: redundancy, or a strategy for survival during oxygen starvation? FEMS Microbiol. Lett. 136:1-11. [DOI] [PubMed] [Google Scholar]
- 8.Cotter, P. A., and R. P. Gunsalus. 1989. Oxygen, nitrate, and molybdenum regulation of dmsABC gene expression in Escherichia coli. J. Bacteriol. 171:3817-3823. [DOI] [PMC free article] [PubMed] [Google Scholar]
- 9.Darwin, A., P. Tormay, L. Page, L. Griffiths, and J. Cole. 1993. Identification of the formate dehydrogenases and genetic determinants of formate-dependent nitrite reduction by Escherichia coli K12. J. Gen. Microbiol. 139:1829-1840. [DOI] [PubMed] [Google Scholar]
- 10.Darwin, A. J., J. Li, and V. Stewart. 1996. Analysis of nitrate regulatory protein NarL-binding sites in the fdnG and narG operon control regions of Escherichia coli K-12. Mol. Microbiol. 20:621-632. [DOI] [PubMed] [Google Scholar]
- 11.Darwin, A. J., K. L. Tyson, S. J. Busby, and V. Stewart. 1997. Differential regulation by the homologous response regulators NarL and NarP of Escherichia coli K-12 depends on DNA binding site arrangement. Mol. Microbiol. 25:583-595. [DOI] [PubMed] [Google Scholar]
- 12.Enoch, H. G., and R. I. Lester. 1975. The purification and properties of formate dehydrogenase and nitrate reductase from Escherichia coli. J. Biol. Chem. 250:6693-6705. [PubMed] [Google Scholar]
- 13.Gennis, R., and V. Stewart. 1996. Respiration, p. 217-261. In F. C. Neidhardt, R. Curtiss III, J. L. Ingraham, E. C. C. Lin, K. B. Low, B. Magasanik, W. S. Reznikoff, M. Riley, M. Schaechter, and H. E. Umbarger (ed.), Escherichia coli and Salmonella: cellular and molecular biology, 2nd ed., vol. 1. American Society for Microbiology, Washington, D.C.
- 14.Gunsalus, R. P. 1992. Control of electron flow in Escherichia coli: coordinated transcription of respiratory pathway genes. J. Bacteriol. 174:7069-7074. [DOI] [PMC free article] [PubMed] [Google Scholar]
- 15.Hopper, S., M. Babst, V. Schlensog, H. M. Fischer, H. Hennecke, and A. Bock. 1994. Regulated expression in vitro of genes coding for formate hydrogen lyase components of Escherichia coli. J. Biol. Chem. 269:19597-19604. [PubMed] [Google Scholar]
- 16.Jones, H. M., and R. P. Gunsalus. 1987. Regulation of Escherichia coli fumarate reductase (frdABCD) operon expression by respiratory electron acceptors and the fnr gene product. J. Bacteriol. 169:3340-3349. [DOI] [PMC free article] [PubMed] [Google Scholar]
- 17.Lee, A. I., A. Delgado, and R. P. Gunsalus. 1999. Signal-dependent phosphorylation of the membrane-bound NarX two-component sensor transmitter protein of Escherichia coli: nitrate elicits a superior anion ligand response compared to nitrite. J. Bacteriol. 181:5309-5316. [DOI] [PMC free article] [PubMed] [Google Scholar]
- 18.McNicholas, P. M., R. C. Chiang, and R. P. Gunsalus. 1998. Anaerobic regulation of the Escherichia coli dmsABC operon requires the molybdate-responsive regulator ModE. Mol. Microbiol. 27:197-208. [DOI] [PubMed] [Google Scholar]
- 19.Miller, J. H. 1972. Experiments in molecular genetics. Cold Spring Harbor Laboratory Press, Cold Spring Harbor, N.Y.
- 20.Rabin, R. S., and V. Stewart. 1993. Dual response regulators (NarL and NarP) interact with dual sensors (NarX and NarQ) to control nitrate- and nitrite-regulated gene expression in Escherichia coli K-12. J. Bacteriol. 175:3259-3268. [DOI] [PMC free article] [PubMed] [Google Scholar]
- 21.Rossmann, R., G. Sawers, and A. Bock. 1991. Mechanism of regulation of the formate-hydrogen lyase pathway by oxygen, nitrate, and pH: definition of the formate regulon. Mol. Microbiol. 5:2807-2814. [DOI] [PubMed] [Google Scholar]
- 22.Saiki, R. K., S. Scharf, F. Faloona, K. B. Mullis, G. T. Horn, H. A. Erlich, and N. Arnheim. 1985. Enzymatic amplification of b-globin genomic sequences for diagnosis of sickle cell anemia. Science 230:1350-1354. [DOI] [PubMed] [Google Scholar]
- 23.Sanger, F., B. J. Nicklen, and A. R. Coulson. 1977. DNA sequencing with chain-terminating inhibitors. Proc. Natl. Acad. Sci. USA 74:5463-5467. [DOI] [PMC free article] [PubMed] [Google Scholar]
- 24.Schlensog, V., and A. Bock. 1990. Identification and sequence analysis of the gene encoding the transcriptional activator of the formate hydrogen lyase system of Escherichia coli. Mol. Microbiol. 4:1319-1327. [DOI] [PubMed] [Google Scholar]
- 25.Schlensog, V., S. Lutz, and A. Bock. 1994. Purification and DNA-binding properties of FHLA, the transcriptional activator of the formate hydrogen lyase system from Escherichia coli. J. Biol. Chem. 269:19590-19596. [PubMed] [Google Scholar]
- 26.Schroeder, I., C. D. Wolin, R. Cavicchioli, and R. P. Gunsalus. 1994. Phosphorylation and dephosphorylation of the NarQ, NarX, and NarL proteins of the nitrate-dependent two-component regulatory system of Escherichia coli. J. Bacteriol. 176:4985-4992. [DOI] [PMC free article] [PubMed] [Google Scholar]
- 27.Silhavy, T. J., M. L. Berman, and L. W. Enquist. 1984. Experiments with gene fusions. Cold Spring Harbor Laboratory Press, Cold Spring Harbor, N.Y.
- 28.Simons, R. W., F. Houman, and N. Kleckner. 1987. Improved single and multicopy lac-based cloning vectors for protein and operon fusions. Gene 53:85-96. [DOI] [PubMed] [Google Scholar]
- 29.Stewart, V., and B. L. Berg. 1988. Influence of nar (nitrate reductase) genes on nitrate inhibition of formate-hydrogen lyase and fumarate reductase gene expression in Escherichia coli K-12. J. Bacteriol. 170:4437-4444. [DOI] [PMC free article] [PubMed] [Google Scholar]
- 30.Stewart, V., and R. S. Rabin. 1995. Dual sensors and dual response regulations interact to control nitrate- and nitrite-responsive gene expression in Escherichia coli, p. 233-252. In J. A. Hoch and T. J. Silhavy (ed.), Two-component signal transduction. American Society for Microbiology, Washington, D.C.
- 31.Tseng, C. P., A. K. Hansen, P. Cotter, and R. P. Gunsalus. 1994. Effect of cell growth rate on expression of the anaerobic respiratory pathway operons frdABCD, dmsABC, and narGHJI of Escherichia coli. J. Bacteriol. 176:6599-6605. [DOI] [PMC free article] [PubMed] [Google Scholar]
- 32.Wang, H., and R. P. Gunsalus. 2000. The nrfA and nirB nitrite reductase operons in Esherichia coli are expressed differently in response to nitrate than to nitrite. J. Bacteriol. 182:5813-5822. [DOI] [PMC free article] [PubMed] [Google Scholar]
- 33.Wang, H., C.-P. Tseng, and R. P. Gunsalus. 1999. The napF and narG nitrate reductase operons in Escherichia coli are differentially expressed in response to submicromolar concentrations of nitrate but not nitrite. J. Bacteriol. 181:5303-5308. [DOI] [PMC free article] [PubMed] [Google Scholar]


