

Abstract
Roots display hydrotropism in response to moisture gradients, which is thought to be important for controlling their growth orientation, obtaining water, and establishing their stand in the terrestrial environment. However, the molecular mechanism underlying hydrotropism remains unknown. Here, we report that roots of the Arabidopsis mutant mizu-kussei1 (miz1), which are impaired in hydrotropism, show normal gravitropism and elongation growth. The roots of miz1 plants showed reduced phototropism and a modified wavy growth response. There were no distinct differences in morphological features and root structure between miz1 and wild-type plants. These results suggest that the pathway inducing hydrotropism is independent of the pathways used in other tropic responses. The phenotype results from a single recessive mutation in MIZ1, which encodes a protein containing a domain (the MIZ domain) that is highly conserved among terrestrial plants such as rice and moss. The MIZ domain was not found in known genomes of organisms such as green algae, red algae, cyanobacteria, or animals. We hypothesize that MIZ1 has evolved to play an important role in adaptation to terrestrial life because hydrotropism could contribute to drought avoidance in higher plants. In addition, a pMIZ1::GUS fusion gene was expressed strongly in columella cells of the root cap but not in the elongation zone, suggesting that MIZ1 functions in the early phase of the hydrotropic response.
Keywords: Arabidopsis, columella cells, drought avoidance, MIZU-KUSSEI1 (MIZ1), root tropism
Root systems are responsible for the acquisition of water and nutrients from the soil, and they enable plants to become established in heterogeneous environments. Roots control their growth orientation by displaying tropisms in response to environmental cues such as gravity, light, physical contact, and moisture gradients (1–7). These responses are important features for the survival of sessile terrestrial plants in stressful environments such as drought conditions. Although there have been many studies conducted on the gravitropic response (4, 8, 9), other tropisms in roots largely have been unexplored. Although some studies have identified the existence of hydrotropism (the directed growth of roots in a moisture gradient), it has proven difficult to differentiate between this response and gravitropism because the latter always interferes with the former here on Earth (3). However, by using an agravitropic mutant or clinorotation to randomize the angle of gravitropic stimulation so that plants no longer exhibit gravity-directed growth, positive hydrotropism in roots has been demonstrated (10–12). This rediscovery of a genuine hydrotropism in roots enabled us to elucidate some physiological aspects of hydrotropism and its universality in a wide range of plant species (3), but the underlying mechanisms that regulate hydrotropism remain unknown. Although the ecological role of hydrotropism in nature still needs to be clarified, the root response is thought to be important for finding water. Considering that limited water availability and/or precipitation affects agriculture and ecosystems throughout the world, understanding the molecular mechanisms mediating hydrotropism in roots could lead to methods for improving crop yield and biomass production.
Isolation and analysis of hydrotropism-deficient mutants by using the model plant species Arabidopsis thaliana, together with identification of genes responsible for hydrotropism, will provide a potent tool for molecular dissection of this phenomenon. Accordingly, we recently developed systems to study hydrotropism in A. thaliana and found that the roots exhibited a hypersensitive response to moisture gradients, displaying an unequivocal hydrotropism that readily overcame the gravitropic response (13, 14). A genetic screen based on the inability to develop a positive hydrotropic curvature has been performed in A. thaliana and successfully isolated no hydrotropic response 1 (nhr1), which showed impaired hydrotropism (15, 16). However, the gene responsible for the mutation has not yet been identified, and it is unlikely that nhr1 solely governs this response, as discussed below. Here, we describe a previously uncharacterized hydrotropic mutant of A. thaliana and a gene essential for hydrotropism but not for other tropic responses in roots.
Results and Discussion
When A. thaliana roots were exposed to a moisture gradient established between 1% (wt/vol) agar plates and a saturated solution of K2CO3 in a closed acrylic chamber, roots of wild-type (WT) Columbia plants bent hydrotropically toward the agar, although they did not show this hydrotropic response in a humidity-saturated chamber (13) (Fig. 1A). The hydrotropic curvature commenced within 30 min and continued to develop thereafter (13). That is, A. thaliana roots growing downward deviate from plumb by overcoming gravitropism soon after exposure to a moisture gradient established perpendicular to the direction of gravity. Using this system, we screened ≈20,000 M2 plants of Columbia-background trichomeless A. thaliana glabra1 (gl1) plants mutagenized by treatment with ethylmethanesulfonate. The A. thaliana trichome is an appendage of the epidermis, consisting of a stalk topped by three or four branches. A. thaliana gl1 was used because the trichomeless trait is advantageous in identifying hybrids in crossing experiments (17, 18). The trichomeless trait of gl1 did not affect either hydrotropism or elongation growth, and the WT trichome trait ultimately was recovered by the isolated mutants during back-crossings to Columbia plants. After the first screening, we further screened the M3 putative mutants and successfully isolated hydrotropic mutants of A. thaliana whose roots exhibited impaired or altered hydrotropism. We named the mutants mizu-kussei (miz); “mizu” and “kussei” are the words for “water” and “tropism,” respectively, in Japanese. Among the mutants obtained, miz1 appeared to be defective in hydrotropism (Fig. 1 B–E). When the miz1 mutant was crossed with WT, analysis of the resulting F1 and F2 seedlings suggested that the miz1 phenotype resulted from the mutation of a single recessive gene [supporting information (SI) Table 1].
Fig. 1.

Hydrotropism, elongation growth, and morphological features of miz1 and WT (Columbia) roots. (A) Experimental system for the study of hydrotropism. A saturated solution of K2CO3 in a plastic container was set on the floor of a closed acrylic chamber. A. thaliana seedlings were placed on the edge of an agar plate so that their root tips (≈0.2 to 0.3 mm in length) were suspended in air. Moisture gradients established between the saturated solution and the agar plate in this closed chamber have been described previously (13). (B and C) Time course of hydrotropic curvature and elongation growth of miz1 and WT roots. The curvature (B) and increment of elongation growth (C) were measured at 0, 2, 4, 8, and 12 h after the start of hydrotropic stimulation. Open circles, WT; filled circles, miz1. Each data point is the average of measurements of 60 individuals from three independent experiments. Error bars represent SE. Asterisks indicate statistically significant differences in the means, as determined by Student's t test (∗, P < 0.05; ∗∗, P < 0.01). (D and E) Hydrotropic curvature of WT (D) and miz1 (E) roots at 0, 2, 4, 8, and 12 h after the start of hydrotropic stimulation. The arrow (g) indicates the direction of gravitational force. (F) Seedling, 4-day-old WT. (G) Seedling, 4-day-old miz1. (H) Root tip, 4-day-old WT. (I) Root tip, 4-day-old miz1. (J) Inflorescence, 4-week-old WT. (K) Inflorescence, 4-week-old miz1. (Scale bars: D and E, 1 mm; F and G, 2 mm; H and I, 1 mm; J and K, 5 cm.)
In the presence of a moisture gradient, vertically positioned WT roots bent toward the moisture source (agar), deviating 20° to 50° from plumb, within 2 to 4 h of exposure, and reached the bottom surface of the agar by bending ≈90° after 8 to 12 h (Fig. 1 B and D). In contrast, the miz1 mutant showed no hydrotropic response over the 12-h period (Fig. 1 B and E). The miz1 roots tended to bend slightly away from the agar, which could be caused by a decrease in turgor of the lower water-potential side of the root in the absence of a hydrotropic response (Fig. 1 B and E). Over the time course of the experiments, the elongation rate of WT roots was ≈0.05 mm·h−1. The roots of miz1 plants showed an elongation rate similar to that of WT plants (Fig. 1C). When roots were placed entirely on the agar plate in humid air, the elongation rate was ≈0.10 mm·h−1 in both WT and miz1 roots. Thus, although the roots of miz1 plants elongate normally, they are impaired in hydrotropism. No distinct differences in morphological features of either roots or shoots were observed between miz1 and WT plants (Fig. 1 F–K). Additionally, we did not detect any distinct differences in the ultrastructure of the root-tip cells between WT and miz1 seedlings (SI Fig. 6).
A. thaliana roots display phototropism as well as gravitropism and hydrotropism (4–6). The roots display a negative phototropism in response to unilateral illumination of white or blue light. In addition, A. thaliana roots show wavy growth on agar plates when inclined and illuminated from above (2). Although the underlying causes of wavy growth are obscure, several factors, such as tropisms and nutrients, have been suggested to be necessary for the induction of wavy growth (2, 19–21). We therefore examined gravitropism, phototropism, and wavy growth in the miz1 mutant and determined whether the gene is involved in tropic responses other than hydrotropism. The gravitropic downward curvature of WT and miz1 roots was 30° to 50° at 4 h after gravistimulation, reaching ≈60° by 12 h (Fig. 2A). The gravitropic response did not differ between miz1 and WT plants. We compared the minimum length of time of gravistimulation required to induce gravitropic curvature (presentation time) according to the method of Vitha et al. (22) and found that the presentation time did not differ between miz1 and WT plants (data not shown). These results imply that miz1 roots respond normally to gravity. Because downward growth of the gravitropically responding roots could influence the hydrotropic curvature, we next clinorotated miz1 and WT roots in the presence of a moisture gradient and examined their hydrotropic responses. As shown in Fig. 2B, clinorotated WT roots showed an enhanced hydrotropic response probably because of the absence of gravitropic interference, whereas those of miz1 did not show any hydrotropic response. These results confirm that miz1 roots are impaired in hydrotropism, independent of the gravitropic response.
Fig. 2.

Gravitropism, hydrotropism, phototropism, and wavy growth of miz1 and WT (Columbia) roots. (A) Root gravitropism. (B) Hydrotropic responses of clinorotated roots. (C) Root phototropism. (D) Hypocotyl phototropism. Curvature was measured at 0, 2, 4, 8, and 12 h after gravitropic or phototropic stimulation (A, C, and D) and at 4 and 8 h after hydrotropic stimulation (B). Open circles and bars, WT; filled circles and bars, miz1. (E and F) Wavy growth response of miz1 and WT roots. Roots of WT (E) and miz1 (F) were photographed 2 days after the start of treatment. The arrowhead indicates the position of the root tips when treatment was initiated. (Scale bar: 10 mm.) (G) Quantitation of the amplitude and pitch of the waves. (H) Growth, amplitude, and pitch of miz1 roots (filled bar) relative to those of WT (open bar). The data in A, B, C, and D are the means of measurements from 62, 30, 62, and 64 individuals, respectively, from three independent experiments. The data in H are the means of measurements of >35 individuals from four independent experiments. Error bars represent SE. The asterisks indicate statistically significant differences, as determined by Student's t test (∗, P < 0.05; ∗∗, P < 0.01).
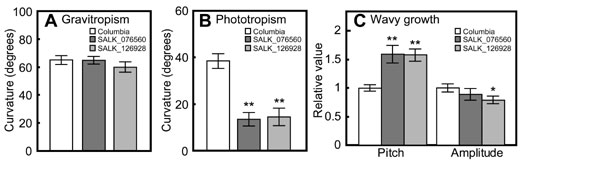
The phototropic curvature of WT plants was ≈15° by 4 h, increasing to ≈35° by 12 h from the start of phototropic stimulation (Fig. 2C). The miz1 roots did display a distinct phototropic curvature, but the response was of lesser magnitude than WT roots (Fig. 2C). Clinorotation of seedlings resulted in an acceleration of the phototropic response in miz1 roots, as reported for WT roots (23), but the phototropic curvature of the clinorotated miz1 roots still was smaller than that of the WT roots (data not shown). The phototropic response of hypocotyls did not differ between miz1 and WT seedlings (Fig. 2D). Similarly, miz1 plants exhibited wavy growth response, although the waves produced by miz1 roots developed smaller amplitude than those of WT roots (Fig. 2 E–H). Thus, miz1 roots exhibit slightly reduced phototropism and a modified wavy growth response. Using the T-DNA insertion lines described below, we further verified that knockout and knockdown mutants of MIZ1 showed phenotypes similar to that of miz1. Specifically, their roots responded normally to gravity but showed a reduced phototropism and a modified wavy growth response (SI Fig. 7). Recently, Santner and Watson (24) suggested that gravitropism is not required for the wavy growth response. This conclusion is in agreement with the observation that miz1 roots show a modified wavy growth response but their gravitropic response is identical to that of WT roots. Nevertheless, an involvement of MIZ1 in the wavy growth response cannot be ruled out because the hydrotropic response is enhanced in the A. thaliana mutant wav2-1 and wav3-1, which display an accelerated wavy root growth response (13). Although we do not currently know the causes of the partially modified phototropism and wavy growth response, MIZ1 could play roles in different steps in the mechanisms for hydrotropism, phototropism, and wavy growth response in roots.
The A. thaliana mutant miz1 is unique because the roots are impaired in hydrotropism but exhibit normal gravitropism and elongation growth. This feature is in contrast to the previously reported ahydrotropic mutant nhr1, in which the homozygous mutant showed severely damaged elongation growth (15, 16). In addition, compared with miz1, root gravitropism of the nhr1 mutant occurs at a significantly faster rate, and the root-tip cells are disorganized and have unusually large amyloplasts (15, 16). The hydrotropic response of A. thaliana involves degradation of amyloplasts in the root-cap cells (14). Because starch-containing amyloplasts are required for sensing gravity, this degradation of amyloplasts is thought to play a key role in negating gravisensing and might be the mechanism underlying hydrotropism-dependent growth (14). Our observations have indicated that the root-tip cells of the miz1 mutant are similar to those of the WT, as is the amyloplast degradation upon hydrostimulation (SI Figs. 6 and 8). These results suggest that miz1 carries a mutation at a locus distinct from nhr1. Indeed, NHR1 was mapped to chromosome 3 (15), which is different from the MIZ1 chromosomal location, as shown below. Thus, we conclude that the miz1 mutant is a previously uncharacterized hydrotropic mutant of A. thaliana.
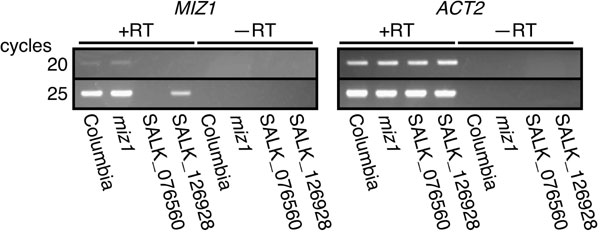
Because MIZ1 seemed to be a previously uncharacterized gene that appeared to mediate hydrotropism separately from other tropic responses, we conducted a map-based cloning of miz1 to identify the mutated gene. The site of the miz1 mutation was mapped to the region between two simple sequence-length polymorphism markers, CER448983 and CER458027 (Fig. 3). The distance between the markers is 220 kbp and contains 50 predicted genes. Sequencing ORFs from these candidate genes in miz1 plants revealed that the nucleotide sequences of two genes, At2g41570 and At2g41660, differed from the published Columbia sequences (25) (Fig. 3). We found a single base change in each of the genes, the substitution of A for G, at the nucleotide positions 439 and 704 in At2g41570 and in At2g41660, respectively. Replacement of a single amino acid in each of the gene products was predicted from the nucleotide substitutions: Gly147Arg in At2g41570 and Gly235Glu in At2g41660. To verify which gene complements miz1, the corresponding genomic regions of each gene were introduced into miz1 plants. All At2g41660-transformed lines of miz1 plants showed positive hydrotropism in response to moisture gradients, and the hydrotropic curvature was similar to WT (Fig. 4A). Transformed lines carrying At2g41570 or vector alone did not rescue the hydrotropic response of miz1 plants (Fig. 4A). To confirm whether At2g41570 or At2g41660 was indeed the MIZ1 gene, T-DNA insertion mutants of these genes were obtained from the Arabidopsis Biological Resource Center and used for hydrotropism assays. SALK_113906, with an insertion in At2g41570, showed a normal hydrotropic response, similar to WT Columbia plants (Fig. 4 B–E). In contrast, roots of both SALK_076560 and SALK_126928, each carrying an insertion in At2g41660, were similar to that of miz1 and did not bend hydrotropically during the 12-h experimental period (Fig. 4 B–G). Our analysis of gene expression showed that SALK_076560 and SALK_126928 were a null mutant and a knockdown mutant, respectively, of MIZ1 (SI Fig. 9). These results demonstrate that the At2g41660 gene is MIZ1 and is indispensable for hydrotropism in roots.
Fig. 3.

Map-based cloning of the miz1 gene. DNA markers, BAC clones, and numbers of recombinants observed for the corresponding marker, as a fraction of the total number of chromosomes, are shown. The 220-kbp map interval in chromosome 2 contains 50 predicted genes. Two mutations were present in miz1, one in At2g41570 and the other in At2g41660. Mutant lines for At2g41570 and At2g41660 are shown with their T-DNA insertion sites: SALK_113906 for At2g41570 and SALK_076560 and SALK_126928 for At2g41660.
Fig. 4.

Complementation test for hydrotropism in miz1 plants with an introduced At2g41570 or At2g41660 gene and hydrotropic response of the T-DNA insertion lines. (A) Complementation of miz1 by introduction of the At2g41570 or At2g41660 gene. Each bar shows curvature of independently generated transgenic plants. (B–G) Hydrotropic curvature of WT (Columbia) (C), miz1 (D), SALK_113906 (At2g41570) (E), SALK_076560 (At2g41660) (F), SALK_126928 (At2g41660) (G), and the mean values (B) at 12 h after hydrotropic stimulation was initiated. (Scale bar: 1 mm.) The arrow (g) indicates the direction of gravitational force. (A and B) Data are means of at least 25 individuals whose curvature was measured 12 h after the start of hydrotropic stimulation. Error bars represent SE.
The MIZ1 gene, At2g41660, contains no introns and encodes a 297-aa protein (The Arabidopsis Information Resource; www.arabidopsis.org). A database search performed by using the BLAST algorithm revealed that a homolog of MIZ1 is encoded in the rice genome (26), suggesting that MIZ1 functions in hydrotropism in both dicotyledonous and monocotyledonous plants. Indeed, hydrotropism also has been reported in monocotyledonous plants (27, 28). MIZ1 contains a previously uncharacterized domain (DUF617) whose function has not yet been defined even though the domain is present in various plant proteins from diverse species (Fig. 3). The miz1 mutation, G704A (Gly235Glu), is located in this undefined domain at the C terminus. We therefore have designated DUF617 the MIZ domain. Interestingly, our database search of ESTs and genomes of moss (Physcomitrella patens) (29), green algae (Chlamydomonas reinhardtii) (30), red algae (Cyanidioschyzon melorae) (31), and cyanobacteria (CyanoBase: The Genome Database for Cyanobacteria; www.kazusa.or.jp/cyano/index.html) showed that this conserved MIZ domain appeared only in the moss genome. MIZ domain homologues were not found in the genomes of animals, including mammals, insects, and fish, or in microbes (National Center for Biotechnology Information; www.ncbi.nlm.nih.gov/BLAST). These data suggest that the function of the protein is specific to terrestrial plants. We found 11 homologues of MIZ1 in the A. thaliana genome and the rice genome as well (SI Figs. 10 and 11). The identities varied from 59% to 34% among the homologues.
Fig. 5 shows the location of β-glucuronidase (GUS) activity in 4-day-old seedlings of pMIZ1::GUS transgenic A. thaliana (Columbia). We observed extensive expression of the pMIZ1::GUS fusion gene in the columella cells of the root cap (Fig. 5 A and E), where the moisture-gradient sensing apparatus is thought to reside (10, 11). In contrast, virtually no expression of the fusion gene was observed in the elongation zone of the roots. GUS activity also was observed in the mature region of the roots (Fig. 5 A and D) and in the water-excreting epidermal structures, the hydathodes, of the leaves (Fig. 5 A–C). MIZ1 expression is supported by EST databases that show its expression predominantly in root tissues (32). Furthermore, microarray data by Angelo et al. (The Arabidopsis Information Resource accession no. ExpressionSet 1007966553; www.arabidopsis.org) suggest that MIZ1 expression is up-regulated only in the roots immediately after exposure to abiotic stresses such as osmotic and salt stresses. It therefore is probable that MIZ1 plays a crucial role in sensing moisture gradients in the early phase of a hydrotropic response in roots.
Fig. 5.

Expression of the pMIZ1::GUS fusion gene in 4-day-old A. thaliana (Columbia) seedlings. Extensive GUS activity is observed in the root cap (black arrowhead), the mature region of the root (white arrowhead), and the hydathodes (water-excreting epidermal structures) of the leaves (arrow). Note the strong expression of pMIZ1::GUS in the columella cells but not in the elongation zone of the root. (Scale bars: A, 5 mm; B–D, 500 μm; E, 100 μm.)
Our findings demonstrate that hydrotropism is genetically distinct from other tropic responses and may involve some unique mechanistic components. Functional analysis of MIZ1 will further our understanding of the mechanism of hydrotropism, its relationship to other tropic responses in roots, and the roles of these responses in the evolution of terrestrial plants.
Materials and Methods
Plant Growth Conditions.
A. thaliana (L.) Heynh. seeds were sterilized in a solution containing 5% (vol/vol) sodium hypochlorite and 0.05% (vol/vol) Tween 20 for 5 min, washed with distilled water, and sown on plates containing 0.2% (wt/vol) Gellan Gum (Sigma Chemicals, St. Louis, MO) containing 0.5× Murashige and Skoog (MS) medium (Sigma Chemicals) as described in Takahashi et al. (13). Upon germination, plates were set in a vertical position, allowing the seedlings to grow flush with the surface of the medium. The seedlings then were grown at 23°C under continuous light (80 μmol·m−2·s−1). Seedlings with straight roots (1.0 to 1.5 cm in length) were used for experiments. Once the experiments were completed, seedlings were transplanted onto rock wool bricks supplied with fertilizer (1/1,000 Hyponex solution; Hyponex Japan, Osaka, Japan) and grown until the foliage leaves emerged. They then were transplanted onto a commercial soil composite (Kureha-Engei-Baido; Kureha Chemical Co., Tokyo, Japan) supplemented with vermiculite and grown at 23°C under continuous light.
Stimulation by Moisture Gradients.
Roots were stimulated hydrotropically according to the methods of Takahashi et al. (13), with slight modifications. In brief, to induce hydrotropism, a moisture gradient was established between 1% (wt/vol) agar plates (Wako Chemical Co., Osaka, Japan) and a saturated solution of K2CO3 in a closed acrylic chamber. The seedlings were placed on plates positioned vertically in the chamber, with their root tips (≈0.2 to 0.3 mm in length) suspended freely from the edge of the agar, after which the chambers were placed in the dark at 24°C. All seedlings were photographed under a stereomicroscope (SZH-ILLB; Olympus, Tokyo, Japan), and measurements of root growth and hydrotropic curvature were performed by using the Mac Scope (version 2.5) image-analyzing software (Mitani Corporation, Fukui, Japan). For some experiments, hydrotropically responding roots were rotated on two-axis clinostat to examine the gravitropic effect on hydrotropism. A moisture gradient for the clinorotating experiment was established by placing a strip of filter paper absorbing saturated solution of K2CO3 on the inner surface, opposite to the agar side, of the container mentioned above. By this means, seedlings were clinorotated in the presence of moisture gradient and subjected to the measurement of hydrotropic curvature after 4 or 8 h of stimulation.
Screening of the Hydrotropic Mutants.
To isolate hydrotropic mutants of A. thaliana, we used ≈20,000 M2 seeds of a trichomeless mutant, gl1, with a Columbia background, mutagenized by treatment with ethylmethanesulfonate (Lehle Seeds, Round Rock, TX). The seedlings were stimulated hydrotropically for 24 h, and those that responded poorly to the moisture gradient were transplanted to generate self-fertilized M3 progenies. The M3 seedlings were examined in the same manner except that hydrotropic responses were observed at 4 h after exposure to the moisture gradient. To confirm transmission of the mutant phenotype, at least 30 M3 seedlings were examined for each progeny. After sampling, the hydrotropic curvatures were analyzed as described above, and mutant strains (miz) of interest were transplanted to obtain progenies.
Genetic crosses were conducted by hand-pollination using emasculated immature flowers, and phenotypes of the resulting F1 and F2 seedlings were examined. Also, miz1 mutant was back-crossed with the WT more than three times before the mutant phenotypes were compared with those of WT.
Gravitropism, Phototropism, and Wavy Growth Assays.
For gravitropism assays, seedlings were placed vertically on 1% (wt/vol) agar plates and reoriented at an angle of 90° before incubation in the dark. For phototropism assays, seedlings were arrayed vertically on 1% (wt/vol) agar plates and illuminated unilaterally with white light (85 μmol·m−2·s−1). For the induction of wavy growth, seedlings were arrayed vertically on 1% (wt/vol) agar plates of 0.5× MS medium containing 1.5% (wt/vol) sucrose. The plates then were inclined at an angle of 45° and illuminated from above with white light (45 μmol·m−2·s−1). All incubations were performed at 24°C. After each experiment, seedlings were photographed, and root growth, gravitropic and phototropic curvatures, as well as frequencies and amplitudes of the waves were analyzed from the resulting photomicrographs with Mac Scope version 2.5 software.
Map-Based Cloning of miz1 Mutation.
The miz1 homozygous mutant (ecotype Columbia) was crossed with Landsberg erecta WT plants to generate a mapping population. In the F2 generation, seedlings bearing a miz1 phenotype were selected by impairment of hydrotropic response at 12 h after exposure to moisture gradients, and then their genomic DNA was isolated from the leaf tissues. Cut leaves were ground with a pestle (Scientific Specialties Inc., Lodi, CA) and were resuspended in 200 μl of extraction buffer (200 mM Tris·HCl/250 mM NaCl/25 mM EDTA/0.5% SDS, pH 7.5). After the addition of 400 μl of ethanol, precipitated DNA was collected by centrifugation at 20,400 × g for 5 min at 4°C. After air-drying the DNA, samples were dissolved in 200 μl of TE buffer (10 mM Tris·HCl/1 mM EDTA, pH 8.0). The polymorphism between Columbia and Landsberg erecta was analyzed by using a combination of cleaved amplified polymorphic sequence and simple sequence-length polymorphism markers with data obtained from The Arabidopsis Information Resource (www.arabidopsis.org) and the Monsanto Arabidopsis polymorphism and Ler sequence collection (33). For rough mapping, ≈20 recombinant F2 seedlings with the miz1 phenotype were analyzed. For fine-scale mapping, DNA was isolated from ≈600 recombinant F2 seedlings with the miz1 phenotype. PCR amplification of DNA fragments was performed by standard procedures using EX Taq polymerase (TaKaRa, Ohtsu, Japan). To analyze the cleaved amplified polymorphic sequence markers, amplified fragments were digested further with the appropriate enzyme for 3 h. All fragments were run on agarose gels, stained with ethidium bromide, and visualized by UV illumination. Nucleotide sequences were determined by using the BigDye Terminator version 1.1 Cycle Sequencing Kit (Applied Biosystems, Foster City, CA) and a DNA sequencer (ABI PRISM 310 Genetic Analyzer; Applied Biosystems).
Complementation Tests.
Because sequence analyses revealed that miz1 plants carried two mutations located close together in the A. thaliana genome, we performed complementation analyses on the two genomic regions corresponding to the mutated genes At2g41570 and At2g41660. The genomic regions for At2g41570 and At2g41660 were amplified by PCR as follows. The respective sequences of the upstream and downstream oligonucleotide primers were 5′-ACTCTCTGTTTTCACAGAGACAAACTTCGC-3′ and 5′-AACTGAAGAAGATTGATTATCCAGAAAACC-3′ for At2g41570 and 5′-ATTTTTATTGATGCTTATCTCTCTCTGCTT-3′ and 5′-AAGGTTTTACAGCTCGTCACGCAA-AATAAA-3′ for At2g41660. For PCR amplification, the genomic DNA of WT A. thaliana (Columbia) was denatured at 94°C for 2 min in the first cycle and then for 15 sec in subsequent cycles. Primer annealing reactions were carried out at 65°C for 30 sec, and extension reactions were performed at 68°C for 3 min for At2g41570 and for 12 min for At2g41660. After 35 cycles, PCR products for At2g41570 (2.6 kbp) and At2g41660 (9.6 kbp) were subcloned into the pPCR-Script Amp SK+ vector (Stratagene, La Jolla, CA), according to the manufacturer's instructions. The inserts then were sequenced as described above. Both the 2.6-kbp and 9.6-kbp fragments were released with KpnI and SacI digestion from the pPCR-Script Amp SK+/At2g41570 and pPCR-Script Amp SK+/At2g41660 vectors and inserted into the KpnI–SacI site of the binary plant transformation vector pPZP211 (34). Each construct was introduced into Agrobacterium tumefaciens strain GV3101 and then transformed into the miz1 mutant by the floral dip method (35). T1 plants were selected by their resistance to kanamycin. The presence of the transgene in these plants was checked by PCR amplification of the NPTII gene. To investigate the phenotype of the transformed plants, 4-day-old seedlings of T2 lines were stimulated hydrotropically for 12 h, and their responses were monitored under a stereomicroscope (SZH-ILLB; Olympus). After photographing, the seedlings were transplanted to isolate genomic DNA for genotyping.
Screening of T-DNA Insertion Lines.
Seeds of A. thaliana lines containing T-DNA insertions in either At2g41660 or At2g41570 gene were obtained from the Salk collection via the Arabidopsis Biological Resource Center (Ohio State University, Columbus, OH). PCR-based screening was used to identify individuals homozygous for T-DNA insertions in At2g41570 and At2g41660 genes. The insertion regions were amplified by PCR as follows. Oligonucleotide primers were 5′-AAGGGCAATCAGCTGTTGCC-3′ for T-DNA left-border primer, 5′-AAGATAGCATCTTGTGTGGG-3′ and 5′-AATTCATGGTCTCCATGAGG-3′ for At2g41570, and 5′-CGTCAAAGAGATGTCGTCGG-3′ and 5′-TTATCTAAACCGCTCGCTGC-3′ for At2g41660 (gene-specific primers). PCR amplifications of DNA fragments were performed by standard procedure using EX Taq polymerase. The insertion sites of T-DNA were confirmed by sequencing the PCR products with the T-DNA left-border primers.
Expression Analyses of pMIZ1::GUS Fusion Gene.
A DNA fragment containing the 3,397-bp upstream region of At2g41660 (MIZ1) start codon was amplified by PCR as follows. Oligonucleotide primers were 5′-ATTTTTATTGATGCTTATC-TCTCTCTGCTT-3′ and 5′-TCTAGCTAGCAAGAGGTGTGGCCGATTTGT-3′. For PCR amplification, the pPCR-Script Amp SK+/At2g41660 vector was denatured at 94°C for 2 min in the first cycle and then for 15 sec in subsequent cycles. Primer annealing reactions were carried out at 55°C for 30 sec, and extension reactions were performed at 68°C for 4 min. The PCR fragment was digested with NheI and cloned into the XbaI–HindIII blunt-ended fragment of the GUS expression vector pBI121 (36). The construct pMIZ1::GUS was transferred into A. tumefaciens LBA4404 and transformed to the WT A. thaliana (Columbia) by the floral dip method (35). For histochemical observation of GUS activities in the transgenic plants, seedlings were incubated in staining buffer [100 mM Na2PO4 buffer, pH 7.0/0.5 mM K3Fe(CN)6/0.5 mM K4Fe(CN)6/0.5% Triton X-100/1.6% HistoChoice (Amresco, Solon, OH)/2 mM 5-bromo-4-chloro-3-indolyl glucuronide] at 37°C, washed with sodium phosphate buffer at pH 7.0, and cleared with a mixture of chloral hydrate, glycerol, and water (8:1:2; wt/vol/vol) after overnight incubation in 95% ethanol. Seedlings were mounted on slide glasses, observed under a microscope (IX-71; Olympus), and photographed with a camera (DP70; Olympus).
Supplementary Material
Acknowledgments
We thank Prof. Kiyotaka Okada of Kyoto University (Kyoto, Japan) and Prof. Masao Tasaka of the Nara Institute of Science and Technology (Nara, Japan) for their helpful discussions and critical reading of our manuscript. This work was supported by a grant from the Takeda Science Foundation, Grant-in-Aid for Scientific Research (B) 16380166 from the Japan Society for the Promotion of Science (JSPS); Grant-in-Aid for Scientific Research on Priority Areas 17051003 from the Ministry of Education, Culture, Sports, Science, and Technology of Japan (to H.T.); a grant from the Program for Promotion of Basic Research Activities for Innovative Biosciences (PROBRAIN) (to Y.M.); and a JSPS Research Fellowship for Young Scientists (to A.K.). This study also was carried out as part of the “Ground-Based Research Announcement for Space Utilization,” promoted by the Japan Space Forum.
Abbreviation
- GUS
β-glucuronidase.
Footnotes
The authors declare no conflict of interest.
This article is a PNAS direct submission.
See Commentary on page 4247.
This article contains supporting information online at www.pnas.org/cgi/content/full/0609929104/DC1.
References
- 1.Darwin C, Darwin F. The Power of Movement in Plants. London: John Murray; 1880. [Google Scholar]
- 2.Okada K, Shimura Y. Science. 1990;250:274–276. doi: 10.1126/science.250.4978.274. [DOI] [PubMed] [Google Scholar]
- 3.Takahashi H. J Plant Res. 1997;110:163–169. doi: 10.1007/BF02509304. [DOI] [PubMed] [Google Scholar]
- 4.Kiss JZ. CRC Crit Rev Plant Sci. 2000;19:551–573. doi: 10.1080/07352680091139295. [DOI] [PubMed] [Google Scholar]
- 5.Sakai T, Wada T, Ishiguro S, Okada K. Plant Cell. 2000;12:225–236. doi: 10.1105/tpc.12.2.225. [DOI] [PMC free article] [PubMed] [Google Scholar]
- 6.Kiss JZ, Miller KM, Ogden LA, Roth KK. Plant Cell Physiol. 2002;43:35–43. doi: 10.1093/pcp/pcf017. [DOI] [PubMed] [Google Scholar]
- 7.Massa GD, Gilroy S. Plant J. 2003;33:435–445. doi: 10.1046/j.1365-313x.2003.01637.x. [DOI] [PubMed] [Google Scholar]
- 8.Muday GK. J Plant Growth Regul. 2001;20:226–243. doi: 10.1007/s003440010027. [DOI] [PubMed] [Google Scholar]
- 9.Perrin RM, Young LS, Murthy N, Harrison BR, Wang Y, Will JL, Masson PH. Ann Bot. 2005;96:737–743. doi: 10.1093/aob/mci227. [DOI] [PMC free article] [PubMed] [Google Scholar]
- 10.Jaffe MJ, Takahashi H, Biro RL. Science. 1985;230:445–447. doi: 10.1126/science.230.4724.445. [DOI] [PubMed] [Google Scholar]
- 11.Takahashi H, Suge H. Physiol Plant. 1991;82:24–31. [Google Scholar]
- 12.Takahashi H, Takano M, Fujii N, Yamashita M, Suge H. J Plant Res. 1996;109:335–337. doi: 10.1007/BF02344481. [DOI] [PubMed] [Google Scholar]
- 13.Takahashi N, Okada K, Goto N, Takahashi H. Planta. 2002;216:203–211. doi: 10.1007/s00425-002-0840-3. [DOI] [PubMed] [Google Scholar]
- 14.Takahashi N, Yamazaki Y, Kobayashi A, Higashitani A, Takahashi H. Plant Physiol. 2003;132:805–810. doi: 10.1104/pp.018853. [DOI] [PMC free article] [PubMed] [Google Scholar]
- 15.Eapen D, Barroso ML, Campos ME, Ponce G, Corkidi G, Dubrovsky JG, Cassab GI. Plant Physiol. 2003;131:536–546. doi: 10.1104/pp.011841. [DOI] [PMC free article] [PubMed] [Google Scholar]
- 16.Eapen D, Barroso ML, Ponce G, Campos ME, Cassab GI. Trends Plants Sci. 2005;10:44–50. doi: 10.1016/j.tplants.2004.11.004. [DOI] [PubMed] [Google Scholar]
- 17.Liu J, Zhu J-K. Proc Natl Acad Sci USA. 1997;94:14960–14964. doi: 10.1073/pnas.94.26.14960. [DOI] [PMC free article] [PubMed] [Google Scholar]
- 18.Frank M, Rupp H-M, Prinsen E, Motyka V, Van Onckelen H, Schmülling T. Plant Physiol. 2000;122:721–729. doi: 10.1104/pp.122.3.721. [DOI] [PMC free article] [PubMed] [Google Scholar]
- 19.Tian O, Reed JW. Development (Cambridge, UK) 1999;126:711–721. doi: 10.1242/dev.126.4.711. [DOI] [PubMed] [Google Scholar]
- 20.Buer CS, Masle J, Wasteneys GO. Plant Cell Physiol. 2000;41:1164–1170. doi: 10.1093/pcp/pcd042. [DOI] [PubMed] [Google Scholar]
- 21.Mochizuki S, Harada A, Inada S, Shirasu SK, Stacey N, Wada T, Ishiguro S, Okada K, Sakai T. Plant Cell. 2005;17:537–547. doi: 10.1105/tpc.104.028530. [DOI] [PMC free article] [PubMed] [Google Scholar]
- 22.Vitha S, Zhao L, Sack FD. Plant Physiol. 2000;122:453–461. doi: 10.1104/pp.122.2.453. [DOI] [PMC free article] [PubMed] [Google Scholar]
- 23.Correll MJ, Kiss JZ. J Plant Growth Regul. 2002;21:89–101. doi: 10.1007/s003440010056. [DOI] [PubMed] [Google Scholar]
- 24.Santner AA, Watson JC. Plant J. 2006;45:752–764. doi: 10.1111/j.1365-313X.2005.02641.x. [DOI] [PubMed] [Google Scholar]
- 25.The Arabidopsis Genome Initiative. Nature. 2000;408:796–815. doi: 10.1038/35048692. [DOI] [PubMed] [Google Scholar]
- 26.Altschul SF, Gish W, Miller W, Myers EW, Lipman DJ. J Mol Biol. 1990;215:403–410. doi: 10.1016/S0022-2836(05)80360-2. [DOI] [PubMed] [Google Scholar]
- 27.Takahashi H, Scott TK. Plant Physiol. 1991;96:558–564. doi: 10.1104/pp.96.2.558. [DOI] [PMC free article] [PubMed] [Google Scholar]
- 28.Oyanagi A, Takahashi H, Suge H. Ann Bot. 1995;75:229–235. [Google Scholar]
- 29.Nishiyama T, Fujita T, Shin-i T, Seki M, Nishide H, Uchiyama I, Kamiya A, Carninci P, Hayashizaki Y, Shinozaki K, et al. Proc Natl Acad Sci USA. 2003;100:8007–8012. doi: 10.1073/pnas.0932694100. [DOI] [PMC free article] [PubMed] [Google Scholar]
- 30.Asamizu E, Nakamura Y, Miura K, Fukuzawa H, Fujiwara S, Hirono M, Iwamoto K, Matsuda Y, Minagawa J, Shimogawara K, et al. Phycologia. 2004;43:722–726. [Google Scholar]
- 31.Matsuzaki M, Misumi O, Shin-i T, Maruyama S, Takahara M, Miyagishima S, Mori T, Nishida K, Yagisawa F, Nishida K, et al. Nature. 2004;428:653–657. doi: 10.1038/nature02398. [DOI] [PubMed] [Google Scholar]
- 32.Birnbaum K, Shasha DE, Wang JY, Jung JW, Lambert GM, Galbraith DW, Benfey PN. Science. 2003;302:1956–1960. doi: 10.1126/science.1090022. [DOI] [PubMed] [Google Scholar]
- 33.Jander G, Norris SR, Rounsley SD, Bush DF, Levin IM, Last RL. Plant Physiol. 2002;129:440–450. doi: 10.1104/pp.003533. [DOI] [PMC free article] [PubMed] [Google Scholar]
- 34.Hajdukiewicz P, Svab Z, Maliga P. Plant Mol Biol. 1994;25:989–994. doi: 10.1007/BF00014672. [DOI] [PubMed] [Google Scholar]
- 35.Clough SJ, Bent AF. Plant J. 1998;16:735–743. doi: 10.1046/j.1365-313x.1998.00343.x. [DOI] [PubMed] [Google Scholar]
- 36.Jefferson RA, Kavanagh TA, Bevan MW. EMBO J. 1987;6:3901–3907. doi: 10.1002/j.1460-2075.1987.tb02730.x. [DOI] [PMC free article] [PubMed] [Google Scholar]
Associated Data
This section collects any data citations, data availability statements, or supplementary materials included in this article.