

Abstract
Chronic HIV infection is associated with T cell abnormalities and altered effector function. Regulatory T cells (Treg) are CD4+ T cells that play a critical role in regulating the immune system. The impact of regulatory T cells on HIV infection and disease progression may be highly significant. We hypothesize that chronic antigenic stimulation from a persistent, high viraemic state may promote a population of Treg that contributes to HIV-associated immune dysfunction. We evaluated the pattern of Treg in chronically infected, HIV-positive individuals over a course of 6 months. Treg are depleted at a distinct rate from that of absolute CD4 cells and loss of Treg is slower in the presence of viral suppression. In vitro depletion of CD25+ CD4+ cells resulted in increased Gag-specific CD4 and CD8 responses. A significant correlation between ex vivo measurement of Treg and Gag-specific CD4 T cell responses was observed (r = −0·41, P = 0·018) with a trend observed with Gag-specific CD8 T cell responses (P = 0·07). The impact of HIV infection on the Treg population directly complicates the measured effect of Treg on the immune dysfunction although our data support the important role of Treg on modulating the effector T cell response in chronic infection.
Keywords: HIV, regulatory T cells, effector T cells, viraemia
Introduction
T regulatory cells (Treg) may influence the immune response to infectious pathogens [1–3]. The origin and identification of Treg and their mechanism of action remain to be fully explored. The level of Treg generated may determine the delicate balance between immunoprotection or the establishment of chronic disease [1,2]. This level of complexity is augmented further in defining their role in HIV infection and whether Treg play a protective or detrimental role in HIV disease remains unresolved.
We have proposed previously that Treg contribute to an altered suppressor-to-helper function ratio, as Treg appear to decline at a different rate compared to other CD4+ T cells in HIV infection. Expansion of Treg in HIV infection could hypothetically decrease the magnitude of T cell responses in viraemic patients and make them more susceptible to other pathogens. Alternatively, Treg may have a protective effect and limit the immunopathology caused by persistent viraemia. Thus, the impact of Treg infection may depend intricately on the extent of HIV infection. We examine the role Treg in HIV immune suppression and assessed Treg depletion in the presence or absence of viraemia.
Materials and methods
Study population
HIV-1 positive volunteers (n = 125) were recruited from the Research on Access to Care in the Homeless (REACH) Cohort in San Francisco. REACH is a prospective cohort of HIV positive homeless and marginally housed adults. All consenting participants were tested for HIV and those found to be positive were recruited for follow-up. The clinical characteristics of the REACH cohort have been described previously [4]. Institutional Review Board approvals were obtained from the California Department of Health Services and the University of California, San Francisco for this study and blood samples were obtained at enrolment and after 6 months. A summary of the clinical characteristics of study participants is shown in Table 1. All HIV-1-positive volunteers who received anti-retroviral treatment (ARV; n = 66) have maintained complete virological response (HIV plasma RNA < 400 copies/ml) at least 24 weeks prior to evaluation. Isolation of peripheral blood mononuclear cells (PBMC) was performed by Ficoll-Hypaque (Amersham, Upsala, Sweden) density centrifugation and cryopreserved PBMC obtained at the initial enrolment were used subsequently for functional assays.
Table 1.
Summary of clinical characteristics of study participants.a
| HIV positive | Ageb (years) | CD4 countb (count/mm3) | HIV plasma RNAb (copies/ml) | CD4 countc (count/mm3) | HIV plasma RNAc (copies/ml) |
|---|---|---|---|---|---|
| Not receiving ARV (n = 59) | 56 (27–61) | 408 (100–969) | 19 000 (2300–154 000) | 389 (111–1084) | 20 500 (3500–100 000) |
| On ARV (n = 66)d | 49 (31–70) | 458 (74–1368) | Not detectable | 474 (140–1488) | Not detectable |
| P = | n.s. | n.s. | < 0·001 | n.s. | < 0·001 |
Clinical characteristics at time of blood draw.
Median values and ranges at enrolment.
Median values and ranges at 6 months follow-up.
All volunteers on anti-retroviral treatment (ARV) have achieved complete virological response (VL < 400 copies/ml).
Antigens
Peptides corresponding to the sequences of clade B consensus sequences of HIV-1 for Gag (http://www.hiv.lanl.gov/content/hiv-db/CONSENSUS/M_GROUP/Consensus.html) were synthesized as 15 amino acids (a.a.) overlapping by 11 a.a. (Mitochor Mimotopes, Victoria, Australia). Gag synthetic peptides used for all T cell assays were pooled into one single pool of peptides (total 123), with a final concentration of 1 µg/ml per peptide.
Tregimmunophenotyping
Samples were processed within 3 h of taking blood samples and quantification of Treg was performed by staining with anti-CD62L fluorescein isothiocyanate (FITC), anti-CD25 phycoerythrin (PE), anti-CD3 allophycocyanin (APC), and anti-CD4 peridinin chlorophyll (PerCP)-Cy5·5, as described previously [5]. Analysis was performed by four-colour flow cytometry [fluorescence activated cell sorter (FACS)Calibur, BD Biosciences, San Jose, CA, USA]. Confirmation of co-expression of intracellular forkhead box P3 (Foxp3) expression in the CD25bright population (anti-CD25 CyChrome or APC) was performed in cryopreserved PBMC using flow cytometric detection of intracellular Foxp3 (anti-human Foxp3-PE per manufacturer's directions, eBioscience, San Diego, CA, USA).
Treg depletion
CD25 depletions were performed using anti-CD25 microbeads (Miltenyi Biotech, Auburn, CA, USA). Briefly 107 PBMCs were incubated with 20 µl of anti-CD25 microbeads for 15 min at 4°C. Beads were washed and run through magnetic separation columns twice per sample. The flow-through was collected to obtain a CD25-depleted population; cells were then washed and stained with fluorescent antibodies. All depletions were verified by flow cytometry. Typically this protocol depletes greater than 90% of Treg (data not shown).
Flow-based intracellular cytokine staining
Detection of antigen-specific interferon (IFN)-γ production was performed using PBMC (1 × 10⁶) incubated with Gag or cytomegalovirus (CMV) peptide pools for 2 h at 37°C in 5% CO2 in the presence of co-stimulatory anti-CD49d and anti-CD28 (1 µg/ml, Becton-Dickinson), followed by Brefeldin A for 4 h, as described previously [6]. Staphylococcus enterotoxin B (SEB; 1 µg/ml; Sigma, St. Louis, MO, USA) and media alone were used as positive and negative background controls, respectively. Cells were stained subsequently with anti-interferon (IFN)-γ PE, anti-CD3 PerCP Cy5·5 and anti-CD8 APC Cy7, CD4 PECy7 (BD Pharmingen, San Diego, CA, USA). A minimum of 30 000 CD3+ cells per sample were acquired using a six-colour flow cytometer (LSRII; BD Biosciences, San Jose, CA, USA) and analysis was performed by flowjo software (TreeStar, Ashland, OR, USA). Results were expressed as: percentage IFN-γ positive, CD4+ or CD8+ T cells (percentage positive = % antigen-specific − % negative control). Responses greater than or equal to 0·1% and two times the background were considered positive. Background expression for IFN-γ was < 0·05%. All volunteers demonstrated significant IFN-γ production following SEB stimulation.
Statistical analysis
Statistical analysis was performed with prism software version 4·02 (GraphPad, San Diego, CA, USA). Grouped variables were compared using the paired Student's t-test over the 6-month follow-up visit. Spearman's correlation coefficient was used to determine the correlation between two variables. Statistical significance was defined as P < 0·05.
Results
Treg depletion is distinct from CD4 depletion
We compared the change in pattern of Treg over a period of 6 months in chronically HIV-infected, ARV-untreated individuals (Fig. 1a, c) and those on a stable regimen of ARV (RNA < 400 copies/ml, Fig. 1b, d). We applied ourpreviously validated criteria that include CD4+CD3+CD25brightCD62Lhigh for Treg immunophenotyping in whole blood using preset gating to avoid subjective interpretation [5]. This approach allowed consistent Treg quantification in a large number of individuals over time. Clinical characteristics of treated and untreated individuals over the course of 6 months are described in Table 1. We found a significant decrease in Treg in untreated HIV-infected volunteers over the course of the study (mean difference = 0·49, P = 0·013, Fig. 1c), in contrast to individuals who are virally suppressed (mean difference = 0·16, P = 0·58, Fig. 1d). There was no significant change in the absolute CD4 count during the 6-month period in both untreated or ARV-treated volunteers (P = 0·39 and 0·18, respectively, Fig. 1a,b). Similarly, no significant change in the level of HIV plasma RNA was observed over the 6-month follow-up period in the untreated HIV infected cohort (P = 0·40, data not shown).
Fig. 1.

Distinct pattern of CD4 regulatory T cells depletion in HIV infection. Pattern of CD4 and T regulatory cells (Treg) over the course of 6 months follow-up in anti-retroviral treatment (ARV)-untreated (n = 59) and ARV-suppressed (n = 66) HIV+ individuals. Treg is measured as percentage of CD4+ CD62L+ CD25+. Statistical analysis was performed using paired Student's t-test. Significance is defined as P < 0·05.
Human Treg suppressor activity is confined primarily to CD4+CD25bright cells [7,8], although none of the described individual markers, including CD25 and Foxp3, is specific for Treg. We evaluated Treg based on our initially validated surface immunophenotyping of freshly isolated PBMC. Subsequently intracellular Foxp3 expression using recently available monoclonal antibodies (eBioscience) was assessed in a subset of cryopreserved samples and confirmed that our gated Treg population was enriched in its expression of Foxp3 (data not shown). Because human Foxp3 expression can be up-regulated and mediated by T cell receptor (TCR) stimulation [9–11], we restricted our definition of CD4+ Foxp3+ Treg to CD25bright to minimize overlap with effector T cells. Significant correlation between our fresh PBMC Treg immunophenotyping and subsequent Foxp3 confirmation was observed (n = 23, r = 0·6, P = 0·002, Fig. 2).
Fig. 2.
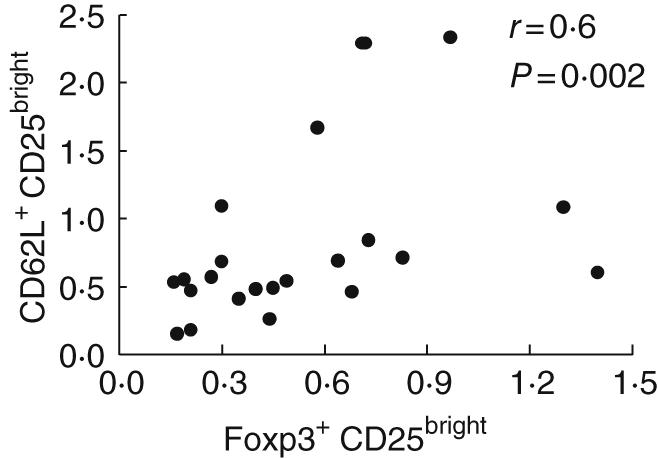
CD4+ CD25+ CD62L+ regulatory T cells express forkhead box P3 (Foxp3). Correlation between T regulatory cells (Treg), as defined by CD4+ CD25bright and CD62Lhigh or CD4+ Foxp3+ CD25bright was performed. Freshly isolated peripheral blood mononuclear cells (PBMC) from HIV-positive volunteers were stained initially with anti-CD62L fluorescein isothiocyanate (FITC), anti-CD25 phycoerythrin (PE), anti-CD3 peridinin chlorophyll (PerCP) cy5·5 and anti-CD4 allophycocyanin (APC) with preset gating. These data were compared subsequently with the more recently available anti-Foxp3 (eBioscience) with cryopreserved PBMC, gating on CD3+ CD4+ Foxp3+ CD25bright. Spearman's correlation was significant (P = 0·002) between Treg immunophenotyping strategies using Foxp3+ and CD25bright or CD62LhighCD25bright.
Treg is negatively associated with presence of HIV-specific CD4 T cell
CD25+ Treg cells have been demonstrated previously to suppress antigen-specific CD4+ T cells against tumours and infections [1,12–14]. High Treg has been associated with lower plasma viraemia and favourable clinical markers [15] and these T cells may be modulated directly by HIV infection [16,17]. We assessed whether the level of Treg in ARV-untreated HIV-positive volunteers (n = 65) correlated with Gag-specific CD4 T cell responses (as measured by intracellular IFN-γ production). The presence of HIV-specific CD4+ T cells is associated negatively with Treg. (Spearman's correlation, r = −0·41, P = 0·018, data not shown). Treg level was significantly lower in individuals with Gag-specific CD4+ T cell response (Fig. 3b, P < 0·001). No correlation was observed with Gag-specific CD4+ T cell responses and CD4 or HIV RNA (Spearman's correlation, P = 0·32 and 0·12, respectively, data not shown).
Fig. 3.
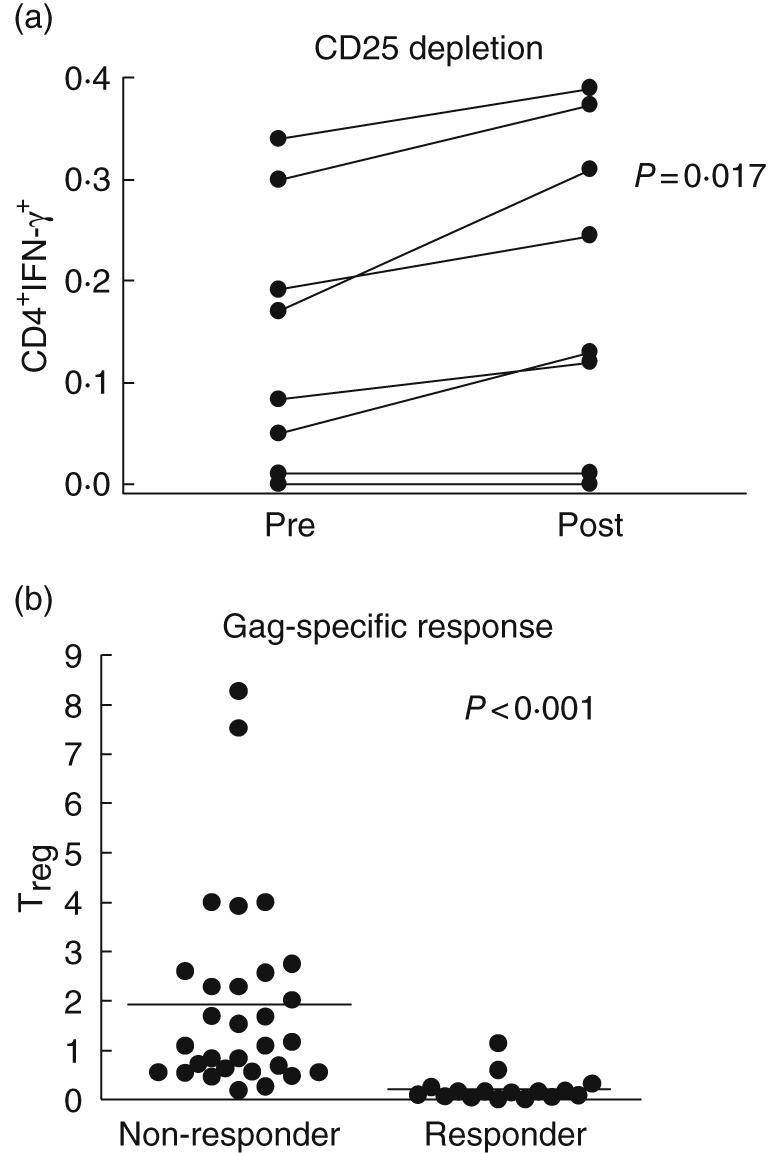
Correlation of HIV-specific CD4+ T cell responses with in vitro depletion and ex-vivo measurement of T regulatory cells (Treg). Peripheral blood mononuclear cells (PBMC) from eight HIV+ anti-retroviral treatment (ARV)-untreated individuals were mock (pre) or CD25 depleted (post) and stimulated with Gag-pooled peptides (a). Samples were first gated on the CD3+/CD4+ lymphocyte population, then the percentage of interferon (IFN)-γ cells was determined. Results were expressed as percentage of Gag-specific CD4+ T cells expressing IFN-γ after subtraction from background. Differences in response to Gag stimulation after Treg depletion were statistically significant by paired t-test (P = 0·017). Level of Treg in ARV-untreated HIV+ volunteers (n = 59) was next assessed and compared for the presence of Gag-CD4 responses (as measured by intracellular IFN-γ production, b). Treg level (expressed as percentage of CD4+ CD62L+ CD25+) was significantly lower (P < 0·001) in individuals with Gag-specific CD4+ T cell response (responders) compared to volunteers without detectable CD4 T cell responses (non-responders).
In vitro Treg depletion increases HIV-specific CD4 T cell responses
Previous studies have shown that in vitro depletion of CD4+ CD25+ Treg cells resulted in increased HIV-specific CD8+ T cells as measured by IFN-γ production [5,18]. We then evaluated whether Treg depletion affects CD4-specific responses. In vitro depletion of CD25 removes > 99% of CD25bright CD4 T cells and > 50% of Foxp3+ CD4 T cells (representative plot in Fig. 4). These findings are consistent within individual samples assayed at separate times. Treg depletion overall leads to a significant increase in Gag-specific CD4+ as well as CD8+ T cell responses as measured by IFN-γ production (Figs 3a and 5a).
Fig. 4.

In vitro depletion of CD25 does not fully remove forkhead box P3 (Foxp3). Representative plot of the effect of CD25 depletions on Foxp3 CD4+ T cells. Briefly, peripheral blood mononuclear cells (PBMC) mock (pre) or CD25 depleted (post) depleted using anti-CD25 microbeads (Miltenyi Biotech, Auburn, CA, USA). Samples were first gated on the CD3+/CD4+ lymphocyte population, then the percentage of CD25+ or Foxp3+ cells was determined. Depletion of greater than 90% of CD25+ and greater than 50% of Foxp3+ CD4+ T cells was observed.
Fig. 5.
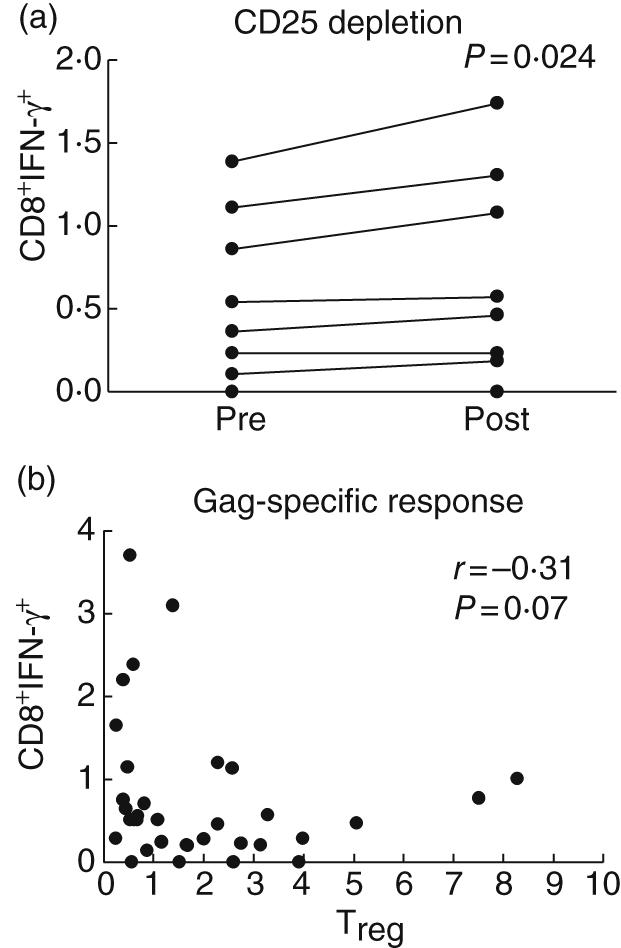
The in vitro and ex vivo effect of T regulatory cells (Treg) and HIV-specific CD8 T cell responses. Treg depletion in 10 HIV+ individuals leads to a significant increase in the percentage of CD8+ T cells as measured by intracellular interferon (IFN)-γ production (a). Peripheral blood mononuclear cells (PBMC) were mock (pre) or CD25 depleted (post) and stimulated with Gag peptides. Samples were first gated on the CD3+/CD8+ lymphocyte population, then the percentage of IFN-γ was determined. Results were expressed as percentage of Gag-specific CD8+ T cells expressing IFN-γ. Significant increase in IFN-γ production after Treg depletion was observed (paired t-test, P = 0·024). Spearman's correlation suggests a negative trend between Treg and HIV-specific CD8 responses (b) as measured by IFN-γ production in response to Gag, although it did not reach statistical significance (r = −0·31, P = 0·07).
Discussion
CD4+CD25+ Treg play a pivotal role in limiting the immunopathology of chronic viral infections from persistent immune stimulation [19]. Thus it is perhaps predictable that their role in the immune responses to HIV infection may be highly relevant. There have been conflicting data regarding the potential role of regulatory T cells in the immunopathogenesis of HIV disease. Some have argued that these regulatory cells prevent or suppress an effective immune response [17], while others have reported a positive association between high Treg and lower viraemia and higher CD4 count [15]. We have found previously that Treg are depleted at a rate distinct from that of CD4 T cells in a population of HIV-infected Ugandans [5]. Our current study demonstrates that the presence of persistent viraemia in chronic HIV infection is associated significantly with the loss of Treg. In contrast, Treg depletion was not observed in individuals receiving highly active ARV treatment with evidence of full viral suppression. We did not observe significant changes in the total CD4 cell count over the course of 6 months, highlighting further the distinct kinetics and mechanism of depletion of Treg population and other CD4+ T cells. HIV preferentially infect Treg in vitro compared to other memory CD4+ T cells [17], and our observed ex vivo findings substantiate direct infection as one viable mechanism for the loss of Treg in chronic infection.
One specific characteristic of CD25+ Treg is their high expression of the Foxp3 transcription factor, which seems to have a key function in programming [20–22]. Although our study design focuses on CD62L+ CD25bright Treg, we confirmed subsequently that these Treg are enriched with intracellular expression of Foxp3 [23,24]. Interestingly, our in vitro CD25 depletion experiments found incomplete removal of Foxp3+ CD4 T cell population, consistent with recent findings of distinct subsets of Foxp3+ Treg[25], and suggest caution in interpreting human Treg function using in vitro depletion data. Whether immunophenotyping techniques such as Foxp3 or the recently described interleukin (IL)-7 receptor (CD127) [26] add sensitivity and specificity to Treg quantification in HIV infection will need to be confirmed in future studies.
The contribution by Treg to the immune dysregulation observed in HIV infection remains unresolved. Although Treg represent only a small subset of total T cells, they exert highly potent inhibitory functions on effector T cells. Previous data have supported the role of Treg in preventing an effective immune response [17,27]. Others have described a significant correlation between high Treg and a favourable clinical profile [15]. Our in vitro depletion data in a subset of individuals suggest the suppressive effect of Treg on CD4 T cell functions. Our ex vivo analyses corroborate further the negative association between Treg and HIV-specific CD4 T cell responses. By what precise mechanisms do Treg target and suppress HIV-specific CD4+ T cells in chronic infection? More importantly, how do they contribute to the observed immune dysfunction? We hypothesize that Treg in chronic HIV infection exert simultaneous and paradoxical regulatory effect. Persistent viraemia induces Treg populations that directly inhibit HIV-specific CD4+ T cells via specific or non-specific interactions. Thus, the loss of Treg associated with HIV disease progression should theoretically diminish the observed suppression of T cells. However, regulatory T cells also moderate the excessive immune activation that have been associated apoptosis/anergy observed in HIV infection [5,17]. Thus, the depletion of Treg could also theoretically promote CD4 T cell apoptosis and eventual loss of CD4 functions. The precise kinetics and mechanism of Treg in HIV infection are probably multi-faceted and remain to be elucidated.
Several limitations exist in our study. Our definition of Treg does not discriminate between subpopulations of CD4+ regulatory T cells with distinct mechanisms of suppression [25,28,29]. Furthermore, our study evaluated only peripherally circulating Treg and cannot account for recruitment or accumulation of Treg at lymphoid sites where viral antigens accumulate [30]. Additionally, our measure of CD4 T cell function was restricted to IFN-γ production, limiting our interpretation of Treg role in CD4 T helper function. Finally, our relatively short follow-up period might not reflect fully the differential kinetics and immune regulatory functions of Treg with HIV disease progression. Despite these limitations, we demonstrate that the depletion of Treg in HIV infection is significantly associated with persistent viraemia, adding further to the complexity of the immune control and dysregulation. A better understanding the mechanistic role of Treg in modulating the immune response at different stages of HIV disease will guide to current and future development of immune therapeutic strategies.
Acknowledgments
This work was supported by NIH grants AI43885, MH54907 and AA015287.
References
- 1.Belkaid Y, Piccirillo CA, Mendez S, Shevach EM, Sacks DL. CD4+CD25+ regulatory T cells control Leishmania major persistence and immunity. Nature. 2002;420:502–7. doi: 10.1038/nature01152. [DOI] [PubMed] [Google Scholar]
- 2.Aseffa A, Gumy A, Launois P, MacDonald HR, Louis JA, Tacchini-Cottier F. The early IL-4 response to Leishmania major and the resulting Th2 cell maturation steering progressive disease in BALB/c mice are subject to the control of regulatory CD4+CD25+ T cells. J Immunol. 2002;169:3232–41. doi: 10.4049/jimmunol.169.6.3232. [DOI] [PubMed] [Google Scholar]
- 3.Rouse BT, Suvas S. Regulatory cells and infectious agents: detentes cordiale and contraire. J Immunol. 2004;173:2211–15. doi: 10.4049/jimmunol.173.4.2211. [DOI] [PubMed] [Google Scholar]
- 4.Moss AR, Hahn JA, Perry S, et al. Adherence to highly active antiretroviral therapy in the homeless population in San Francisco: a prospective study. Clin Infect Dis. 2004;39:1190–8. doi: 10.1086/424008. [DOI] [PubMed] [Google Scholar]
- 5.Eggena MP, Barugahare B, Jones N, et al. Depletion of Regulatory T Cells in HIV Infection Is Associated with Immune Activation. J Immunol. 2005;174:4407–14. doi: 10.4049/jimmunol.174.7.4407. [DOI] [PubMed] [Google Scholar]
- 6.Elrefaei M, Barugahare B, Ssali F, Mugyenyi P, Cao H. HIV-specific IL-10-positive CD8+ T cells are increased in advanced disease and are associated with decreased HIV-specific cytolysis. J Immunol. 2006;176:1274–80. doi: 10.4049/jimmunol.176.2.1274. [DOI] [PubMed] [Google Scholar]
- 7.Baecher-Allan C, Brown JA, Freeman GJ, Hafler DA. CD4+CD25high regulatory cells in human peripheral blood. J Immunol. 2001;167:1245–53. doi: 10.4049/jimmunol.167.3.1245. [DOI] [PubMed] [Google Scholar]
- 8.Cao D, Malmstrom V, Baecher-Allan C, Hafler D, Klareskog L, Trollmo C. Isolation and functional characterization of regulatory CD25brightCD4+ T cells from the target organ of patients with rheumatoid arthritis. Eur J Immunol. 2003;33:215–23. doi: 10.1002/immu.200390024. [DOI] [PubMed] [Google Scholar]
- 9.Walker MR, Kasprowicz DJ, Gersuk VH, et al. Induction of FoxP3 and acquisition of T regulatory activity by stimulated human CD4+CD25- T cells. J Clin Invest. 2003;112:1437–43. doi: 10.1172/JCI19441. [DOI] [PMC free article] [PubMed] [Google Scholar]
- 10.Morgan ME, van Bilsen JH, Bakker AM, et al. Expression of FOXP3 mRNA is not confined to CD4+CD25+ T regulatory cells in humans. Hum Immunol. 2005;66:13–20. doi: 10.1016/j.humimm.2004.05.016. [DOI] [PubMed] [Google Scholar]
- 11.Roncador G, Brown PJ, Maestre L, et al. Analysis of FOXP3 protein expression in human CD4+CD25+ regulatory T cells at the single-cell level. Eur J Immunol. 2005;35:1681–91. doi: 10.1002/eji.200526189. [DOI] [PubMed] [Google Scholar]
- 12.Hori S, Carvalho TL, Demengeot J. CD25+CD4+ regulatory T cells suppress CD4+ T cell-mediated pulmonary hyperinflammation driven by Pneumocystis carinii in immunodeficient mice. Eur J Immunol. 2002;32:1282–91. doi: 10.1002/1521-4141(200205)32:5<1282::AID-IMMU1282>3.0.CO;2-#. [DOI] [PubMed] [Google Scholar]
- 13.Montagnoli C, Bacci A, Bozza S, et al. B7/CD28-dependent CD4+CD25+ regulatory T cells are essential components of the memory-protective immunity to Candida albicans. J Immunol. 2002;169:6298–308. doi: 10.4049/jimmunol.169.11.6298. [DOI] [PubMed] [Google Scholar]
- 14.Iwashiro M, Messer RJ, Peterson KE, Stromnes IM, Sugie T, Hasenkrug KJ. Immunosuppression by CD4+ regulatory T cells induced by chronic retroviral infection. Proc Natl Acad Sci USA. 2001;98:9226–30. doi: 10.1073/pnas.151174198. [DOI] [PMC free article] [PubMed] [Google Scholar]
- 15.Kinter AL, Hennessey M, Bell A, et al. CD25(+)CD4(+) regulatory T cells from the peripheral blood of asymptomatic HIV-infected individuals regulate CD4(+) and CD8(+) HIV-specific T cell immune responses in vitro and are associated with favorable clinical markers of disease status. J Exp Med. 2004;200:331–43. doi: 10.1084/jem.20032069. [DOI] [PMC free article] [PubMed] [Google Scholar]
- 16.Apoil PA, Puissant B, Roubinet F, Abbal M, Massip P, Blancher A. FOXP3 mRNA levels are decreased in peripheral blood CD4+ lymphocytes from HIV-positive patients. J Acquir Immune Defic Syndr. 2005;39:381–5. doi: 10.1097/01.qai.0000169662.30783.2d. [DOI] [PubMed] [Google Scholar]
- 17.Oswald-Richter K, Grill SM, Shariat N, et al. HIV infection of naturally occurring and genetically reprogrammed human regulatory T-cells. Plos Biol. 2004;2:E198. doi: 10.1371/journal.pbio.0020198. [DOI] [PMC free article] [PubMed] [Google Scholar]
- 18.Aandahl EM, Michaelsson J, Moretto WJ, Hecht FM, Nixon DF. Human CD4+ CD25+ regulatory T cells control T-cell responses to human immunodeficiency virus and cytomegalovirus antigens. J Virol. 2004;78:2454–9. doi: 10.1128/JVI.78.5.2454-2459.2004. [DOI] [PMC free article] [PubMed] [Google Scholar]
- 19.Sakaguchi S. Regulatory T cells: mediating compromises between host and parasite. Nat Immunol. 2003;4:10–1. doi: 10.1038/ni0103-10. [DOI] [PubMed] [Google Scholar]
- 20.Khattri R, Cox T, Yasayko SA, Ramsdell F. An essential role for Scurfin in CD4+CD25+ T regulatory cells. Nat Immunol. 2003;4:337–42. doi: 10.1038/ni909. [DOI] [PubMed] [Google Scholar]
- 21.Fontenot JD, Gavin MA, Rudensky AY. Foxp3 programs the development and function of CD4+CD25+ regulatory T cells. Nat Immunol. 2003;4:330–6. doi: 10.1038/ni904. [DOI] [PubMed] [Google Scholar]
- 22.Hori S, Nomura T, Sakaguchi S. Control of regulatory T cell development by the transcription factor Foxp3. Science. 2003;299:1057–61. doi: 10.1126/science.1079490. [DOI] [PubMed] [Google Scholar]
- 23.Crellin NK, Garcia RV, Hadisfar O, Allan SE, Steiner TS, Levings MK. Human CD4+ T cells express TLR5 and its ligand flagellin enhances the suppressive capacity and expression of FOXP3 in CD4+CD25+ T regulatory cells. J Immunol. 2005;175:8051–9. doi: 10.4049/jimmunol.175.12.8051. [DOI] [PubMed] [Google Scholar]
- 24.Lim HW, Hillsamer P, Banham AH, Kim CH. Cutting edge: direct suppression of B cells by CD4+ CD25+ regulatory T cells. J Immunol. 2005;175:4180–3. doi: 10.4049/jimmunol.175.7.4180. [DOI] [PubMed] [Google Scholar]
- 25.Lim HW, Broxmeyer HE, Kim CH. Regulation of trafficking receptor expression in human forkhead box p3+ regulatory T cells. J Immunol. 2006;177:840–51. doi: 10.4049/jimmunol.177.2.840. [DOI] [PubMed] [Google Scholar]
- 26.Liu W, Putnam AL, Xu-Yu Z, et al. CD127 expression inversely correlates with FoxP3 and suppressive function of human CD4+ T reg cells. J Exp Med. 2006;203:1701–11. doi: 10.1084/jem.20060772. [DOI] [PMC free article] [PubMed] [Google Scholar]
- 27.Weiss L, Donkova-Petrini V, Caccavelli L, Balbo M, Carbonneil C, Levy Y. Human immunodeficiency virus-driven expansion of CD4+CD25+ regulatory T cells, which suppress HIV-specific CD4 T-cell responses in HIV-infected patients. Blood. 2004;104:3249–56. doi: 10.1182/blood-2004-01-0365. [DOI] [PubMed] [Google Scholar]
- 28.Fu S, Yopp AC, Mao X, et al. CD4+ CD25+ CD62+ T-regulatory cell subset has optimal suppressive and proliferative potential. Am J Transplant. 2004;4:65–78. doi: 10.1046/j.1600-6143.2003.00293.x. [DOI] [PubMed] [Google Scholar]
- 29.Schaefer C, Kim GG, Albers A, Hoermann K, Myers EN, Whiteside TL. Characteristics of CD4+CD25+ regulatory T cells in the peripheral circulation of patients with head and neck cancer. Br J Cancer. 2005;92:913–20. doi: 10.1038/sj.bjc.6602407. [DOI] [PMC free article] [PubMed] [Google Scholar]
- 30.Andersson J, Boasso A, Nilsson J, et al. The prevalence of regulatory T cells in lymphoid tissue is correlated with viral load in HIV-infected patients. J Immunol. 2005;174:3143–7. doi: 10.4049/jimmunol.174.6.3143. [DOI] [PubMed] [Google Scholar]