

Abstract
Background
Many lines of evidence suggest that poly(ADP-ribose) polymerase-1 (Parp-1) is involved in transcriptional regulation of various genes as a coactivator or a corepressor by modulating chromatin structure. However, the impact of Parp-1-deficiency on the regulation of genome-wide gene expression has not been fully studied yet.
Results
We employed a microarray analysis covering 12,488 genes and ESTs using mouse Parp-1-deficient (Parp-1-/-) embryonic stem (ES) cell lines and the livers of Parp-1-/- mice and their wild-type (Parp-1+/+) counterparts. Here, we demonstrate that of the 9,907 genes analyzed, in Parp-1-/- ES cells, 9.6% showed altered gene expression. Of these, 6.3% and 3.3% of the genes were down- or up-regulated by 2-fold or greater, respectively, compared with Parp-1+/+ ES cells (p < 0.05). In the livers of Parp-1-/- mice, of the 12,353 genes that were analyzed, 2.0% or 1.3% were down- and up-regulated, respectively (p < 0.05). Notably, the number of down-regulated genes was higher in both ES cells and livers, than that of the up-regulated genes. The genes that showed altered expression in ES cells or in the livers are ascribed to various cellular processes, including metabolism, signal transduction, cell cycle control and transcription. We also observed expression of the genes involved in the pathway of extraembryonic tissue development is augmented in Parp-1-/- ES cells, including H19. After withdrawal of leukemia inhibitory factor, expression of H19 as well as other trophoblast marker genes were further up-regulated in Parp-1-/- ES cells compared to Parp-1+/+ ES cells.
Conclusion
These results suggest that Parp-1 is required to maintain transcriptional regulation of a wide variety of genes on a genome-wide scale. The gene expression profiles in Parp-1-deficient cells may be useful to delineate the functional role of Parp-1 in epigenetic regulation of the genomes involved in various biological phenomena.
Background
Poly(ADP-ribose) polymerase-1 (Parp-1) is a nuclear protein that catalyzes the transfer of ADP-ribose units to various nuclear proteins as a post-translational modification [1]. Poly (ADP-ribose) is a highly negatively charged molecule and poly (ADP-ribosylation) of chromatin-bound proteins including histone may change the interaction of the modified proteins with DNA or other proteins. A 'histone shuttle model' proposed by Althaus et al. can explain the dynamic changes of chromatin structure through histone replacement induced by Parp-1 activation [2]. Accumulating evidence suggests that under Parp-1 deficiency, transcriptional regulation, cell differentiation, and tumorigenesis are substantially affected. For example, Parp-1 is involved in the regulation of Reg3 gene [3] as a transcription factor. As a co-activator, Parp-1 plays a role in the regulation of ligand-induced transactivation of ecdysone receptor [4], and in the transcriptional control of the target genes by AP-2 [5], and by MYB [6]. As a co-repressor, Parp-1 regulates the expression of RXR-regulated genes [7] and also plays an auto-regulatory role in the transcription of the Parp-1 gene itself [8]. Parp-1 also modulates the activity of the transcription factor NF-κB and consequently, the expression of NF-κB-dependent genes, including inducible nitric oxide synthetase (iNOS) [9]. The expression of nearly 1% of the genes, including those involved in cell cycle control and DNA replication was affected in exon 2 disrupted Parp-1-/- mouse embryonic fibroblasts (EF cells) [10]. Parp-deficient Drosophila showed attenuation of gene expression located in puff loci and also lost puff formation, suggesting a role for Parp in the induction of genes located at specific chromosomal loci [11].
Recent studies further suggest that Parp-1 is involved in the regulation of dynamic changes of gene expression induced by specific stimuli. Parp-1 is associated with transcriptionally repressed chromatin domains, which do not overlap with the regions where histone H1 is located [12]. NAD-dependent alteration of chromatin structure through Parp-1 auto-modification was demonstrated to lead to activation of estrogen induced estrogen receptor dependent transcription [12]. In addition, the PARP inhibitor, 3-aminobenzamide induced hypermethylation of the Htf9 gene, suggesting the presence of a negative correlation between poly(ADP-ribosylation) and DNA methylation [13]. In spite of the above evidence, how Parp-1 is involved in the epigenetic regulation and functions in the maintenance of basal gene expression profiles of cells are not well understood.
We previously reported induction of the trophoblast lineage in exon 1 disrupted Parp-1-/- ES cells during teratocarcinoma-like tumor formation [14], as well as in vitro culture [15]. Simultaneous induction of several trophoblast marker genes, including placental lactogen I and II, proliferin and Tpbp (4311) in Parp-1-/- ES cells took place without any stimulus during trophoblast induction [15]. We therefore considered that ES cells as well as tissues in live mice might be good material in which to study the effects of Parp-1 deficiency on a basal level of gene expression, namely epigenetic regulation, at the genome-wide level. In this study, global gene expression profiles were studied in exon 1 disrupted Parp-1-/- ES cells as well as in the livers of mice.
Results and discussion
Gene expression profile in Parp-1-/- ES cells
A comparison of the basal gene expression profiles in Parp-1-/- ES cells to their wild-type (Parp-1+/+) counterparts, is presented in Fig. 1A–C and Table 1. We found the expression of (950/9,907) genes, namely 9.6%, was different by at least 2-fold between Parp-1-/- and Parp-1+/+ ES cells (p < 0.05) (Fig. 1B and Table 1). Notably, a larger fraction of the genes, 6.3% (626/9,907) was down-regulated, whereas only 3.3% (324/9,907) of the genes were up-regulated (see Table 1).
Figure 1.
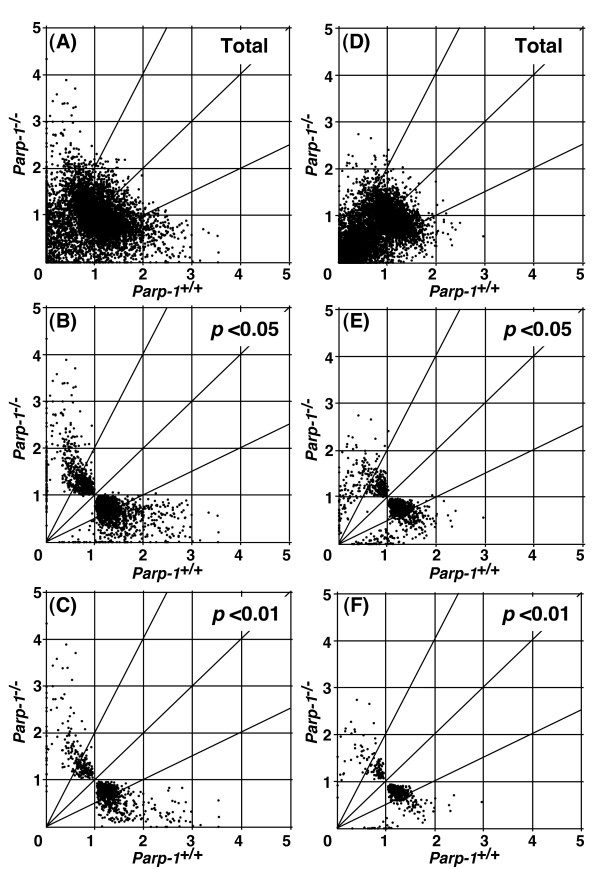
Effect of Parp-1 deficiency on gene expression. Gene expression data from microarray analyses are plotted for Parp-1-/- versus wild-type (Parp-1+/+) ES cell lines (A-C) or the livers (D-F). Horizontal and vertical axes represent expression levels normalized for an individual gene. Each point represents normalized expression data for an individual gene. The genes that showed standard deviations greater than 2.0 in the normalized data of both genotypes (A and D) were excluded and gene lists were constructed with p < 0.05 (B and E), or p < 0.01 (C and F).
Table 1.
Differential expression of genes between Parp-1+/+ and Parp-1-/- ES cells, livers, and EFs
| No. of genes | |||||
| Parp-1-/- <Parp-1+/+ | Parp-1-/- > Parp-1+/+ | ||||
| p-value cut offa | Total | Total | 2-fold or greater | Total | 2-fold or greater |
| ES cellsc | |||||
| Totalb | 9,907 | 5,464 | 1,283 | 4,349 | 1,406 |
| p < 0.05b | 2,273 | 1,609 | 626 | 664 | 324 |
| p < 0.01b | 928 | 684 | 259 | 244 | 120 |
| Liversd | |||||
| Totalb | 12,353 | 7,138 | 1,184 | 4,860 | 1,038 |
| p < 0.05b | 1,616 | 1,190 | 253 | 426 | 158 |
| p < 0.01b | 641 | 515 | 100 | 126 | 43 |
| EFse | |||||
| Total | 12,359 | 5,042 | 707 | 7,317 | 501 |
| p < 0.05 | 996 | 390 | 216 | 606 | 205 |
a Analyzed by One-Way ANOVA (non-parametric test known as Wilcoxon-Mann-Whitney test)
b These genes were presented in Fig. 1 (A)-(F).
c Parp-1+/+ ES cell clone, J1, and Parp-1-/- ES cell clones, 210-58 and 226-47, were used.
d Two mice were used for each genotype.
e Three EFs obtained from three embryos were analyzed as triplicate experiments.
We also made the heatmaps using the gene lists containing the 928 genes that showed a difference at p < 0.01 in ES cells (Fig. 2A). Although we used independently isolated Parp-1-/- ES cell clones, a clear common alteration in the gene expression profile was observed (see Fig. 2A, and Tables 2 and 3).
Figure 2.
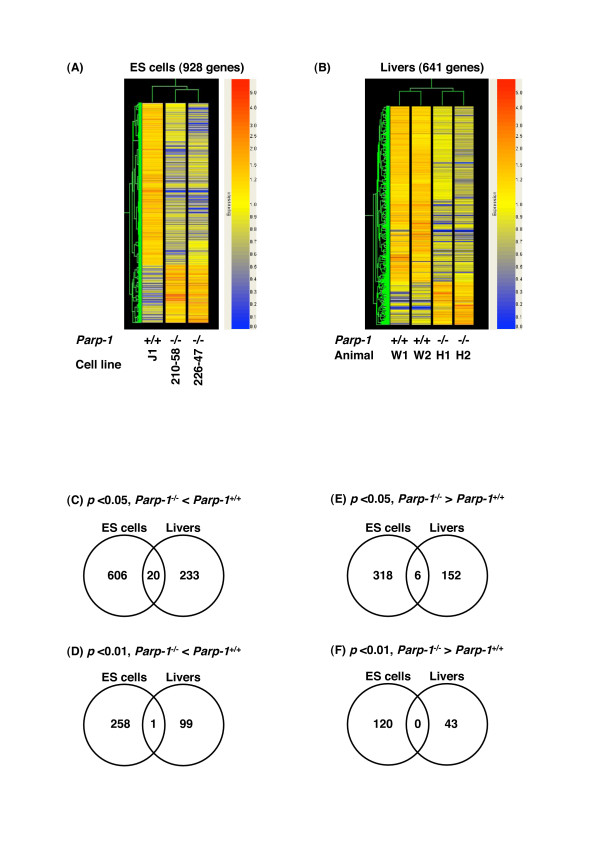
Comparison of gene expression profiles among cell lines, animals, or cell types. Heatmaps of gene expression profiles in ES cells (A) and Livers (B). We constructed the heatmaps using the gene lists containing the genes that showed a difference at p < 0.01 in ES cells and livers, respectively. Each heatmap is constructed using GeneSpring GX ver. 7.3.1. Numbers of commonly down- (C & D) or up- (E & F) regulated genes between Parp-1-/- ES cells and livers. The numbers of the genes were indicated in Venn diagrams. These genes showed the difference with at least 2-fold between Parp-1+/+ and Parp-1-/- (p < 0.05, C & E, or p < 0.01, D & F).
Table 2.
Genes down-regulated in Parp-1-/- ES cells
| Fold changea) | ||||||
| Accession No. | W vs H | J1 vs 210-58 | J1 vs 226-47 | Symbol | Chromosome | Gene description |
| Cell cycle/cell proliferation/cell death | ||||||
| AW122355 | 3.2 | 5.2 | 2.3 | Prkcbp1 | 2 | Protein kinase C binding protein 1 |
| AF067395 | 2.9 | 2.9 | 2.9 | Bnip3l | 14 | BCL2/adenovirus E1B 19 kDa-interacting protein |
| AI842277 | 2.7 | 2.3 | 3.2 | Igfbp3 | 11 | Insulin-like growth factor binding protein 3 |
| U95826 | 2.2 | 2.5 | 1.9 | Ccng2 | 5 | Cyclin G2 |
| Cell structure/cell adhesion | ||||||
| U16741 | 4.1 | 6.3 | 3.1 | Capza2 | 6 | Capping protein (actin filament) muscle Z-line, alpha 2 |
| AI132380 | 3.6 | 3.1 | 4.3 | Fndc3a | 14 | Fibronectin type III domain containing 3a |
| AI505453 | 2.9 | 2.5 | 3.4 | Myh9 | 15 | Myosin, heavy polypeptide 9, non-muscle |
| AW208938 | 2.4 | 3.2 | 2.0 | Pkp2 | 16 | Plakophilin 2 |
| M76124 | 2.4 | 2.2 | 2.6 | Tacstd1 | 17 | Tumor-associated calcium signal transducer 1 |
| Metabolism | ||||||
| U73820 | 5.5 | 5.2 | 5.8 | Galnt1 | 18 | Polypeptide GalNAc transferase-T1 (ppGaNTase-T1) |
| AI841270 | 3.4 | 2.4 | 6.4 | Gstm1 | 3 | Glutathione S-transferase, mu1 |
| AV308550 | 2.6 | 4.1 | 1.9 | Piga | x | Phosphatidylinostitol glycan, class A |
| AI851912 | 2.3 | 2.2 | 2.5 | Rps27 | 3 | Ribosomal protein S27 |
| AI852144 | 2.1 | 2.9 | 1.7 | Pbef-pending | 12 | Pre-B-cell colony-enhancing factor |
| U65986 | 2.1 | 1.9 | 2.5 | Anxa11 | 14 | Annexin A11 |
| D50264 | 2.1 | 1.4 | 4.1 | Pigf | 17 | Phosphatidylinositol glycan, class F |
| AF031486 | 2.0 | 2.0 | 2.0 | Sms | x | Spermidine synthase |
| AI845882 | 2.0 | 2.5 | 1.7 | Acyp1 | 12 | Acylphosphatase1, erythrocyte (common) type |
| Protein biosynthesis/degradation | ||||||
| AI852581 | 3.0 | 3.0 | 3.1 | Ide | 19 | Insulin degradating enzyme |
| AI414051 | 3.0 | 1.8 | 9.1 | Usp24 | 4 | Ubiquitin specific protease 24 |
| AW121012 | 2.9 | 2.8 | 2.8 | Rnf19 | 15 | Ring finger protein 19 |
| X92665 | 2.9 | 2.5 | 3.4 | Ube2e1 | 14 | Ubiquitin-conjugating enzyme UbcM3 |
| AW048882 | 2.2 | 2.8 | 1.8 | Iars | 13 | Isoleucine-tRNA synthetase |
| AA867340 | 2.2 | 1.9 | 2.6 | Psme4 | 11 | Proteasome (prosome, macropain) activator subunit |
| AB024427 | 2.2 | 2.3 | 2.1 | Rnf11 | 4 | Ring finger protein 11 |
| Signaling | ||||||
| AI846023 | 4.6 | 2.8 | 13.1 | Arl7 | 1 | ADP-ribosylation factor-like 7 |
| AA260005 | 2.8 | 2.7 | 2.8 | Pawr | 10 | PPKC, apoptosis, WT1, regulator |
| AI317205 | 2.6 | 2.4 | 2.7 | Map3k1 | 13 | Mitogen activated protein kinase kinase kinase 1 |
| AF035644 | 2.3 | 2.0 | 2.7 | Ptp4a2 | 4 | Protein tyrosine phosphatase 4a2 |
| M21019 | 2.3 | 1.9 | 2.9 | Rras | 7 | Harvey rat sarcoma oncogene, subgroup R |
| AI194248 | 2.2 | 2.5 | 1.9 | Csnk2a1 | 2 | Casein kinase II, alpha 1 polypeptide |
| AI854006 | 2.0 | 2.0 | 2.1 | Set | 2 | SET translocation |
| D83921 | 2.0 | 1.9 | 2.1 | Ebaf | 1 | Endometrial bleeding associated factor |
| Transcription/replication | ||||||
| X14206 | 9.9 | 8.4 | 12.0 | Adprt1 | 1 | Poly(ADP-ribose) polymerase 1 |
| M99167 | 3.0 | 6.2 | 2.0 | Hnrpa1 | 15 | Heterogeneous nuclear ribonucleoprotein A1 |
| AW107922 | 2.8 | 3.7 | 2.2 | Sox11 | 12 | SRY box-containing gene 11 |
| AI849135 | 2.5 | 2.5 | 2.5 | Foxo3a | 10 | Forkhead box 03a |
| Y07836 | 2.5 | 2.3 | 2.8 | Bhlhb2 | 6 | Basic-helix-loop-helix domain containing, class B2 |
| X74760 | 2.5 | 2.3 | 2.7 | Notch3 | 17 | Notch gene homolog 3, (Drosophila) |
| AI447783 | 2.1 | 2.4 | 1.9 | Helb | 10 | Helicase(DNA) B |
| X94694 | 2.1 | 2.7 | 1.7 | Tcfap2c | 2 | Transcription factor AP-2, gamma |
| AF077861 | 2.1 | 2.2 | 2.1 | Id2 | 12 | Inhibitor of DNA binding 2 |
| AI605405 | 2.0 | 1.9 | 2.2 | Phf13 | 4 | PHD finger protein 13 |
| D78382 | 2.0 | 1.7 | 2.6 | Tob1 | 11 | Transducer of ErbB2.1 |
| Transport | ||||||
| AV356315 | 4.1 | 5.5 | 3.3 | Lman1 | 18 | Lectin, mannose-binding, 1 |
| AV298789 | 2.9 | 2.6 | 3.2 | Ranbp5 | 14 | Ran binding protein 5 |
| D88315 | 2.2 | 2.2 | 2.2 | Hiat1 | 3 | Hippocampus abundant gene transcript 1 |
| Unknown | ||||||
| AI845617 | 3.5 | 3.5 | 3.4 | 2610019A05Rik | 11 | Hypothetical protein |
| AI852287 | 3.2 | 3.3 | 3.2 | Ankrd28 | 14 | Ankyrin repeat domain 28 |
| AI836771 | 3.0 | 2.8 | 3.3 | 2900008M13Rik | 15 | Unknown EST |
| AA684456 | 2.9 | 2.1 | 4.5 | 2310015N07Rik | 7 | Hypothetical protein |
| AI848435 | 2.8 | 1.9 | 4.8 | C78339 | 13 | Unknown EST |
| AW123157 | 2.7 | 2.5 | 3.1 | 1700051E09Rik | 11 | Hypothetical protein |
| AW124843 | 2.6 | 3.1 | 2.3 | C85108 | 4 | Unknown EST |
| AA710439 | 2.6 | 2.0 | 3.6 | 6230421P05Rik | 16 | Unknown EST |
| AI853444 | 2.5 | 1.8 | 3.9 | 2610042L04Rik | 14 | Hypothetical protein |
| AI853444 | 2.2 | 2.1 | 2.3 | 2610042L04Rik | 14 | Hypothetical protein |
| AW121353 | 2.1 | 1.6 | 3.1 | Lrrc8 | 2 | Luecine rich repeat containing 8 |
| AI037493 | 2.1 | 1.5 | 3.4 | Tbc1d15 | 10 | TBC1 domain family, member 15 |
| AI461803 | 2.1 | 2.2 | 1.9 | 1300006C19Rik | 9 | Hypothetical protein |
| AW049969 | 2.0 | 2.0 | 2.1 | C330005L02Rik | 9 | Hypothetical protein |
| AI847483 | 2.0 | 2.0 | 2.0 | Tmem41b | 7 | Transmembrane protein 41B |
a)W, wild-type cells (J1); H, Parp-1-/- ES cells (210-58 and 226-47).
Table 3.
Genes up-regulated in Parp-1-/- ES cells
| Fold changea) | ||||||
| Accession No. | H vs W | 210-58 vs J1 | 226-47 vs J1 | Symbol | Chromosome | Gene description |
| Cell cycle/cell proliferation/cell death | ||||||
| X58196 | 3.1 | 3.3 | 2.9 | H19 | 7 | H19 non-coding RNA |
| AI842665 | 3.0 | 3.1 | 2.8 | Tax1bp3 | 11 | Human T-cell leukemia virus type I binding protein 3 |
| Cell structure/cell adhesion | ||||||
| X04017 | 2.3 | 2.3 | 2.3 | Sparc | 11 | Cysteine-rich glycoprotein SPARC |
| M26071 | 2.1 | 2.5 | 1.8 | F3 | 3 | Coagulation factor III |
| M91236 | 2.1 | 2.1 | 2.1 | Gjb5 | 4 | Gap junction membrane channel protein beta 5 |
| Immune response | ||||||
| U13705 | 2.3 | 2.1 | 2.4 | Gpx3 | 11 | Glutathione peroxidase 3 |
| Metabolism | ||||||
| AW120625 | 2.3 | 1.9 | 2.7 | Pgd | 4 | Phosphogluconate dehydrogenase |
| M64782 | 2.2 | 1.9 | 2.5 | Folr1 | 7 | Folate-binding protein 1 (FBP1) |
| X97755 | 2.0 | 2.1 | 2.0 | Ebp | x | Phenylalkylamine Ca2+ antagonist (emopamil) binding protein |
| Protein biosynthesis/degradation | ||||||
| W71352 | 3.9 | 4.2 | 3.6 | Bag2 | 1 | Bcl2-associated athanogene 2 |
| AI844175 | 3.4 | 3.4 | 3.4 | Mrps11 | 7 | Mitochondrial ribosomal protein S11 |
| U16163 | 2.9 | 2.9 | 2.8 | P4ha2 | 11 | Prolyl 4-hydroxylase alpha(II)-subunit |
| D00622 | 2.5 | 2.0 | 3.0 | Lrpap1 | 5 | Low density lipoprotein receptor related protein, associated protein 1 |
| X60676 | 2.3 | 2.4 | 2.2 | Serpinh1 | 7 | HSP47 |
| AW124432 | 2.1 | 1.8 | 2.5 | Mrpl12 | 11 | Mitochondrial ribosomal protein L12 |
| AI839392 | 2.0 | 2.0 | 2.1 | Aars | 8 | Alanyl-tRNA syntase |
| Transcription/replication | ||||||
| D49473 | 3.4 | 3.0 | 3.7 | Sox17 | 1 | SRY-box containing gene 17 |
| U51335 | 2.5 | 2.5 | 2.6 | Gata6 | 18 | GATA-binding protein 6 |
| U79962 | 2.4 | 2.1 | 2.6 | Tarbp2 | 15 | TAR (HIV) RNA binding protein 2 |
| D49473 | 2.1 | 1.9 | 2.3 | Sox17 | 1 | SRY-box containing gene 17 |
| Transport | ||||||
| D14077 | 2.2 | 2.1 | 2.2 | Clu | 14 | Clusterin |
| Others | ||||||
| M34603 | 2.6 | 2.3 | 3.0 | Prg | 10 | Proteoglycan core protein |
| AA793009 | 2.3 | 2.0 | 2.7 | Tex19 | 11 | Testis expressed gene 19 |
| Unknown | ||||||
| AI846553 | 3.2 | 3.0 | 3.3 | 1110020C13Rik | 15 | Hypothetical protein |
| AI845664 | 2.1 | 2.0 | 2.2 | Grwd | 7 | Glutamate-rich WD repeat containing 1 |
a) H, Parp-1-/- ES cells (210-58 and 226-47); W, wild-type cells (J1).
We further selected the genes that showed relatively high expression levels (the "Flag value" in GeneSpring ver. 6.1 of the genes should be either "Present" (high level of expression) or "Marginal" (moderate level of expression) in all six replicates of the genotype within the 928 genes that showed a difference at p < 0.01, see Table 1). Among the 86 genes that this analysis identified, there were 62 genes, obviously including the Parp-1 (Adprt1) gene itself, that were down-regulated and 24 genes up-regulated, as listed in Tables 2 and 3. Reduced expression of Igfbp3 (insulin-like growth factor binding protein 3) and Galnt1 (polypeptide GalNAc transferase-T1) in Parp-1-/- ES cells was further confirmed by Northern blot analysis (Fig. 3A). These down- and up-regulated genes in Parp-1-/- ES cells are involved in a variety of cellular processes, including transcription, metabolism, signaling, immune response, cell structure, and other cellular processes (Fig. 3B, and Tables 2 and 3).
Figure 3.
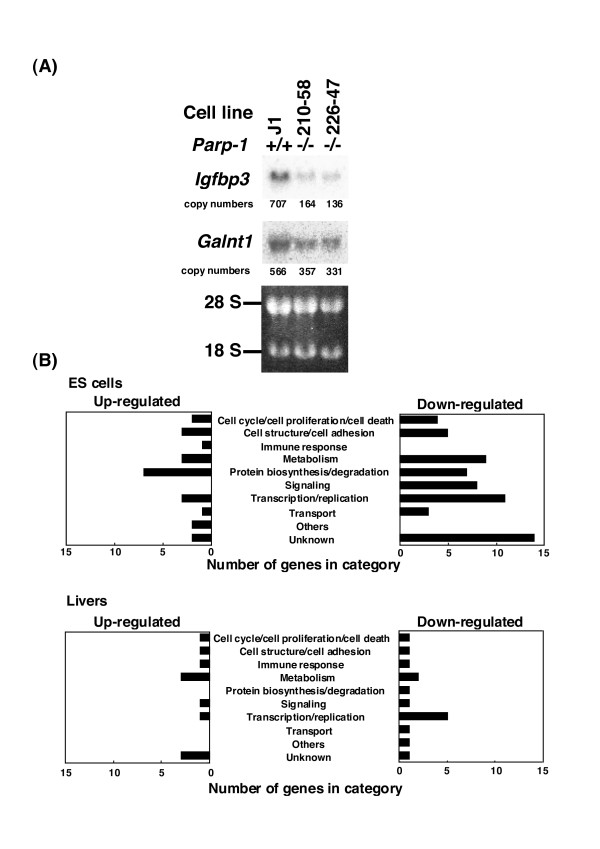
Confirmation of differentially expressed genes in microarray analysis by northern blot analysis (A), and functional categorization of up- and down-regulated genes (B). Ten micrograms of total RNA were used for northern blot analysis in (A). Copy numbers were calculated from the radioactivities of the probe control.
Gene expression profile of the livers and EF cells
In the livers, 3.3% (411/12,353) of genes showed a significant difference in expression level (p < 0.05) between the Parp-1 genotypes. In the livers of Parp-1-/- mice, 2.0% (253/12,353) of the genes were down-regulated and 1.3% (158/12,353) of the genes were up-regulated (p < 0.05). Similar to Parp-1-/- ES cells, a higher percentage of the genes, 62% (253/411), were down-regulated and the remaining 38% were up-regulated (Fig. 1D–F, and Table 1). The expression of representative marker genes of the liver, including albumin (Alb1) and phosphoenolpyruvate carboxykinase (Pepck) was similarly high in both Parp-1 genotypes.
The heatmaps were constructed using the gene lists containing the 641 genes that showed a difference at p < 0.01 in livers (Fig. 2B). Parp-1 deficiency commonly altered gene expression profiles in the livers of two mice analyzed (Fig. 2B, Table 4). Among 641 genes, we identified 26 genes that showed a relatively high level of expression (genes with "Flag values" of either "Marginal" or "Present" in each genotype) and were altered 2-fold or greater between the Parp-1-/- and Parp-1+/+ livers (p < 0.01) (Table 4). Among them, 15 genes were down-regulated and 11 genes were up-regulated.
Table 4.
Genes down- and up-regulated in Parp-1-/- livers
| Fold changea) | |||||||||
| Accession No. | W vs H | W1 vs H1 | W1 vs H2 | W2 vs H1 | W2 vs H2 | Symbol | Chromosome | Gene description | |
| Down-regulated | |||||||||
| Cell structure/cell adhesion | |||||||||
| AA867778 | 2.1 | 2.4 | 2.6 | 1.7 | 1.8 | Actn1 | 12 | Actinin, alpha 1 | |
| Cell cycle/cell proliferation/cell death | |||||||||
| AJ223782 | 2.0 | 1.8 | 1.7 | 2.5 | 2.3 | Sept7 | 9 | Septin7 (Cdc10) | |
| Immune response | |||||||||
| X05475 | 2.1 | 2.5 | 1.8 | 2.6 | 1.9 | C9 | 15 | Complement component C9 | |
| Metabolism | |||||||||
| L42996 | 3.0 | 1.7 | 3.7 | 2.7 | 5.8 | Dbt | 3 | Nuclear-encoded mitochondrial acyltransferase | |
| AF026075 | 2.4 | 1.8 | 4.3 | 1.7 | 4.0 | Sult3a1 | 10 | Sulfotransferase-related protein (SULT-X2) | |
| Protein biosynthesis/degradation | |||||||||
| M27347 | 3.2 | 3.4 | 3.2 | 3.1 | 3.0 | Ela1 | 15 | P6-5 gene, 3' end (elastase 1) | |
| Signaling | |||||||||
| AI563623 | 2.3 | 2.9 | 1.9 | 2.9 | 1.8 | Pkn2 | 3 | Protein kinase N2 | |
| Transcription/replication | |||||||||
| AF010405 | 4.9 | 6.8 | 3.2 | 8.5 | 4.1 | Hfh-1L | 13 | HNF-3/forkhead homolog 1 like | |
| L20450 | 3.7 | 3.1 | 2.7 | 5.0 | 4.3 | Zfp97 | 17 | Zinc finger protein 97 | |
| AW048355 | 2.1 | 1.6 | 1.9 | 2.3 | 2.8 | Phf17 | 3 | PHD finger protein 17 | |
| AI848996 | 2.1 | 2.2 | 2.3 | 2.0 | 2.1 | Dhx40 | 11 | DEAH box polypeptide 40 | |
| AW123909 | 2.1 | 1.5 | 1.9 | 2.2 | 2.9 | Rbpms | 8 | RNA binding protein gene with multiple splicing | |
| Transport | |||||||||
| D86066 | 3.2 | 2.3 | 4.4 | 2.6 | 4.8 | Rab5ep-pending | 11 | Rabaptin-5 | |
| Others | |||||||||
| AI835016 | 2.4 | 2.1 | 2.3 | 2.5 | 2.7 | Hps4 | 5 | Light ear protein (1e) | |
| Unknown | |||||||||
| AI848841 | 2.1 | 2.2 | 1.6 | 2.7 | 2.0 | A230106A15Rik | 13 | Unknown | |
| Up-regulated | H vs W | H1 vs W1 | H1 vs W2 | H2 vs W1 | H2 vs W2 | ||||
| Cell cycle/cell proliferation/cell death | |||||||||
| X95280 | 3.0 | 2.8 | 2.7 | 3.4 | 3.2 | G0s2 | 1 | GOS2-like protein | |
| Cell structure/cell adhesion | |||||||||
| AI132491 | 2.1 | 1.9 | 2.6 | 1.6 | 2.2 | Bysl | 17 | Bystin-like | |
| Immune response | |||||||||
| J00475 | 3.1 | 9.2 | 2.8 | 4.2 | 1.3 | Iga | 12 | Germline IgH chain gene, DJC region-segment D-FL16.1 | |
| Metabolism | |||||||||
| M63245 | 3.2 | 2.8 | 4.0 | 2.6 | 3.7 | Alas1 | 9 | Amino levulinate synthase (ALAS-H) | |
| AW121625 | 2.5 | 2.8 | 2.4 | 2.6 | 2.3 | Galnt11 | 5 | Polypeptide GalNAc transferase 11 | |
| Y15003 | 2.1 | 1.8 | 1.9 | 2.3 | 2.5 | St3gal5 | 6 | Beta-galactoside alpha-2,3-sialyltransferase 5 | |
| Signaling | |||||||||
| L76567 | 4.1 | 1.8 | 2.3 | 5.5 | 7.0 | Shp1 | 4 | Shp gene | |
| Transcription/replication | |||||||||
| AI553024 | 2.4 | 2.4 | 1.5 | 3.8 | 2.4 | Zbtb16 | 9 | Zinc finger and BTB domain containing 16 | |
| Unknown | |||||||||
| AI042964 | 7.1 | 7.1 | 8.4 | 5.9 | 7.1 | 0610005C13Rik | 7 | Hypothetical protein | |
| AI593759 | 3.7 | 3.0 | 4.0 | 3.4 | 4.6 | 9530051K01Rik | 7 | Hypothetical protein | |
| AI019679 | 2.3 | 10.0 | 1.4 | 9.4 | 1.3 | 1100001G20Rik | 11 | Hypothetical protein | |
a) W, Parp-+/+ livers from two animals (W1 & W2): H, Parp-1-/- livers from two animals (H1 & H2).
In the case of the EF cells, the results obtained from these 3 replicates are shown in Table 1. In Parp-1-/- EF cells, 1.7% (216/12,359) and 1.7% (205/12,359) genes were down- and up-regulated, respectively (p < 0.05). We were not able to construct gene lists with a p value less than p < 0.02.
Comparison of the profiles among different cell types
We compared gene expression profiles between Parp-1-/- ES cells and the livers. There were no commonly up- or down-regulated genes in Tables 2, 3, 4, namely in the genes showing relatively high expression levels selected by Flag values, although we observed that 20 genes including Eif2s2 (eukaryotic translation initiation factor 2 subunit 2 beta), Parp-1, and 6 genes were commonly down- and up-regulated in the ES cells and livers (p < 0.05), respectively (Fig. 2C–F). There was no gene commonly altered in ES cells, livers, and EFs. Comparison of the affected genes in the ES cells, livers, and EF cells thus revealed that Parp-1-deficiency mostly altered the expression level of different sets of genes depending on the cell types.
Up-regulation of the differentiation pathway to extraembryonic tissues in Parp-1-/- ES cells
Among the genes, we found up-regulation of H19, Sparc, Sox17, and Gata6 in Parp-1-/- ES cells (Table 3). The H19 gene has been suggested to regulate differentiation into extraembryonic tissues including trophoblast lineage and extraembryonic endoderms [16-18]. Sparc, Sox17, and Gata6 are known as marker genes of extraembryonic endoderms [19-21]. Because we previously reported induction of trophoblast lineage in untreated Parp-1-/- ES cells during in vitro culture, we speculated that a higher level of H19 expression in Parp-1-/- ES cells may be involved in induction of extraembryonic tissues including trophoblast lineage. The mouse H19 gene is located on the distal region of chromosome 7 and encodes the 2.3 kb untranslated transcript, which is maternally expressed, and the H19 gene and the insulin-like growth factor 2 (Igf2) gene are reciprocally imprinted [22].
We analyzed expression of H19 and Igf2 genes in untreated Parp-1-/- and Parp-1+/+ ES cell lines by semi-quantitative RT-PCR (Fig. 4A). We confirmed that the H19 gene is up-regulated, whereas the Igf2 gene, which is reciprocally imprinted was slightly down-regulated in both the two Parp-1-/-ES cell lines.
Figure 4.
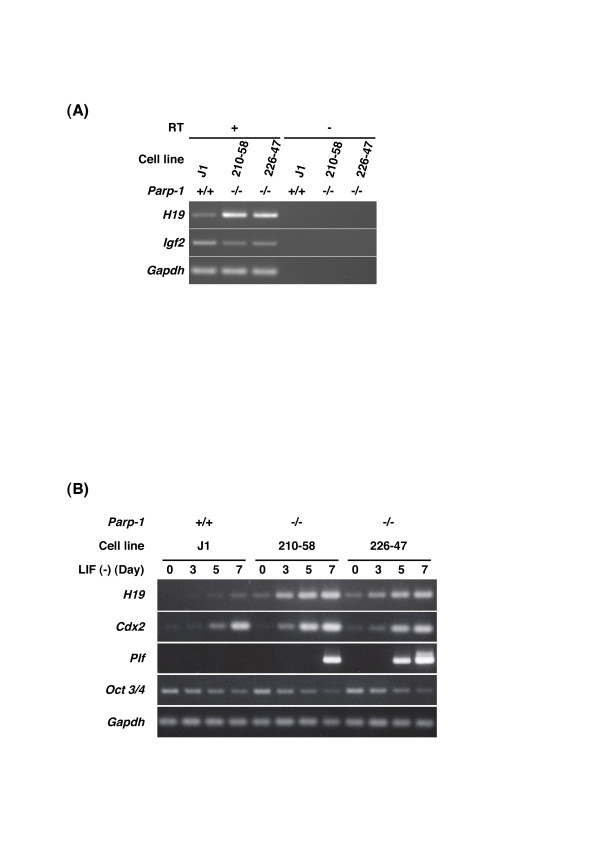
Semi-quantitative RT-PCR analysis of H19 and other extraembryonic marker gene expression in undifferentiatiated ES cells (A) or during differentiation of ES cells after LIF withdrawal (B). (A) PCR was carried out using cDNA prepared with (+) or without (-) reverse transcriptase (RT) [see Additional file 1 for primers]. (B) Total RNA was prepared using harvested ES cells 3, 5, and 7 days after removal of LIF. RNA samples prepared from untreated ES cells correspond to Day 0. Gapdh (glyceraldehyde-3-phosphate dehydrogenase) gene was used as an internal control.
H19 is highly expressed in extraembryonic tissues, including placenta and cells quite similar to the parietal endoderm of extraembryonic lineages, during ES cell differentiation [16]. Because withdrawal of LIF during ES cell culture causes differentiation of ES cells [23,24], we further analyzed expression of the H19 gene and other trophoblast marker genes for 7 days after withdrawal of LIF by semi-quantitative RT-PCR. We observed earlier and greater up-regulation of the H19 gene in two Parp-1-/- ES cells compared to wild-type cells (Fig. 4B). We also observed a higher level of induction of trophoblast stem cell marker gene caudal-related homeobox 2 (Cdx2) [25]. The induction of trophoblast giant cell marker gene, proliferin (Plf) [26] was only observed in Parp-1-/- ES cell lines (Fig. 4B). In contrast, POU domain, class 5, transcription factor 1 (Oct3/4) gene, which is a marker gene of undifferentiated ES cells [27], was gradually down-regulated in both genotypes during differentiation, although the expression level of Oct 3/4 gene became slightly lower in Parp-1-/- than in Parp-1+/+ ES cell lines at day 7 after withdrawal of LIF (Fig. 4B).
These results suggest that the potential for differentiation into trophoblasts is increased in ES cells under Parp-1 deficiency.
Possible roles of Parp-1 in global gene expression profiles
Using genome-wide analysis of gene expression in different cell types, we showed that the expression of a number of genes is affected by the loss of Parp-1 in both ES cells as well as in the liver. The results suggest that Parp-1 may be involved directly or indirectly in maintenance of their regulation of expression. The genes that showed altered expressions in Parp-1-/- ES cells, livers and EF cells are mostly different depending on the cell type, and are not apparently clustered at particular loci on specific chromosomes, and both house-keeping and inducible genes were present in the affected gene lists. Functional categorization of the altered genes in Parp-1-/- ES cells and livers showed that these genes are involved in various cellular processes (Fig. 3B). The Parp-1-/- and Parp-1+/+ ES cells, which we used showed no difference in growth rate [28] and cell-cycle distribution [29], and the karyotype is the same (2n = 40) [28]. In mice, we did not observe any differences in body weight nor in the histology of the livers between Parp-1 genotypes. Therefore, the differences in gene expression should not be caused indirectly by differences in growth and cell proliferation but might be intrinsic to the absence of Parp-1 molecules. In the case of the EF cells, about 1% of the analyzed genes showed altered levels of expression. We did not observe any genes overlapping between the report on Parp-1-/- EF cells disrupted at exon 2 [10], and our present results with the exon 1 disrupted EFs. This may be possibly due to differences in targeting construct, genetic backgrounds or the heterogeneity of EFs.
Accumulating evidence suggests that Parp-1 regulates gene expression by modulating transcriptional factors, including YY1 [30], Oct-1 [31], NF-κB [32], E47 [33], and TEF-1 [34]. In these cases, Parp-1 stimulates loading of these transcriptional factors to cognate target sequences through protein-protein interaction. However, it is noteworthy that the target genes of these transcription factors did not show altered expression in this study. Parp-1 is also able to act as co-activator for retinoic acid receptor (RAR)-mediated transcription of Rarβ2 gene [35] and β-catenin/TCF4 complex-dependent transcription [36]. In the case of RXRα [7], Parp-1 may act as a co-repressor for ligand-induced gene activation. Again, in this study, the target genes for Rarβ2 or RXRα genes were not deregulated in Parp-1-/- ES cells and in the livers. It is thus suggested that loss of Parp-1 may affect the maintenance of basal expression level of a wide variety of the genes in ES cells and the livers through different mechanisms from the regulation involving these transcription factors.
In addition, PARP-1 binds to the scaffold/matrix attachment region (S/MARs) containing partially unwound AT-rich sequences that form local non-B structures [37]. PARP-1 binds to other non-B DNA structures including hairpin, cruciform, and loop, and is catalytically activated [38]. The variations of gene promoter/enhancer structure and Parp-1 binding and recruitment in different cell types may be possibly related to the observed differences in the effect of Parp-1 deficiency on expression profiles.
Since PARP inhibitors are shown to cause hypermethylation of particular genes [13], loss of Parp-1 may possibly cause local changes in DNA methylation pattern during DNA replication and may further affect histone acetylation or methylation, thereby causing genome wide alteration of gene expression after rounds of cell division. In this context, it is notable that similar to the case of Parp-1-/- cells, the majority (71%) of differentially expressed genes (153/17,664 genes) was down-regulated in the cells deficient in Trrap, a co-factor of histone acetyltransferase [39].
Parp-1 is able to modify histones and contributes to the opening of condensed highly ordered chromatin structures [40]. Furthermore, Parp-1 is a structural component of the transcriptionally repressed state of chromatin, and transcription is reported to be activated by auto-modification activity in an NAD-dependent manner [12]. Therefore, the roles of Parp-1 as a chromatin-modifying factor may contribute to maintenance of global gene expression during cell proliferation through mechanisms involving polyADP-ribosylation, protein-protein interaction, and poly(ADP-ribose)-protein interactions.
Biological impact of Parp-1 deficiency on gene expression relating to differentiation
We observed genes involved in the pathway of extraembryonic tissue development, namely H19, Sparc, Sox17, and Gata6, are up-regulated in untreated Parp-1-/- ES cells (Table 3). In addition, during differentiation of ES cells after withdrawal of LIF, expression of H19 as well as other trophoblast marker genes were further up-regulated in Parp-1-/- ES cells compared to Parp-1+/+ ES cells (Fig. 4B). We previously reported that the increase of trophoblast marker genes, Plf, Prlpa, and Tcfap2 was detected in untreated Parp-1-/- ES clone (p < 0.05) using GeneSpring 4.2 [15]. In the present paper, these genes were not picked up by GeneSpring 6.1 using two Parp-1-/- ES clones, probably because the criteria which we applied in this study were highly restricted and the expression level of the genes needed to be relatively high in at least one genotype. This is consistent with the fact that the gene expression changes associated with trophoblast induction were observed only in a subpopulation of ES cells by in situ hybridization [15]. In fact, Plf gene expression is not detectable in undifferentiated Parp-1+/+ and Parp-1-/- ES cells by RT-PCR (Fig. 4B). In contrast, the differentially expressed genes picked up in the present study are expected to be the representative genes affected in a large cell population. H19 is likely to be one of such genes in Parp-1-/- ES cells.
The biological function of H19 RNA has not been fully understood yet. Several lines of evidence show that the H19 gene is involved in extraembryonic tissue development as briefly mentioned earlier. The homozygous mutant animals with a targeted deletion of the maternal H19 gene are viable and fertile and display an overgrowth phenotype of fetus and placentae compared with wild-type [41]. Mouse parthenogenetic embryos showing the monoallelic expression of the H19 gene exhibit functional defects in placentae [18], suggesting that the H19 gene may play an important role in the extraembryonic tissue development, especially in placentae.
Increased potential of Parp-1-/- ES cells to differentiation into trophoblasts seemed to reflect preferential differentiation of Parp-1-/- ES cells to trophoblasts triggered by LIF withdrawal, as shown in Fig. 4B. Early increase of H19 expression suggests that the H19 gene might act as an upstream regulator for the trophoblast differentiation pathway.
Conclusion
These results suggest that Parp-1 is required to maintain transcriptional regulation of a wide variety of genes on a genome-wide scale. In Parp-1-/- ES cells and livers, we observed that the majority of the altered genes were down-regulated. These down- and up-regulated genes are involved in a variety of cellular processes, including transcription, metabolism, signaling, immune response, cell structure, and other cellular processes. In this study, we showed that the pathway of extraembryonic tissues including trophoblast lineage is potentially up-regulated at an untreated state and after differentiation stimuli in Parp-1-/- ES cells. The gene expression profiles in Parp-1-deficient cells may be useful to delineate the functional role of Parp-1 in epigenetic regulation of the genomes involved in various biological phenomena.
Methods
Cell lines and culture conditions
Parp-1-/- ES cell clones, 210-58 and 226-47, established independently from Parp-1+/- ES cells clones, 210 and 226, respectively, were used in this study [28]. They were all derived from male J1 ES cells. The ES cell lines were maintained in Dulbecco's modified Eagle's medium (Invitrogen) containing 20% fetal calf serum supplemented with amino acids and leukemia inhibitory factor (LIF), ESGRO (Chemicon) in the absence of a STO feeder, and total RNA was prepared as described below. Differentiation of ES cells by withdrawal of LIF was induced by inoculating 3 × l06 of ES cells in suspension in a culture dish (OPTILUX® Petri dish, Becton Dickinson) containing 10 ml of ES medium without LIF. Medium was changed at days 3 and 5. At days 3, 5, and 7, all the cells including floating embryoid bodies were collected. The livers were prepared from Parp-1+/+ and Parp-1-/- female mice at 13 months of age [42], and about one-fifth of the amount of livers was used for total RNA extraction. Primary mouse embryonic fibroblasts (EFs) were derived from embryos at day 13.5 obtained by sister-brother mating of Parp-1+/- mice with a 129Sv/ICR mixed genetic background as previously described [43]. Briefly, each embryo was minced, trypsinized, and dispersed cells were incubated for 1 or 2 days until the EF cells became confluent. The EF cells were replated on four dishes and when they became confluent, these EF cells were defined to be at the 3 population doubling level (PDL). When the EF cells reached 6 PDL, they were harvested when they reached half confluency.
Total RNA isolation
Total RNA was extracted from ES cells, the livers, and EF cells using Isogen (Nippon Gene). Fifty micrograms of total RNA were treated with 5 units of DNase I (Invitrogen) for 15 min at room temperature, and purified again with Isogen.
Oligonucleotide microarray
Sample preparation and microarray processing were carried out according to the protocol supplied by Affymetrix. Briefly, 5 μg of total RNA sample treated with DNase I were reverse-transcribed by Superscript II reverse transcriptase (Invitrogen) using T7-(dT)24 primer containing T7 RNA polymerase promoter sequence. After second-strand complementary DNA (cDNA) synthesis, the product was used in an in vitro transcription reaction to generate biotinylated complementary RNA (cRNA) using a BioArray™ HighYield™ RNA Transcript Labeling Kit (Enzo Diagnostics, Inc). Fifteen micrograms of fragmented cRNA were hybridized to a murine genome U74A version 2 micro-array (Affymerix) for 16–18 hours at 45°C with constant rotation at 60 rpm. This high-density oligonucleotide microarray contained 12,488 mouse genes/EST.
After hybridization, the microarray was washed and stained with streptavidin R-phycoerythrin conjugate using an Affymetrix Fluidics Station. The fluorescence intensity was measured twice for each microarray and the average fluorescence intensity was normalized by global scaling to 1,000. The data were saved in Microsoft Excel files, then imported into a GeneSpring® 6.1 software database (Silicon Genetics). The data sets for J1 and 210-58 (Parp-1-/-) ES cells partially discussed in Hemberger et al. [15] were included in this study and further analyzed with GeneSpring® 6.1.
Data analysis
Data analysis was performed with the GeneSpring® 6.1 software. For statistical analyses, the fluorescence intensity (raw signal) was normalized to the median reading per chip, and then normalized to median reading per gene.
We used 6 replicates for each non-parametric tests with the global standard error model being inactive because more than five replicates were recommended for the tests. In the case of Parp-1-/- ES cells, 6 replicates consisting of triplicate microarray results from two Parp-1-/- ES cell lines were used. In the case of livers, 6 replicates consisting of triplicates obtained from two different animals, respectively, were used for each genotype. In the case of EF cells, 3 replicates obtained using three different embryos were used for each genotype and the global standard error model was active. We excluded those genes that showed a standard deviation greater than 2.0 in the normalized data of both genotypes, therefore, we started analysis with 9,907, 12,353, and 12,359 genes and ESTs for ES cells, livers, and EFs, respectively (Table 1). We constructed gene lists only with the genes that showed statistical differences (p < 0.05 or p < 0.01) and 2-fold or greater differences in normalized expression levels between Parp-1 genotypes. To construct heatmaps, we used GeneSpring® GX ver. 7.3.1 (the latest version).
Northern blot analysis
Total RNA samples (10 μg) were used for northern blot analysis as described elsewhere [15]. We used the 90 bp (Igfbp3) or the 89 bp (Galnt1) cDNA fragment as a probe. The membrane was hybridized with the probe and was washed. The membrane was exposed to a Fuji Imaging Plate (Fuji film), and the radioactivities were analyzed using BAS-2500 Bio-imaging analyzer (Fuji film).
Reverse transcription polymerase chain reaction (RT-PCR)
We used Superscript™ III First-Strand Synthesis System for RT-PCR kit (Invitrogen). First-strand cDNA was synthesized from 2 μg each of DNase I-treated total RNA using an oligo(dT)20 primer and Superscript™ III reverse transcriptase. After the first-strand cDNA synthesis, PCR amplification was performed using TAKARA Ex Taq (Takara Bio) with primers listed in Table S1 (see Additional file 1). The thermal cycle conditions were as follows: 94°C for 2 min, then 18 cycles (Oct3/4), 20 cycles (Gapdh), 22 cycles (Fig. 4B) or 24 cycles (Fig. 4A) (H19 and Igf2). For Cdx2, 30 cycles at 94°C for 30 sec, 60°C for 30 sec, and 72°C for 30 sec were carried out. For Plf, 94°C for 2 min, then 40 cycles at 94°C for 30 sec, 68°C for 2 min 30 sec, and then 72°C for 3 min. Products were run on 1.5–3% agarose gel and stained with ethidium bromide. Confirmation of PCR products was carried out by direct sequencing.
Authors' contributions
HO, TN, TO, M. Maeda, HS, YM, HN, and M. Masutani designed the experiments. HO, TN, AG, M. Maeda, and M. Masutani performed the experiments. HO and M. Masutani prepared the manuscript. HS contributed to maintaining Parp-1 knockout mice. M. Masutani, HN, and TS coordinated the project.
Supplementary Material
Table S1. Primers used in this study. Primers used in RT-PCR analysis (Fig. 4).
Acknowledgments
Acknowledgements
This work was supported in part by Grant-in-Aids for the Second Term Comprehensive 10-Year Strategy for Cancer Control and a Grant-in-Aid for Cancer Research from the Ministry of Health, Labour and Welfare of Japan, and for the Third Term Comprehensive Control Research for Cancer from the Ministry of Health, Labour, and Welfare of Japan. HO and AG were awardees of Research Resident Fellowships from the Foundation for Promotion of Cancer Research (Japan) for the Third Term Comprehensive 10-Year-Strategy for Cancer Control from the Ministry of Health, Labour and Welfare of Japan.
Contributor Information
Hideki Ogino, Email: hogino@gan2.res.ncc.go.jp.
Tadashige Nozaki, Email: nozaki@cc.osaka-dent.ac.jp.
Akemi Gunji, Email: agunji@ntmc.hosp.go.jp.
Miho Maeda, Email: mihmaeda@gan2.res.ncc.go.jp.
Hiroshi Suzuki, Email: hisuzuki@obihiro.ac.jp.
Tsutomu Ohta, Email: cota@gan2.res.ncc.go.jp.
Yasufumi Murakami, Email: yasufumi@rs.noda.tus.ac.jp.
Hitoshi Nakagama, Email: hnakagam@gan2.res.ncc.go.jp.
Takashi Sugimura, Email: tsugimur@gan2.res.ncc.go.jp.
Mitsuko Masutani, Email: mmasutan@gan2.res.ncc.go.jp.
References
- Sugimura T. Poly(adenosine diphosphate ribose) Prog Nucleic Acid Res Mol Biol. 1973;13:127–151. doi: 10.1016/s0079-6603(08)60102-6. [DOI] [PubMed] [Google Scholar]
- Realini CA, Althaus FR. Histone shuttling by poly(ADP-ribosylation) J Biol Chem. 1992;267:18858–18865. [PubMed] [Google Scholar]
- Akiyama T, Takasawa S, Nata K, Kobayashi S, Abe M, Shervani NJ, Ikeda T, Nakagawa K, Unno M, Matsuno S, et al. Activation of Reg gene, a gene for insulin-producing beta-cell regeneration: poly(ADP-ribose) polymerase binds Reg promoter and regulates the transcription by autopoly(ADP-ribosyl)ation. Proc Natl Acad Sci USA. 2001;98:48–53. doi: 10.1073/pnas.240458597. [DOI] [PMC free article] [PubMed] [Google Scholar]
- Sawatsubashi S, Maki A, Ito S, Shirode Y, Suzuki E, Zhao Y, Yamagata K, Kouzmenko A, Takeyama K, Kato S. Ecdysone receptor-dependent gene regulation mediates histone poly(ADP-ribosyl)ation. Biochem Biophys Res Commun. 2004;320:268–272. doi: 10.1016/j.bbrc.2004.05.157. [DOI] [PubMed] [Google Scholar]
- Kannan P, Yu Y, Wankhade S, Tainsky MA. PolyADP-ribose polymerase is a coactivator for AP-2-mediated transcriptional activation. Nucleic Acids Res. 1999;27:866–874. doi: 10.1093/nar/27.3.866. [DOI] [PMC free article] [PubMed] [Google Scholar]
- Cervellera MN, Sala A. Poly(ADP-ribose) polymerase is a B-MYB coactivator. J Biol Chem. 2000;275:10692–10696. doi: 10.1074/jbc.275.14.10692. [DOI] [PubMed] [Google Scholar]
- Miyamoto T, Kakizawa T, Hashizume K. Inhibition of nuclear receptor signalling by poly(ADP-ribose) polymerase. Mol Cell Biol. 1999;19:2644–2649. doi: 10.1128/mcb.19.4.2644. [DOI] [PMC free article] [PubMed] [Google Scholar]
- Soldatenkov VA, Chasovskikh S, Potaman VN, Trofimova I, Smulson ME, Dritschilo A. Transcriptional repression by binding of poly(ADP-ribose) polymerase to promoter sequences. J Biol Chem. 2002;277:665–670. doi: 10.1074/jbc.M108551200. [DOI] [PubMed] [Google Scholar]
- Ha HC, Hester LD, Snyder SH. Poly(ADP-ribose) polymerase-1 dependence of stress-induced transcription factors and associated gene expression in glia. Proc Natl Acad Sci USA. 2002;99:3270–3275. doi: 10.1073/pnas.052712399. [DOI] [PMC free article] [PubMed] [Google Scholar]
- Simbulan-Rosenthal CM, Ly DH, Rosenthal DS, Konopka G, Luo R, Wang ZQ, Schultz PG, Smulson ME. Misregulation of gene expression in primary fibroblasts lacking poly(ADP-ribose) polymerase. Proc Natl Acad Sci USA. 2000;97:11274–11279. doi: 10.1073/pnas.200285797. [DOI] [PMC free article] [PubMed] [Google Scholar]
- Tulin A, Spradling A. Chromatin loosening by poly(ADP)-ribose polymerase (PARP) at Drosophila puff loci. Science. 2003;299:560–562. doi: 10.1126/science.1078764. [DOI] [PubMed] [Google Scholar]
- Kim MY, Mauro S, Gevry N, Lis JT, Kraus WL. NAD+-dependent modulation of chromatin structure and transcription by nucleosome binding properties of PARP-1. Cell. 2004;119:803–814. doi: 10.1016/j.cell.2004.11.002. [DOI] [PubMed] [Google Scholar]
- Zardo G, Caiafa P. The unmethylated state of CpG islands in mouse fibroblasts depends on the poly(ADP-ribosyl)ation process. J Biol Chem. 1998;273:16517–16520. doi: 10.1074/jbc.273.26.16517. [DOI] [PubMed] [Google Scholar]
- Nozaki T, Masutani M, Watanabe M, Ochiya T, Hasegawa F, Nakagama H, Suzuki H, Sugimura T. Syncytiotrophoblastic giant cells in teratocarcinoma-like tumors derived from Parp-disrupted mouse embryonic stem cells. Proc Natl Acad Sci USA. 1999;96:13345–13350. doi: 10.1073/pnas.96.23.13345. [DOI] [PMC free article] [PubMed] [Google Scholar]
- Hemberger M, Nozaki T, Winterhager E, Yamamoto H, Nakagama H, Kamada N, Suzuki H, Ohta T, Ohki M, Masutani M, et al. Parp1-deficiency induces differentiation of ES cells into trophoblast derivatives. Dev Biol. 2003;257:371–381. doi: 10.1016/S0012-1606(03)00097-6. [DOI] [PubMed] [Google Scholar]
- Poirier F, Chan CT, Timmons PM, Robertson EJ, Evans MJ, Rigby PW. The murine H19 gene is activated during embryonic stem cell differentiation in vitro and at the time of implantation in the developing embryo. Development. 1991;113:1105–1114. doi: 10.1242/dev.113.4.1105. [DOI] [PubMed] [Google Scholar]
- Rachmilewitz J, Gileadi O, Eldar-Geva T, Schneider T, de-Groot N, Hochberg A. Transcription of the H19 gene in differentiating cytotrophoblasts from human placenta. Mol Reprod Dev. 1992;32:196–202. doi: 10.1002/mrd.1080320303. [DOI] [PubMed] [Google Scholar]
- Kono T, Sotomaru Y, Katsuzawa Y, Dandolo L. Mouse parthenogenetic embryos with monoallelic H19 expression can develop to day 17.5 of gestation. Dev Biol. 2002;243:294–300. doi: 10.1006/dbio.2001.0561. [DOI] [PubMed] [Google Scholar]
- Mason IJ, Taylor A, Williams JG, Sage H, Hogan BL. Evidence from molecular cloning that SPARC, a major product of mouse embryo parietal endoderm, is related to an endothelial cell 'culture shock' glycoprotein of Mr 43,000. Embo J. 1986;5:1465–1472. doi: 10.1002/j.1460-2075.1986.tb04383.x. [DOI] [PMC free article] [PubMed] [Google Scholar]
- Kanai-Azuma M, Kanai Y, Gad JM, Tajima Y, Taya C, Kurohmaru M, Sanai Y, Yonekawa H, Yazaki K, Tarn PP, et al. Depletion of definitive gut endoderm in Sox17-null mutant mice. Development. 2002;129:2367–2379. doi: 10.1242/dev.129.10.2367. [DOI] [PubMed] [Google Scholar]
- Koutsourakis M, Langeveld A, Patient R, Beddington R, Grosveld F. The transcription factor GATA6 is essential for early extraembryonic development. Development. 1999;126:723–32. [PubMed] [Google Scholar]
- Gabory A, Ripoche MA, Yoshimizu T, Dandolo L. The H19 gene: regulation and function of a non-coding RNA. Cytogenet Genome Res. 2006;113:188–193. doi: 10.1159/000090831. [DOI] [PubMed] [Google Scholar]
- Robertson EJ. Embryo-derived stem cell lines. In: Robertson EJ, editor. Teratocarcinomas and embryonic stem cells: a practical approach. Oxford IR Press; 1987. pp. 71–112. [Google Scholar]
- Leahy A, Xiong JW, Kuhnert F, Stuhlmann H. Use of developmental marker genes to define temporal and spatial patterns of differentiation during embryoid body formation. J Exp Zool. 1999;284:67–81. doi: 10.1002/(SICI)1097-010X(19990615)284:1<67::AID-JEZ10>3.0.CO;2-O. [DOI] [PubMed] [Google Scholar]
- Tanaka S, Kunath T, Hadjantonakis AK, Nagy A, Rossant J. Promotion of trophoblast stem cell proliferation by FGF4. Science. 1998;282:2072–2075. doi: 10.1126/science.282.5396.2072. [DOI] [PubMed] [Google Scholar]
- Lee SJ, Talamantes F, Wilder E, Linzer DI, Nathans D. Trophoblastic giant cells of the mouse placenta as the site of proliferin synthesis. Endocrinology. 1988;122:1761–1768. doi: 10.1210/endo-122-5-1761. [DOI] [PubMed] [Google Scholar]
- Palmieri SL, Peter W, Hess H, Scholer HR. Oct-4 transcription factor is differentially expressed in the mouse embryo during establishment of the first two extraembryonic cell lineages involved in implantation. Dev Biol. 1994;166:259–267. doi: 10.1006/dbio.1994.1312. [DOI] [PubMed] [Google Scholar]
- Masutani M, Nozaki T, Nishiyama E, Ochiya T, Nakagama H, Wakabayashi K, Suzuki H, Sugimura T. Establishment of poly(ADP-ribose) polymerase-deficient mouse embryonic stem cell lines. Proc Japan Acad. 1998;74B:233–236. [Google Scholar]
- Ogino H, Shibata A, Gunji A, Suzuki H, Nakagama H, Sugimura T, Masutani M. Agent-dependent effects of Parp-1 deficiency on DNA damage responses and genomic stability in mouse ES cells. In: Greer EV, editor. New Developments in Stem Cell Research. New York: Nova Science Publishers; 2006. pp. 133–147. [Google Scholar]
- Oei SL, Griesenbeck J, Schweiger M, Ziegler M. Regulation of RNA polymerase II-dependent transcription by poly(ADP-ribosyl)ation of transcription factors. J Biol Chem. 1998;273:31644–31647. doi: 10.1074/jbc.273.48.31644. [DOI] [PubMed] [Google Scholar]
- Nie J, Sakamoto S, Song D, Qu Z, Ota K, Taniguchi T. Interaction of Oct-1 and automodification domain of poly(ADP-ribose) synthetase. FEBS Lett. 1998;424:27–32. doi: 10.1016/S0014-5793(98)00131-8. [DOI] [PubMed] [Google Scholar]
- Hassa PO, Buerki C, Lombard C, Imhof R, Hottiger MO. Transcriptional coactivation of nuclear factor-kappaB-dependent gene expression by p300 is regulated by poly(ADP)-ribose polymerase-1. J Biol Chem. 2003;278:45145–45153. doi: 10.1074/jbc.M307957200. [DOI] [PubMed] [Google Scholar]
- Dear TN, Hainzl T, Follo M, Nehls M, Wilmore H, Matena K, Boehm T. Identification of interaction partners for the basic-helix-loop-helix protein E47. Oncogene. 1997;14:891–898. doi: 10.1038/sj.onc.1200912. [DOI] [PubMed] [Google Scholar]
- Butler AJ, Ordahl CP. Poly(ADP-ribose) polymerase binds with transcription enhancer factor 1 to MCAT1 elements to regulate muscle-specific transcription. Mol Cell Biol. 1999;19:296–306. doi: 10.1128/mcb.19.1.296. [DOI] [PMC free article] [PubMed] [Google Scholar]
- Pavri R, Lewis B, Kim TK, Dilworth FJ, Erdjument-Bromage H, Tempst P, de Murcia, G, Evans R, Chambon P, Reinberg D. PARP-1 determines specificity in a retinoid signaling pathway via direct modulation of mediator. Mol Cell. 2005;18:83–96. doi: 10.1016/j.molcel.2005.02.034. [DOI] [PubMed] [Google Scholar]
- Idogawa M, Yamada T, Honda K, Sato S, Imai K, Hirohashi S. Poly(ADP-ribose) polymerase-1 is a component of the oncogenic T-cell factor-4/beta-catenin complex. Gastroenterology. 2005;128:1919–1936. doi: 10.1053/j.gastro.2005.03.007. [DOI] [PubMed] [Google Scholar]
- Galande S, Kohwi-Shigematsu T. Poly(ADP-ribose) polymerase and Ku autoantigen form a complex and synergistically bind to matrix attachment sequences. J Biol Chem. 1999;274:20521–20528. doi: 10.1074/jbc.274.29.20521. [DOI] [PubMed] [Google Scholar]
- Lonskaya I, Potaman VN, Shlyakhtenko LS, Oussatcheva EA, Lyubchenko YL, Soldatenkov VA. Regulation of poly(ADP-ribose) polymerase-1 by DNA structure-specific binding. J Biol Chem. 2005;280:17076–17083. doi: 10.1074/jbc.M413483200. [DOI] [PubMed] [Google Scholar]
- Herceg Z, Li H, Cuenin C, Shukla V, Radolf M, Steinlein P, Wang ZQ. Genome-wide analysis of gene expression regulated by the HAT cofactor Trrap in conditional knockout cells. Nucleic Acids Res. 2003;31:7011–7023. doi: 10.1093/nar/gkg902. [DOI] [PMC free article] [PubMed] [Google Scholar]
- Kraus WL, Lis JT. PARP goes transcription. Cell. 2003;113:677–683. doi: 10.1016/S0092-8674(03)00433-1. [DOI] [PubMed] [Google Scholar]
- Ripoche MA, Kress C, Poirier F, Dandolo L. Deletion of the H19 transcription unit reveals the existence of a putative imprinting control element. Genes Dev. 1997;11:1596–1604. doi: 10.1101/gad.11.12.1596. [DOI] [PubMed] [Google Scholar]
- Nozaki T, Fujihara H, Watanabe M, Tsutsumi M, Nakamoto K, Kusuoka O, Kamada N, Suzuki H, Nakagama H, Sugimura T, et al. Parp-1 deficiency implicated in colon and liver tumorigenesis induced by azoxymethane. Cancer Sci. 2003;94:497–500. doi: 10.1111/j.1349-7006.2003.tb01472.x. [DOI] [PMC free article] [PubMed] [Google Scholar]
- Nozaki T, Fujihara H, Kamada N, Ueda O, Takato T, Nakagama H, Sugimura T, Suzuki H, Masutani M. Hyperploidy of embryonic fibroblasts derived from Parp-1 knockout mouse. Proc Jpn Acad. 2001;77B:121–124. [Google Scholar]
Associated Data
This section collects any data citations, data availability statements, or supplementary materials included in this article.
Supplementary Materials
Table S1. Primers used in this study. Primers used in RT-PCR analysis (Fig. 4).