

Abstract
Objectives To assess sexual behaviour, prevalence of ICD-10 diagnosed sexual dysfunction, associations between sexual and psychological problems, and help seeking for sexual problems in people attending general practice; to assess predictors of ICD-10 diagnosis of sexual dysfunction.
Design Cross sectional study.
Setting 13 general practices in London.
Participants 1065 women and 447 men attending general practices.
Main outcome measure Prevalence and predictors of ICD-10 diagnoses of sexual dysfunction.
Results 97 (22%, 95% confidence interval 18% to 25%) men and 422 (40%, 37% to 43%) women received at least one ICD-10 diagnosis, but only 3-4% had an entry relating to sexual problems in their general practice notes. The most common problems were erectile failure and lack or loss of sexual desire in men and lack or loss of sexual desire and failure of orgasmic response in women. Increasing age and being unemployed predicted sexual problems in women, and bisexual orientation, being non-white, and being unemployed were demographic predictors in men. No practice note factors predicted sexual problems in women, but high consulting rate predicted problems in men. The main clinical predictors were poor physical function and dissatisfaction with current sex life in both sexes and higher psychological morbidity in women. When all factors were considered, increasing age (odds ratio 1.01, 1.00 to 1.02), physical subscale score on the SF-12 (0.98, 0.97 to 0.99), sexual dissatisfaction (1.9, 1.5 to 2.4), and scoring over a 3/4 threshold score on the general health questionnaire (1.5, 1.1 to 1.9) independently predicted an ICD-10 sexual dysfunction diagnosis in women. Being bisexual (4.1, 1.3 to 12.8) was the only independent predictor of an ICD-10 diagnosis in men.
Conclusions Sexual difficulties are common in people attending general practitioners, and many people are prepared to talk about them with their doctors.
Introduction
Little is known about the nature and prevalence of sexual problems in people attending their general practitioners and whether doctors recognise such problems. Four community studies of sexual difficulties in women and five studies in men have been published in the past decade. Only one study defined sexual problems in diagnostic terms, and none considered the role of primary care professionals in the recognition and management of these problems.1 In the only study of sexual problems conducted in the United Kingdom, people registered with four general practices completed anonymous postal questionnaires on sexual problems and associated psychological difficulties.2 A 44% response rate, use of unvalidated questions, and the absence of data on the involvement of the general practitioner limited the health service utility of the study.
We studied people attending London general practitioners in order to determine patterns of sexual behaviour, prevalence of ICD-10 defined sexual dysfunction, associations between sexual and psychological problems, and help seeking behaviour for sexual problems in general practice. We also studied predictors of an ICD-10 diagnosis of sexual dysfunction.
Methods
We approached 37 north London general practices situated in areas of high, medium, and low socioeconomic deprivation. We asked consecutive attenders aged 18 to 75 years to participate in the study, after giving them a detailed information sheet on the study procedures. People who consented to take part completed a structured questionnaire, by pen and paper or computer assisted interview. The interview contained six elements. (1) Standard demographic questions. (2) The brief sexual function questionnaire for men and a modified version for women.3-5 The questionnaires enquire about sexual behaviour, sexual difficulties, sexual orientation with the Kinsey scale,6 and sexual satisfaction in the preceding four weeks. Both provide sufficient information to make a diagnosis of sexual dysfunction according to ICD-10 (international classification of diseases, 10th revision).7 We added a question on seeking sexual advice from the general practitioner. (3) The SF-12 questionnaire for quality of life.8 (4) The 12 item general health questionnaire, for which we used a threshold score of ≥ 3 to identify a psychological disorder.9 (5) The CAGE questionnaire, in which a score of ≥ 2 indicates misuse of alcohol.10 We also asked people if they smoked cigarettes. (6) Four validated screening questions about child sexual abuse summed to a total score.11
We piloted the pen and paper and computer assisted versions with 50 volunteers to ensure the acceptability of these methods in this setting. A proportion of people were reluctant to use the computer assisted version, so in the main study we also provided the pen and paper alternative. We asked people attending the practice to participate in a private setting as they waited to see the doctor. We also provided information about professional help for sexual problems when needed. We collected data from the practice records on consultation rates and entries about sexual health, sexual function, or psychological problems in the preceding two years. We also collected prescription data on all medicines and those with effects on sexual function.12
Statistical analysis
We grouped responses to the brief sexual function questionnaires in order to meet conservative criteria for an ICD-10 diagnosis, requiring the problem to be present all or almost all of the time for each diagnosis (box). People who report no sexual activity with a partner are often excluded from prevalence estimates.13 However, this assumes that they do not have problems and reduces the power of the analysis. We examined any sexual problem reported without requiring that participants had a sexual partner or reported sexual intercourse in the preceding four weeks.
In order to relate the Kinsey ratings of same sex behaviour to people's self identification, we condensed the seven categories into three—namely, entirely heterosexual (Kinsey rating 1), bisexual to some degree (Kinsey ratings 2-4), and predominately homosexual (Kinsey ratings 5-7).
ICD-10 Diagnostic classification
(Diagnosis based on reported behaviour in the preceding four weeks)
Both sexes
F52.0—Lack or loss of sexual desire: no feelings of sexual drive reported
F52.1—Sexual aversion and lack of sexual enjoyment: refused all sexual advances made in the past four weeks
F 52.6—Non-organic dyspareunia: pain in genitals during or after sexual intercourse 75% of the time or more often, in the absence of an organic cause
Men (on the basis of problems during sexual intercourse)
F 52.2—Erectile disorder: no erection or penis too soft for penetration
F 52.3—Inhibited orgasm: cannot ejaculate 75% of the time or more often
F 52.4—Premature ejaculation: ejaculates on insertion sooner than desired 75% of the time or more often
Women (on the basis of problems during sexual intercourse)
F 52.2—Female sexual arousal disorder: no arousal reported
F52.3—Female orgasmic dysfunction: fails to reaches orgasm at least 75% of the time
F 52.5—Non-organic vaginismus: vaginal tightness such that penetration is uncomfortable or difficult at least 75% of the time, in the absence of organic disorders
After assessing sexual behaviour and prevalence of ICD-10 sexual dysfunction, we examined potential predictors of at least one ICD-10 diagnosis (F52.0 to F52.6), basing our search on the way information is gathered during a general practice consultation. Doctors initially consider the demographic characteristics of the patient before scanning the general practice records and finally collecting relevant clinical information. We present unadjusted odds ratios, as they are useful where the doctor has only limited information on a patient. We also present adjusted odds ratios to illustrate the relative contribution of each predictor variable after adjustment for related, potentially confounding, variables. Thus we first estimated unadjusted odds ratios for an ICD-10 diagnosis for demographic data that would be available to family doctors. In a similar analysis, we examined the effect of data in practice records. Lastly, we examined relevant clinical data: total scores on the physical subscale of the SF-12, scoring above thresholds on the general health and CAGE questionnaires, Finkelhor sexual abuse scores, smoking, moderate or high sexual satisfaction, and seeking help from general practitioners. We explored whether an association existed between reporting a sexual problem and sexual satisfaction, because it cannot be assumed that these concepts overlap. A woman who reports low sexual drive may be satisfied with her situation. If, however, she also expresses dissatisfaction with sex, this indicates that the low drive is causing appreciable distress.
In order to derive adjusted odds ratios we examined change in the likelihood ratio until further addition of variables did not improve the fit of the model, setting the P to retain criterion as 0.05. We checked each model for stability by repeating the regression with the backward elimination procedure. Lastly, to model predictors if all information was available to the doctor, we entered all statistically significant variables arising from the stepwise regressions into an overall model. We used SPSS (version 10) to analyse the data.
Results
Response rates
Thirteen (35%) practices with 55 doctors took part. We found no significant differences in Jarman scores (which indicate socioeconomic deprivation) between participating and non-participating practices. We asked 3073 attenders to participate; 2121 satisfied the eligibility criteria, and 1512 (71%) agreed to participate (figure). However, only 1080 of these (71%) agreed to scrutiny of their records. One quarter of participants were non-white, and 11% of women and 14% of men were bisexual or homosexual (2-7 on the Kinsey scale) (table 1).
Figure 1.
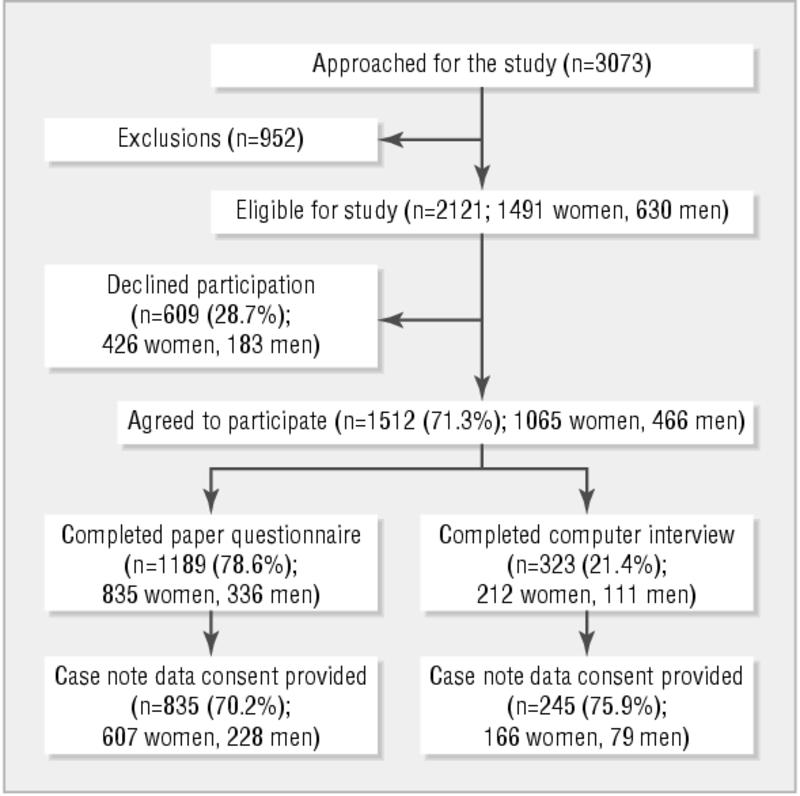
Recruitment flow chart
Table 1.
Demographic details. Values are numbers (percentages) unless stated otherwise
| Women (n=1065) | Men (n=447) | |
|---|---|---|
| Mean (SD) age (years)* | 33 (12.1) | 36 (12.5) |
| Ethnic origin†: | ||
| White (British) | 583 (55.1) | 258 (58.5) |
| White (others) | 138 (13.0) | 55 (12.5) |
| White (Irish) | 66 (6.2) | 19 (4.3) |
| Black (Caribbean) | 112 (10.6) | 36 (8.2) |
| Black (African) | 52 (4.9) | 31 (7.0) |
| Black (others) | 31 (2.9) | 14 (3.2) |
| South Asian | 34 (3.3) | 10 (2.2) |
| Chinese | 8 (0.8) | 3 (0.7) |
| Others | 35 (3.3) | 15 (3.4) |
| Occupational status‡: | ||
| Employed (full time) | 421 (39.9) | 270 (61.2) |
| Employed (part time) | 167 (15.8) | 28 (6.3) |
| Student | 170 (16.1) | 46 (10.4) |
| Housewife | 137 (13.0) | 6 (1.4) |
| Unemployed seeking work | 87 (8.2) | 49 (11.1) |
| Retired | 39 (3.7) | 21 (4.8) |
| Receiving sickness benefit | 35 (3.3) | 21 (4.8) |
| Civil status§: | ||
| Married | 257 (24.3) | 116 (26.4) |
| Living with partner | 268 (25.3) | 105 (23.9) |
| Single | 424 (40.1) | 175 (39.8) |
| Divorced | 54 (5.1) | 22 (5.0) |
| Separated | 35 (3.3) | 18 (4.1) |
| Widowed | 20 (1.9) | 4 (0.9) |
| Sexual orientation—experience¶: | ||
| Entirely heterosexual (Kinsey 1) | 934 (89.4) | 373 (85.9) |
| Bisexual to some degree (Kinsey 2-4) | 85 (8.1) | 23 (5.3) |
| Predominately homosexual (Kinsey 5-7) | 26 (2.5) | 38 (8.8) |
| Sexual orientation—desire¶: | ||
| Entirely heterosexual (Kinsey 1) | 876 (83.8) | 366 (84.3) |
| Bisexual to some degree (Kinsey 2-4) | 142 (13.6) | 31 (7.2) |
| Predominately homosexual (Kinsey 5-7) | 27 (2.6) | 37 (8.5) |
Non-responders: 9 women, 5 men.
Non-responders: 6 women, 6 men.
Non-responders: 9 women, 6 men.
Non-responders: 7 women, 7 men.
Non-responders: 20 women, 13 men.
Sexual behaviour and satisfaction with sex
Two thirds of participants reported sexual intercourse in the preceding month (table 2). Men were significantly more likely than women to report having masturbated and to express satisfaction with their sex life. Of the 139 (32%) men who did not report sexual intercourse, 81 (58%) had masturbated and 17 (12%) had received oral sex in the preceding four weeks. Of the 357 (34%) women who did not report sexual intercourse in the preceding four weeks, 108 (30%) had masturbated and 18 (5%) had received oral sex in the preceding four weeks. People who had not had sexual intercourse were much more likely to be dissatisfied with their sex life than the remainder (women: odds ratio 10.3, 95% confidence interval 7.4 to 14.2; men: 8.2, 5.1 to 13.2).
Table 2.
Sexual activity in preceding four weeks. Values are numbers (percentages)
| Sexual activity | Women (n=1065) | Men (n=447) |
|---|---|---|
| Sexual intercourse† | ||
| Not at all | 357 (33.8) | 139 (31.7) |
| At least once: | 699 (66.2) | 299 (68.3) |
| Less than once a week | 248 (23.5) | 109 (24.9) |
| Less than daily | 390 (37.0) | 159 (36.3) |
| Daily or more often | 61 (5.8) | 31 (7.1) |
| Masturbation‡ | ||
| Not at all | 692 (65.6)** | 160 (36.7)** |
| At least once: | 363 (34.4) | 276 (63.3) |
| Less than once a week | 232 (22.0) | 116 (26.6) |
| Less than daily | 112 (10.6) | 126 (28.9) |
| Daily or more often | 19 (1.8) | 34 (7.8) |
| Received oral sex§ | ||
| Not at all | 637 (60.6)** | 209 (47.6)** |
| At least once: | 415 (39.4) | 230 (52.4) |
| Less than once a week | 216 (20.5) | 111 (25.3) |
| Less than daily | 179 (17.1) | 102 (23.2) |
| Daily or more often | 20 (1.9) | 17 (3.9) |
| Number of sex partners¶ | ||
| One partner | 695 (66.3) | 275 (62.8) |
| Two to 10 partners | 37 (3.5) | 43 (9.8) |
| None | 316 (30.2) | 120 (27.4) |
| Satisfaction with sex life†† | ||
| Dissatisfied | 345 (33.2)* | 123 (28.0)* |
| Neither satisfied nor dissatisfied | 183 (17.6) | 37 (8.4) |
| Satisfied | 512 (49.2) | 279 (63.6) |
χ2 result: *P≤0.05; **P≤0.001. †Non-responders: 9 women, 9 men. ‡Non-responders: 10 women, 11 men. §Non-responders: 13 women, 8 men. ¶Non-responders: 17 women, 9 men. ††Non-responders: 25 women, 8 men.
ICD-10 diagnoses
Significantly fewer men (97, 22%) than women (422, 40%) received at least one ICD-10 diagnosis of sexual dysfunction (table 3). Erectile failure and loss of sexual desire were the most common problems in men, and lack of sexual desire and failure of orgasmic response were the most common in women. One hundred and thirty five (13%) women and 27 (6%) men received a diagnosis of lack or loss of sexual desire (F52.0) without any other sexual problem. Women were significantly more likely to receive diagnoses of lack or loss of sexual desire and dyspareunia than were men.
Table 3.
Prevalence of ICD-10 sexual dysfunction. Values are numbers (percentages, 95% confidence intervals)
| ICD-10 sexual dysfunction | Men (n=447) | Women (n=1065) |
|---|---|---|
| Lack or loss of sexual desire (ICD-10 code F52.0)† | 30 (6.7, 4.6 to 9.4)** | 179 (16.8, 14.6 to 19.1)** |
| Sexual aversion (F52.1)‡ | 11 (2.5, 1.2 to 4.4) | 44 (4.2, 3.0 to 5.5) |
| Failure of genital response (F52.2): | ||
| Male erectile dysfunction (F52.2) (failure at insertion during intercourse)§ | 38 (8.8, 6.4 to 11.8) | NA |
| Female sexual arousal dysfunction (F52.2)¶ | NA | 38 (3.6, 2.5 to 4.9) |
| Orgasmic dysfunction (F52.3 and F52.4): | ||
| Male orgasmic dysfunction (F52.3) (inhibited orgasm during intercourse)†† | 11 (2.5, 1.2 to 4.4) | NA |
| Premature ejaculation (F52.4) (at insertion during intercourse)‡‡ | 16 (3.7, 2.1 to 5.7) | NA |
| Inhibited female orgasm (F52.3) (during intercourse)§§ | NA | 198 (18.9, 16.5 to 21.3) |
| Non-organic vaginismus (F52.5)¶¶ | NA | 48 (4.6, 3.3 to 5.9) |
| Non-organic dyspareunia (F52.6)††† | 5 (1.1, 0.4 to 2.6)* | 31 (2.9, 2.0 to 4.1)* |
| At least one ICD-10 diagnosis | 97 (21.7, 17.9 to 25.5)** | 422 (39.6, 36.7 to 42.6)** |
NA=not applicable. χ2 result: *P≤0.05; **P≤0.001. †Non-responders: 5 men, 5 women. ‡Non-responders: 5 men, 15 women. §Non-responders: 14 men. ¶Non-responders: 25 women. ††Non-responders: 12 men. ‡‡Non-responders: 20 men. §§Non-responders: 18 women. ¶¶Non-responders: 15 women. †††Non-responders: 5 men, 11 women.
Sexual dysfunction and psychological status
Men receiving an ICD-10 diagnosis were significantly more psychologically distressed than other men (general health questionnaire grouped median score 1.8 v 0.9, z = 2.43, P = 0.015), as were women who received a diagnosis compared with those who did not (2.2 v 1.3, z = 4.24, P < 0.0005). The ICD-10 diagnoses that were associated with greatest emotional distress were erectile dysfunction (mean general health questionnaire score 4.0 (SD 4.1)) and dyspareunia (6.2 (2.2)) in men and aversion to sex (4.6 (3.8)) and loss or lack of arousal (4.3 (4.0)) in women.
Help seeking behaviour from general practitioners
Three hundred and fourteen (30%) women and 92 (21%) men reported ever seeking sexual advice from their doctor. Only 39/174 (22%) women and 5/29 (17%) of men with lack or loss of sexual desire had sought their general practitioner's advice on sexual matters, compared with 132/356 (37%) women and 29/79 (37%) men with other diagnoses. This fell to 24/135 (18%) for women who had lack or loss of sexual desire without any other sexual problem, compared with 71/202 (35%) for women with any other single diagnosis. Corresponding figures for men were 5/26 (19%) and 15/24 (28%). Only 22/773 (3%) women and 12/307 (4%) men had an entry in their family practice records relating to functional sexual difficulties in the previous two years.
Predictors of an ICD-10 diagnosis for each stage of the consultation
Women
Demographic predictors—Women who received an ICD-10 diagnosis were older and more likely to be unemployed than those without such a diagnosis. Both these factors remained as significant predictors after adjustment for other demographic variables (table 4).
Table 4.
Predictors of any ICD-10 diagnosis of sexual dysfunction in women
| Predictors | Unadjusted odds ratio (95% CI) | Adjusted odds ratio*(95% CI) |
|---|---|---|
| Demographic predictors | ||
| Age | 1.01 (1.01 to 1.03) | 1.01 (1.00 to 1.03) |
| White ethnic origin | 1.17 (0.88 to 1.55) | - |
| Employed | 0.76 (0.60 to 0.98) | 0.75 (0.58 to 0.97) |
| Sexuality: | ||
| Entirely heterosexual | 1.00 | - |
| Bisexual to some degree | 1.22 (0.78 to 1.90) | - |
| Predominately homosexual | 0.56 (0.23 to 1.33) | - |
| Cohabiting | 1.13 (0.89 to 1.45) | - |
| Practice record data | ||
| No of prescribed drugs affecting sexual function12 | 1.30 (0.97 to 1.74) | - |
| No of all drugs prescribed | 1.04 (0.96 to 1.14) | - |
| Records entry on sexual function | 0.57 (0.22 to 1.47) | - |
| Records entry on sexual health | 0.86 (0.60 to 1.24) | - |
| Records entry on mental health | 1.18 (0.80 to 1.73) | - |
| Total consultation rate | 1.00 (0.98 to 1.01) | - |
| Clinical information | ||
| SF-12 physical score | 0.98 (0.97 to 0.99) | 0.98 (0.97 to 0.99) |
| Above general health questionnaire threshold | 1.60 (1.25 to 2.05) | 1.50 (1.12 to 1.91) |
| Above CAGE questionnaire threshold | 0.82 (0.60 to 1.12) | - |
| Childhood sexual abuse score | 1.03 (0.92 to 1.14) | - |
| Cigarette smoker | 0.96 (0.74 to 1.24) | - |
| Ever sought help from general practitioner on sexual matters | 0.95 (0.72 to 1.24) | - |
| Dissatisfaction with sex life | 2.06 (1.60 to 2.70) | 1.90 (1.46 to 2.46) |
| No sexual intercourse in preceding four weeks | 1.32 (1.02 to 1.72) | - |
Odds ratio for each predictor adjusted for others in that section of table.
Practice records data—No practice factor was associated with sexual problems in women.
Clinical information—Women with an ICD-10 diagnosis were in poorer physical and psychological health, more dissatisfied with their sexual lives, and less likely to report recent sexual intercourse than other women. On adjustment for all clinical factors, lack of recent intercourse was no longer a significant predictor (table 4).
Backward stepwise regression on the above three groups of factors produced almost identical results.
Final regression model—When we entered all significant predictors arising from the stepwise models into a final model, age in years (odds ratio 1.01, 1.00 to 1.02), higher (poorer function) score on the physical subscale of the SF-12 (0.98, 0.97 to 0.99), sexual dissatisfaction (1.9, 1.5 to 2.4), and scoring over the 3/4 threshold on the general health questionnaire (1.5, 1.1 to 1.9) were independent predictors of an ICD-10 diagnosis of sexual difficulties in women.
Men
Demographic predictors—Men identified as having sexual problems according to ICD-10 were more likely than the remainder to be unemployed and to be bisexual (table 5). On stepwise adjustment, however, being non-white arose as additional predictor.
Table 5.
Predictors of any ICD-10 diagnosis of sexual dysfunction in men
| Predictors | Unadjusted odds ratio (95% CI) | Adjusted odds ratio*(95% CI) |
|---|---|---|
| Demographic predictors | ||
| Age | 1.01 (0.99 to 1.03) | - |
| White ethnic origin | 0.65 (0.40 to 1.07) | 0.58 (0.34 to 0.98) |
| Employed | 0.53 (0.33 to 0.85) | 0.49 (0.30 to 0.79) |
| Sexuality: | ||
| Entirely heterosexual | 1.00 | - |
| Bisexual to some degree | 3.27 (1.38 to 7.76) | 3.37 (1.39 to 8.16) |
| Predominately homosexual | 1.73 9(0.82 to 3.66) | - |
| Cohabiting | 0.94 (0.60 to 1.47) | - |
| Practice record data | ||
| No of prescribed drugs affecting sexual function12 | 1.25 (0.92 to 1.71) | - |
| No of all drugs prescribed | 1.02 (0.90 to 1.20) | - |
| Records entry on sexual function | 2.68 (0.82 to 8.75) | - |
| Records entry on sexual health | 0.80 (0.29 to 2.20) | - |
| Records entry on mental health | 1.00 (0.49 to 2.03) | - |
| Total consultation rate | 1.03 (1.00 to 1.06) | 1.03 (1.00 to 1.07) |
| Clinical information | ||
| SF-12 physical score | 0.96 (0.93 to 0.98) | 0.96 (0.93 to 0.98) |
| Above general health questionnaire threshold | 1.71 (1.08 to 2.69) | - |
| Above CAGE questionnaire threshold | 0.86 (0.53 to 1.39) | - |
| Childhood sexual abuse score | 1.01 (0.85 to 1.20) | - |
| Cigarette smoker | 1.22 (0.77 to 1.95) | - |
| Ever sought help from general practitioner on sexual matters | 0.59 (0.35 to 0.99) | - |
| Dissatisfaction with sex life | 2.30 (1.44 to 3.65) | 2.04 (1.13 to 3.68) |
| No sexual intercourse in preceding four weeks | 1.75 (1.10 to 2.80) | - |
Odds ratio for each predictor adjusted for others in that section of table.
Practice records data—Sexual problems were also associated with a higher consultation rate. This remained significant after adjustment.
Clinical information—Men with sexual problems were in poorer physical and psychological health, more likely to have ever sought sexual advice from their doctor, less likely to report recent sexual intercourse, and less satisfied with their sex lives than other men. However, only poor physical function and dissatisfaction were predictive of a diagnosis after adjustment.
Backward stepwise regression analysis for the above three groups of factors provided nearly identical results.
Final regression model—When we entered all significant predictors into a final model, the only remaining independent predictor was being bisexual (odds ratio 4.1, 1.3 to 12.8).
Discussion
Principal findings
To our knowledge, this is the first study of sexual problems reported by people attending their general practitioners. Sexual difficulties were common, with 40% of women and 22% of men receiving one or more ICD-10 diagnosis. Independent predictors of such a diagnosis were increasing age, poorer physical health, increasing psychological distress, and sexual dissatisfaction in women and being bisexual in men.
Strengths and limitations of the study
Our study contributes to findings from population studies by applying ICD-10 diagnostic criteria and identifying predictors of the diagnoses in general practice. The ICD-10 criteria do not require a specific level of distress; however, scores on the general health questionnaire indicated that diagnoses were closely associated with emotional distress. Another strength of our study is that we did not restrict the analyses to people reporting current sexual activity. At least a third of participants reported no sexual intercourse in the previous four weeks, and these people were more likely to report sexual problems and were less satisfied with their sex lives. A weakness of our study was low numbers of men relative to women. Physical and psychological status predicted an ICD-10 diagnosis in men, but they dropped out of the final model, possibly because of lack of power. Whereas the age distribution of women matched general practice attenders nationally, the group contained more younger and fewer older men than expected.14 Our data accord with national figures for higher consultation rates for women and with statistics for the proportions of people from ethnic and sexual minorities in London.14-16 A further limitation was that only a third of practices approached eventually participated and a quarter of patients participating did not allow us access to their practice records.
Comparison with data in other settings
We expected that general practice attenders might have higher rates of problems than people participating in population surveys. However, our prevalence rates for erectile and ejaculatory dysfunction were lower than those in recent reports,13,17,18 possibly because we applied conservative diagnostic criteria that are more relevant to clinical practice. In addition, interpreting the results of epidemiological studies funded by the pharmaceutical industry needs caution.17-19 Much less is known about sexual difficulties in women, and criticism has recently been expressed about the involvement of the pharmaceutical industry in “building the science of female sexual dysfunction.”20 Although the results of a British population study of women accord with our findings,21 a woman centred definition of sexual problems has recently been preferred to concepts of sickness and health.19,20 The word dysfunction implies a state of “disease” that needs rectification. Our data indicate, however, that sexual dysfunction cannot be considered as one generic problem. Dyspareunia, vaginismus, reduced arousal, and aversion to sexual contact were uncommon problems and were associated with other psychological and physical difficulties. Women with these ICD-10 diagnoses were also much more likely to have consulted their general practitioners about sexual matters than women who received a single diagnosis of lack or loss of sexual desire. This suggests that many people do not regard lack or loss of sexual desire as a serious difficulty. Setting aside this diagnosis reduces the prevalence of any sexual problem to 27% for women and 16% for men. Thus we need further evidence that the relatively common complaint of lack or loss of sexual desire is an obstacle to satisfactory sexual relations or that a medical solution is indicated; for many people, reduced sexual interest or response may be a normal adaptation to stress or an unsatisfactory relationship.
Implications for general practice
Although up to 30% of people reported seeking sexual advice from their doctor, only 3-4% had an entry relating to sexual difficulties in their practice records. Although we cannot be sure that the advice sought focused specifically on sexual dysfunction, these observations suggest that many people discuss sex with their doctors but the latter rarely record it. Doctors may be reluctant to record sensitive material, and hence general practitioners' records do not accurately reflect the extent of their involvement in this area.
Women's high consultation rate, as well as their willingness to seek help for such problems, makes it possible for family doctors to become involved with these problems. However, general practitioners need to be alert to the possibility of a sexual problem and may need training on how to manage this at a primary care level.22
Our multivariate analysis took account of the types of information (demographic factors, practice records, and clinical history) available to general practitioners. Increasing age and being unemployed were predictors of an ICD-10 diagnosis in women. In men, bisexual orientation, being non-white, and unemployment were predictive. No practice records predictors existed in women, but in men a higher consultation rate was informative. Patient reported factors were predictive of an ICD-10 diagnosis, especially poor physical function and dissatisfaction with current sex life in both sexes and higher psychological morbidity in women.
What is already known on this topic
Little is known about the prevalence of sexual dysfunction in people attending their general practice and whether such problems are recognised by doctors
Controversy exists about defining sexual dysfunction in terms of health and disease
What this study adds
22% of men and 40% of women received at least one ICD-10 diagnosis of sexual dysfunction according to stringent clinical criteria
Older women with poorer physical and psychological function and who were dissatisfied with their sex life were more likely to have a ICD-10 diagnosis of sexual dysfunction, as were bisexual men
Unanswered questions and future research
Future research should focus on refining our understanding of sexual function in both sexes and, where problems need help, what sort of help might be most effective in general practice and the most appropriate training for general practitioners.22 Being bisexual was a particular risk factor for sexual difficulties in men when all other factors were considered. Although similar findings have been reported in men who report same sex behaviour,23 to our knowledge no other population study has focused specifically on sexual problems in bisexual as distinct from homosexual men.
Editorial by Ogden See also p 426
We thank Josephine Woolf for her collaboration in obtaining funding; Alice Gladwin, Monique Cloherty, and Üta Drescher for their assistance in collecting the data; and Bob Blizard for his statistical advice on the project.
Contributors: MK and IN had the idea, obtained funding for the study, analysed the data, and wrote the paper. PB managed the collection and entry of the data and contributed to the final version of the manuscript. MK and IN are guarantors for the study.
Funding: health service research project grant provided by the Wellcome Trust (reference 991026); the North and Central Thames Research Network (NoCTeN) provided service support costs involved with the recruitment at the general practices.
Competing interests: None declared.
Ethical approval: Two London local research ethical committees approved the study.
References
- 1.Simons JS, Carey MP. Prevalence of sexual dysfunctions: results from a decade of research. Arch Sex Behav 2001;30: 177-219. [DOI] [PMC free article] [PubMed] [Google Scholar]
- 2.Dunn KM, Crift PR, Hackett GI. Sexual problems: a study of the prevalence and need for health care in the general population. Fam Pract 1998:15: 519-24. [DOI] [PubMed] [Google Scholar]
- 3.Reynolds CF, Frank E, Thase ME, Houck PR, Jennings JR, Howell JR, et al. Assessment of sexual function in depressed, impotent, and healthy men: factor analysis of a brief sexual function questionnaire for men. Psychiatry Res 1987;24: 231-50. [DOI] [PubMed] [Google Scholar]
- 4.Daker-White G. Reliable and valid self-report outcome measures in sexual dysfunction: a systematic review. Arch Sex Behav 2002;31: 197-209. [DOI] [PubMed] [Google Scholar]
- 5.Taylor JF, Rosen RC, Leiblum SR. Self report assessment of female sexual function. Arch Sex Behav 1994;23: 627-43. [DOI] [PubMed] [Google Scholar]
- 6.Kinsey AC, Pomeroy WB, Martin CE. Sexual behaviour in the human male. Philadelphia, PA: Saunders, 1948.
- 7.World Health Organization. International statistical classification of disease and related health problems, 10th revision. Geneva: WHO, 1992.
- 8.Ware JE, Kosinski M, Keller SD. A 12-item short-form health survey construction of scales and preliminary tests of reliability and validity. Med Care 1996;34: 220-33. [DOI] [PubMed] [Google Scholar]
- 9.Goldberg D, Williams D. A user's guide to the general health questionnaire. Windsor: NFER-Nelson, 1988.
- 10.Ewing JA. Detecting alcoholism: the CAGE questionnaire. JAMA 1984;252: 1905-7. [DOI] [PubMed] [Google Scholar]
- 11.Finkelhor D. Child sexual abuse. In: Rosenberg ML, Fenley MA, eds. Violence in America—a public health approach. New York: Oxford University Press, 1991: 79-94.
- 12.Crenshaw TL, Goldberg JP. Sexual pharmacology—drugs that affect sexual function. New York: Norton, 1996.
- 13.Laumann EO, Paik A, Rosen R. Sexual dysfunction in the United States: prevalence and indicators. JAMA 1999;281: 537-44. [DOI] [PubMed] [Google Scholar]
- 14.McCormick A, Fleming D, Charlton J. Morbidity statistics from general practice—fourth national morbidity study 1991-1992. London: OPCS, HMSO, 1995.
- 15.Peach C. Ethnicity in the 1991 census—the ethnic minority populations of Great Britain. Volume 2. London, Stationery Office, 1998: 206-21. [Google Scholar]
- 16.Johnson AM, Mercer CH, Erens B, Copas AJ, McManus S, Wellings K, et al. Sexual behaviour in Britain: partnerships, practices and HIV risk behaviours. Lancet 2001;358: 1835-42. [DOI] [PubMed] [Google Scholar]
- 17.Akkus E, Kadioglu A, Esen A, Doran S, Ergen A, Anafarta K, et al. Prevalence and correlates of erectile dysfunction in Turkey: a population based study. Eur Urol 2002;41: 298-304. [DOI] [PubMed] [Google Scholar]
- 18.Mirone V, Imbimbo C, Bortolotti A, Di Cintio E, Colli E, Landoni M, et al. Cigarette smoking as a risk factor for erectile dysfunction: results from an Italian epidemiological study. Eur Urol 2002;41: 294-7. [DOI] [PubMed] [Google Scholar]
- 19.Tiefer L. Sexology and the pharmaceutical industry: the threat of co-optation. J Sex Res 2000;37: 273-83. [Google Scholar]
- 20.Moynihan R. The making of a disease: female sexual dysfunction. BMJ 2003;236: 45-7. [DOI] [PMC free article] [PubMed] [Google Scholar]
- 21.Mercer CH, Fenton KA, Johnson AM, Wellings K, Macdowell W, McManus S, et al. Self reported sexual function problems and help seeking behaviour: results from a British probability sample survey. BMJ 2003. (in press). [DOI] [PMC free article] [PubMed]
- 22.Humphery S, Nazareth I. GPs' views on their management of sexual dysfunction. Fam Pract 2001;18: 516-8. [DOI] [PubMed] [Google Scholar]
- 23.Moreira ED, Najjar Abdo CH, Barreto Torres E, Lisboa Lobo CF, Saraiva Fittipaldi JA. Prevalence and correlates of erectile dysfunction: results of the Brazilian study of sexual behaviour. Urology 2001:58: 583-8. [DOI] [PubMed] [Google Scholar]