

Abstract
The medial olivocochlear (MOC) reflex arc is probably a three-neuron pathway consisting of type I spiral ganglion neurons, reflex interneurons in the cochlear nucleus, and MOC neurons that project to the outer hair cells of the cochlea. We investigated the identity of MOC reflex interneurons in the cochlear nucleus by assaying their regional distribution using focal injections of kainic acid. Our reflex metric was the amount of change in the distortion product otoacoustic emission (at 2f1–f2) just after onset of the primary tones. This metric for MOC reflex strength has been shown to depend on an intact reflex pathway. Lesions involving the posteroventral cochlear nucleus (PVCN), but not the other subdivisions, produced long-term decreases in MOC reflex strength. The degree of cell loss within the dorsal part of the PVCN was a predictor of whether the lesion affected MOC reflex strength. We suggest that multipolar cells within the PVCN have the distribution and response characteristics appropriate to be the MOC reflex interneurons.
Keywords: hearing, outer hair cell, otoacoustic emission, superior olive
The auditory system contains several descending pathways (Spangler and Warr, 1991), of which the best-studied is the olivocochlear (OC) efferents. OC neurons reside in the superior olivary complex and project to the cochlea (Fig. 1). The OC system is divided into two sub-systems (reviewed by Warr, 1992; Guinan, 1996). Medial olivocochlear (MOC) neurons have cell bodies in the medial part of the superior olivary complex and project to outer hair cells. Lateral olivocochlear (LOC) neurons have cell bodies in or around the lateral superior olive and project to afferent fibers near inner hair cells (Warr and Guinan, 1979; Liberman, 1980; Liberman and Brown, 1986; Brown, 1987; Vetter and Mugnaini, 1992; Maison et al., 2003). Cholinergic MOC endings in the cochlea exert their effects by means of a nicotinic receptor (Vetter et al., 1999; Elgoyhen et al., 2001, 2003) that influences outer hair cell function and alters cochlear responses (Wiederhold and Kiang, 1970; Mountain, 1980; Siegel and Kim, 1982; Brown and Nuttall, 1984). For instance, activation of MOC neurons alters distortion product otoacoustic emissions (DPOAEs), causing rapid amplitude changes in the first several hundred milliseconds after primary-tone onset (Liberman et al., 1996; Kujawa and Liberman, 2001). The functional role of this sound-evoked feedback system may include adjusting cochlear gain, reducing effects of masking noise, and protecting the ear from acoustic injury (Wiederhold and Kiang, 1970; Geisler, 1974; Winslow and Sachs, 1987; Kawase and Liberman, 1993; Rajan, 1995; Reiter and Liberman, 1995; Guinan and Stankovic, 1996).
Fig. 1.
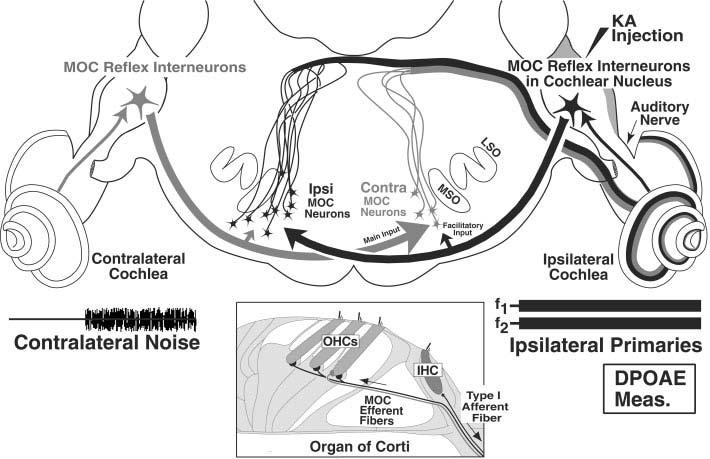
Schematic of medial olivocochlear (MOC) reflex pathways that can affect cochlear responses from the ipsilateral (right) ear. The Ipsi reflex (black lines, arrows, and cells) starts with sound-evoked activity in the auditory nerve, continues with projections from the cochlear nucleus (CN) to “Ipsi” MOC neurons, which then project back across the midline to the ipsilateral cochlea. The Contra reflex (gray line, arrows and cells) begins with the contralateral auditory nerve, and continues as CN projections across the midline to “Contra” MOC neurons. In addition to these dominant inputs from the CN on the opposite side of the brain, MOC neurons receive smaller inputs assumed to be from the CN on the same side of the brain (small arrows), which are postulated to explain the phenomenon of binaural facilitation. KA, kainic acid; DPOAE, distortion product otoacoustic emissions; LSO, lateral superior olive; MSO, medial superior olive. See text for further details.
In response to sound, single MOC neurons are highly frequency selective and adapt very little (Fex, 1962, 1965; Cody and Johnstone, 1982; Robertson and Gummer, 1985; Liberman and Brown, 1986; Gummer et al., 1988; Liberman, 1988; Brown, 1989, 2001; Brown et al., 1998a,b). Of the roughly 1,500 MOC neurons projecting to each cochlea, most are monaural, i.e., excited by sound in only one (dominant) ear and unaffected by sound in the other (opposite) ear. Of these monaural neurons, approximately two thirds are excited by ipsilateral sound (Ipsi neurons) and one third are excited by contralateral sound (Contra neurons). A small percentage of MOC neurons are excited by sound in either ear (Binaural neurons). However, both Ipsi and Contra neurons show binaural facilitation: i.e., sound in the opposite ear will increase the response to dominant-ear stimulation.
The central pathways mediating the MOC reflex are only partially characterized. There are two MOC reflexes to each cochlea. Defining the reflexes that act on a single cochlea (the “ipsilateral” cochlea on the right side of Fig. 1), the Ipsi reflex is driven by the ipsilateral ear and the Contra reflex is driven by the contralateral ear. The Ipsi reflex pathway (Fig. 1, black arrows) begins with auditory nerve projections to the ipsilateral cochlear nucleus (CN; Fekete et al., 1984) and ends with projections from MOC cells in the contralateral superior olivary complex that cross the midline to reach ipsilateral outer hair cells. The interneurons connecting these afferent and efferent limbs are incompletely characterized, although direct projections from the CN to terminals on or near MOC somata have been demonstrated (Warr, 1969; Robertson and Winter, 1988; Thompson and Thompson, 1991; Ye et al., 2000). For the Contra MOC reflex pathway (Fig. 1, gray arrows), unidentified reflex interneurons in the contralateral CN project across the midline to MOC neurons, which project to the ipsilateral cochlea. The phenomenon of binaural facilitation suggests that each Ipsi or Contra MOC neuron receives input from the CN on both sides: these facilitatory inputs from the opposite ear may be mediated by different neuronal circuits than those mediating the dominant-ear response (Fig. 1; Liberman, 1988; Brown et al., 1998a).
The CN contains many different types of neurons, each having a unique regional distribution across its three major subdivisions: anteroventral (AVCN), posteroventral (PVCN), and dorsal (DCN; Osen, 1969; Brawer et al., 1974; Hackney and Osen, 1985; Hackney and Pick, 1986). DCN neurons project mainly to the inferior colliculus (Osen, 1972; Adams, 1979; Ryugo and Willard, 1985), thus they are unlikely to play a major role in dominant-ear responses of MOC neurons. In contrast, projections from PVCN to MOC neurons have been suggested by fiber degeneration studies (Warr, 1969) and further clarified by tracer experiments (Thompson and Thompson, 1991). Other tracer studies have shown that neurons in the AVCN marginal shell also project to MOC neurons (Ye et al., 2000). Physiological studies are necessary to determine the respective roles of these different pathways in the MOC reflex circuitry and to determine whether other CN areas may also be involved.
In the present study, MOC reflex circuitry is studied by assessing the effects on MOC reflex strength of focal lesions in different parts of the CN. Kainic acid (KA) is used to destroy cell bodies while sparing fibers of passage (Bird et al., 1978; Coyle et al., 1978; Wuerthele et al., 1978), i.e., both auditory-nerve fibers projecting to the CN and MOC fibers passing ventral to the CN and sending collaterals into it. Our results demonstrate that the CN cells mediating the MOC response to sound are located in PVCN. This finding, coupled with other physiological data, suggest which CN neuronal types are involved. A preliminary version of this work has been presented (de Venecia et al., 2001).
MATERIALS AND METHODS
All procedures were conducted in accordance with guidelines of the National Institute of Health and were approved by the Animal Care and Use Committee of the Massachusetts Eye and Ear Infirmary. Experiments were conducted within a sound-shielded chamber (Ver et al., 1975). A total of 30 guinea pigs (weight 286–524 g) were used: 29 guinea pigs for injections of KA and 1 guinea pig for a surgical cut of the dorsal and intermediate acoustic striae. The guinea pigs were anesthetized with urethane (0.9 g/kg, i.p.) followed 15 minutes later by fentanyl (0.15 mg/kg, i.m.). Booster injections of fentanyl (one third initial dose) were given approximately every 2 hours to maintain anesthesia. Rectal temperature was controlled to 37°C by heating the air in the chamber and by a heating pad. After tracheotomy, each pinna was removed and small ventilation holes were made in the bullae. The right cochlear nucleus was exposed by a posterior craniotomy and partial aspiration of the overlying cerebellum.
DPOAEs at frequency 2f1–f2 were measured with an Etymotic Research (ER) 10C acoustic system placed in the right ear canal. Two primary tones (f2 = 10 or 12 kHz, with f2/f1 = 1.2) were generated digitally (20-μsec sampling) using a D-A board (AO-6; National Instruments) in a computer operating under LabVIEW control. Total duration of the primary tones was 1 second, and for the second half of this interval a contralateral broad-band noise (approximately 70 dB sound pressure level [SPL], 500-msec duration) was presented by means of a contralaterally placed ER 10C system. There was a 3.5 second silent interval between stimulus presentations. Sound pressure was measured with the low-noise microphone in the ER10C probe. The microphone was calibrated in a coupler with a condenser microphone (Bruel and Kjaer, 0.25 inch). The microphone output was amplified and digitized by an A-D board (A-2000; National Instruments). The digitized microphone output was broken into contiguous samples of 10.24 msec. For each sample, a fast Fourier transform was computed and the amplitude at 2f1–f2 was extracted and plotted vs. post-onset time (e.g., Fig. 2). Samples were fit with smoothed curves (Stineman, 1980) for display purposes.
Fig. 2.
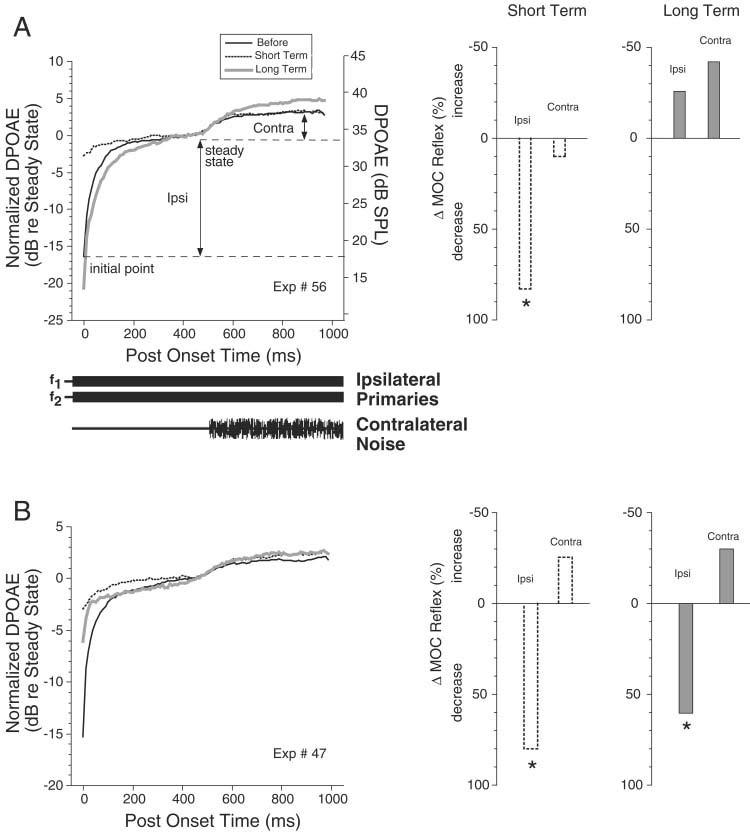
A,B: Illustration of the distortion product otoacoustic emissions (DPOAEs) -based metric used to assess medial olivocochlear (MOC) reflex strength and the changes seen after kainic acid (KA) injection in two cases. Left: The amplitude of the DPOAE vs. post-onset time for the primary tones. The onset timing and duration for ipsilateral primaries and contralateral noise are schematized below A; they apply to B as well. In both cases, several response traces are superimposed (see key in A). DPOAE amplitude is expressed both in normalized terms (left vertical axis) with respect to the steady-state value achieved before contralateral-noise onset, and in absolute dB sound pressure level (SPL, right vertical axis) for the DPOAE before the injection. The magnitude of Ipsi and Contra preinjection reflex metrics (i.e., the changes in the preinjection DPOAE) are indicated by the double-headed arrows in A. The traces shown in each case are for the primary level combinations resulting in the largest DPOAE changes (A: f2 = 10 kHz; before and short-term, L1 = 77 dB, L2 = 65 dB; long-term, L1 = 78 dB, L2 = 67 dB; B: f2=12 kHz; before, L1 = 80 dB, L2 = 73 dB, short-term, L1 = 80 dB, L2 = 72 dB; long-term, L1 = 82 dB, L2 = 74 dB). Right: Bar graphs show percentage changes in MOC reflex strength for the traces shown in A and B. Stars indicate significant changes, i.e., changes larger than the test–retest variability as described in the text.
DPOAEs were measured over a matrix of 84, or more, combinations of primary-tone levels. Primary levels were varied in 1-dB steps. L1 (the level of the f1 primary tone) was varied over six or more steps within the range 74 to 84 dB SPL. At each L1 step, there were 14 or more L2 steps that began at 60 dB and increased to L1 (with L1 ≤ L2). Responses to two to four complete sets (or matrices) of all primary level combinations (Kujawa and Liberman, 2001; Boyev et al., 2002) were obtained at the beginning of the experiment before injection of KA. From each response matrix, the largest DPOAE change in amplitude (Fig. 2) was chosen and averaged with the largest change from the other response matrices to form the preinjection “MOC reflex strength”. In some experiments, opposite-ear response matrices were obtained by reversing the ears that received the primary tones and the noise bursts (DPOAE measured in the left ear and noise presented to the right [injected side] ear). Test/retest measurements of matrix responses were obtained over 4-hour periods in each of three animals in which the posterior skull was opened, but an injection pipette was not inserted. In all experiments, DPOAE measurements were made for up to 20 minutes after injection pipette placement in the cochlear nucleus, before KA injection, to ensure no change in response strengths as the result of pipette placement alone. Auditory brainstem responses (ABRs) were measured differentially from a vertex electrode screwed into the skull relative to a needle electrode just ventral to the external auditory meatus. Responses to 200 clicks of alternating polarity were amplified 10,000× and averaged. ABR peak amplitudes were measured from baseline to peak for wave P1, or previous trough to peak for peaks P2–P5.
Kainic acid (5 mM in phosphate-buffered saline pH 7.0) was delivered with a micropipette (tip diameter approximately 20 μm) attached to a 5-μl syringe mounted on a micromanipulator. The tip was aimed into the cochlear nucleus by visual guidance and the micromanipulator scale was used to determine the depth of penetration. Pressure injections of KA were made using a hydraulic master/slave remote injection system. KA injections always caused spiking on the ABR recording electrodes and sometimes caused seizures. To avoid seizures and restrict the extent of the lesions, the injections were made in small increments (usually 0.1 μl over a period of 10–115 minutes for a total injection of 0.3–0.6 μl). After the injection, ipsilateral DPOAE response matrices were taken semi-continuously, with opposite-ear response matrices obtained less frequently. Ipsilateral ABR measurements were made at approximately 1 hour intervals. Postinjection survival times are given from the middle of the injection period and were at least 8 hours to allow for development and stabilization of neuronal damage at the injection site (Bird et al., 1978; Melcher et al., 1996a,b).
At the conclusion of the experiment, animals were perfused intravascularly with 4% paraformaldehyde in phosphate-buffered saline. Serial frozen sections were cut (40 μm) in the transverse plane on a freezing microtome. The sections were mounted on gelatinized slides and counterstained with methylene blue for examination in the light microscope. The lesion extent was assessed relative to the cytoarchitectonically defined subdivisions (AVCN, PVCN, and DCN) as described in previous work in the guinea pig (Hackney and Osen, 1985; Hackney et al., 1990), with boundaries verified by comparison with the unlesioned CN. Camera lucida drawings (e.g., Figs. 5, 6, 7) were made at 40× total magnification to document the lesion area in individual sections. Lesion sites were defined as the regions with almost-complete absence of neurons and the presence of cell fragments, areas that could be clearly delineated. Anatomical boundaries within lesioned areas were determined using the opposite (unlesioned) side as a reference. The lesion areas were surrounded by a highly variable “halo” in which there was abnormally low cell density and abnormal neuronal morphology (e.g., pyknotic nuclei) (Bird et al., 1978; Melcher et al., 1996a,b). Digital grayscale photomicrograph images were acquired by using Metamorph Image (Universal Imaging Corp.) software. The software controlled a Hamamatsu CCD digital camera mounted on a Nikon Eclipse compound microscope with a 4× plan apo objective without optical filters. For Figure 4, images were imported into Adobe Photoshop and the standard auto contrast function was used to enhance the quality of each image. For comparison purposes, lesions were plotted on an atlas (Figs. 8, 9) with nuclear boundaries on template sections drawn from a representative cochlear nucleus. Counts of the number of neurons in the PVCN were made at 100× total magnification. Separate counts were made for dorsal and ventral halves of the PVCN (halves defined by a line connecting the dorsoventral midpoints measured along the medial and lateral borders of the PVCN, as schematized in Fig. 10, insets). All neurons that contained a nucleolus in the core and cap areas of PVCN were counted, but neurons within the overlying granule-cell areas (Mugnaini et al., 1980) were not counted.
Fig. 5.
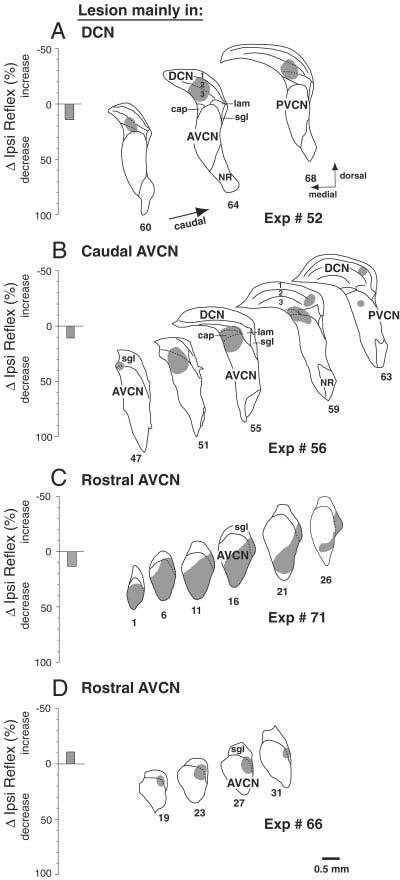
Data from four reflex-sparing lesions. Left: Bars show the long-term changes in Ipsi reflex strength on the injected side. Right: Camera-lucida drawings of lesion-containing sections indicate the regions of almost-complete cell loss from the kainic acid (KA) injection. A–D: Histology shown for every fourth (B,D), fifth (C), or sixth (A) section, with more caudal sections toward the right. Within-lesion subdivision boundaries not obvious because of missing neurons are drawn with dashed lines using analogous sections from the opposite side in the same animal. cap, small cell cap; AVCN, anteroventral cochlear nucleus; DCN, dorsal cochlear nucleus; PVCN, posteroventral cochlear nucleus; NR, nerve root of auditory nerve; lam, lamina of granule cells; sgl, superficial granular layer.
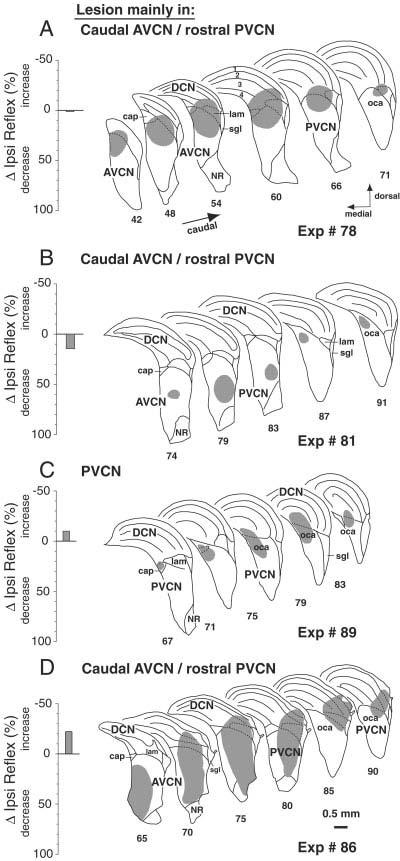
Fig. 6.
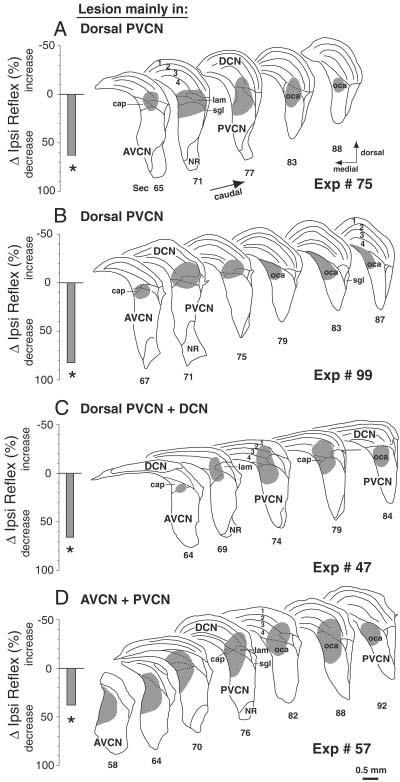
A–D: Data from four reflex-interrupting lesions, all of which involved the PVCN. There was minor involvement of the DCN in one case (C) and more substantial involvement of the AVCN in another case (D). Format and abbreviations are as for Figure 5. oca, octopus cell area.
Fig. 7.
Data from four PVCN lesions that spared the reflex. Format and abbreviations are as for Figure 5.
Fig. 4.
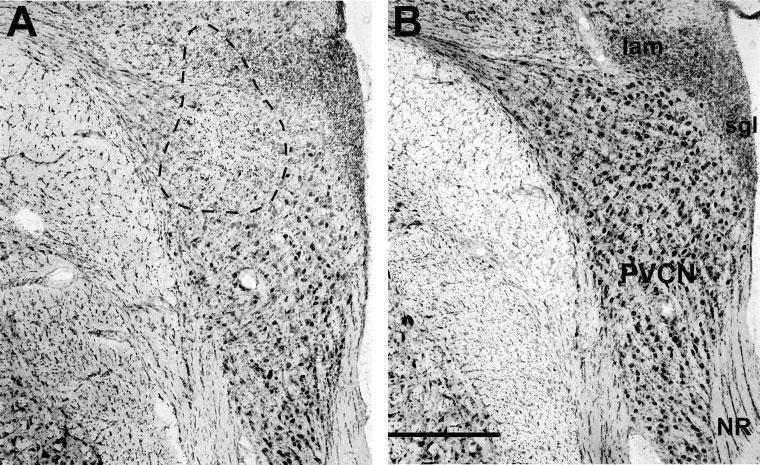
A,B: Photomicrographs of rostral posteroventral cochlear nucleus (PVCN) from the lesioned side (A) and control side (B) of Experiment 75. In A, the area of nearly complete cell loss is indicated by a dashed line. The lesion section is from slide 82: schematics of the full lesion in this case are shown in Figure 6A. NR, nerve root of auditory nerve; lam, lamina of granule cells; sgl, superficial granular layer. Scale bar = 0.5 mm in B (applies to A,B).
Fig. 8.
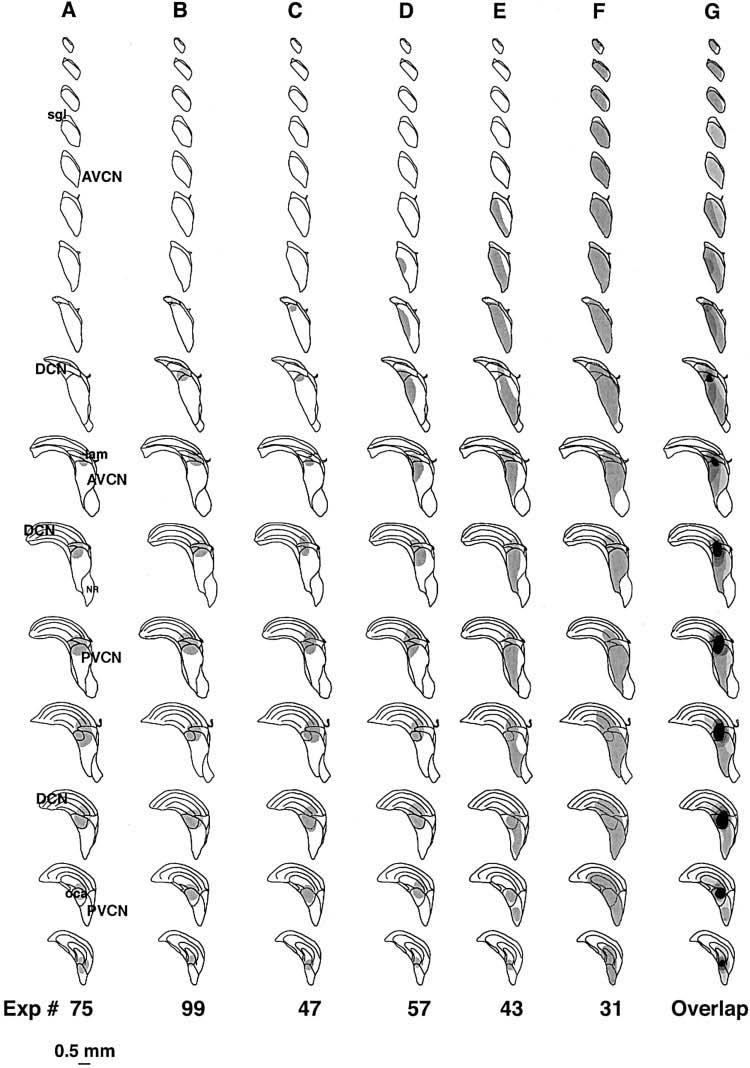
A–G: The six reflex-interrupting cases plotted on an atlas constructed from a template cochlear nucleus. Column G shows overlap of all the cases with areas of cell loss common to all six cases indicated in black. The first four cases are also illustrated in Figure 6. For abbreviations, see Figure 5.
Fig. 9.
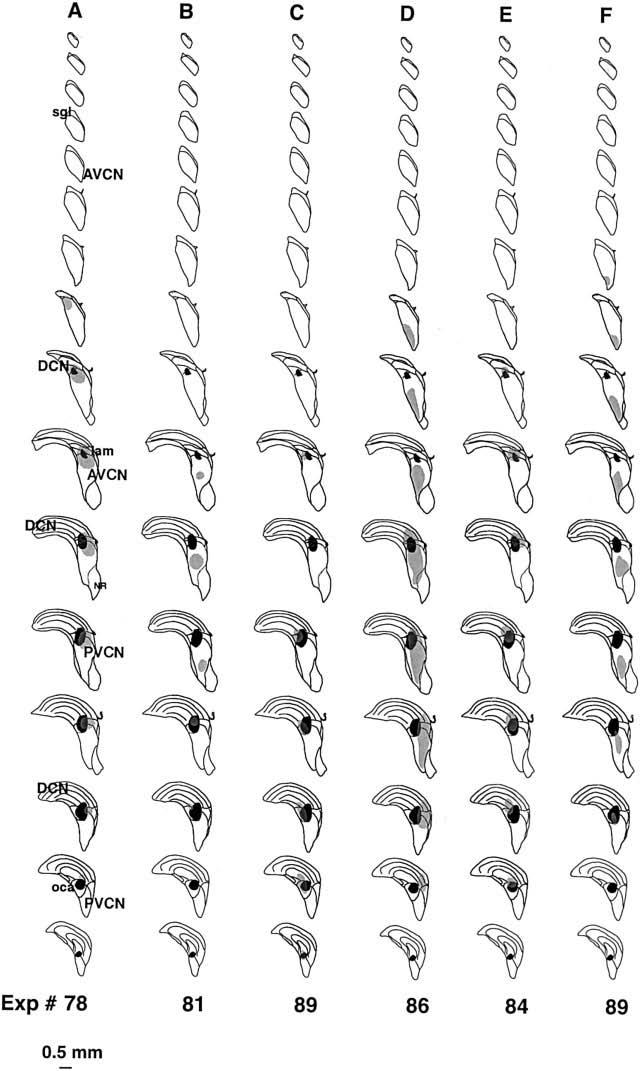
A–F: Six reflex-sparing cases plotted on the same atlas as Figure 8. These six cases were chosen because they were the largest PVCN lesions that spared the reflex. There was no area of cell loss common to all of these cases. Black areas show the areas of overlap of the six reflex-interrupting cases from Figure 8. The first four cases are illustrated in Figure 7 For abbreviations, see Figure 5.
Fig. 10.
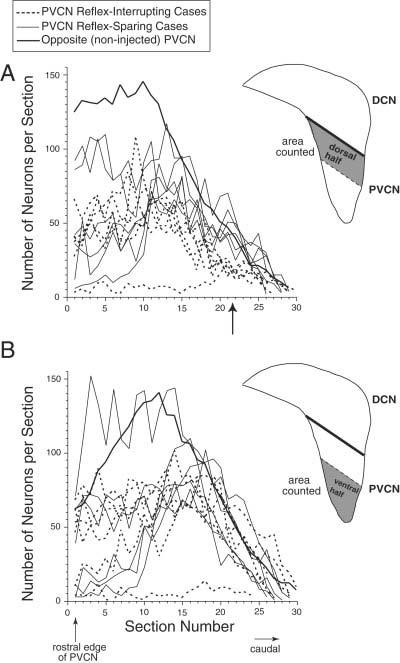
Neuron counts for posteroventral cochlear nucleus (PVCN) lesions that either interrupted (dashed lines) or spared (thin solid lines) the medial olivocochlear reflex. Included are the six cases shown in Figure 8 and the six cases shown in Figure 9. A,B: Remaining neurons were counted in the dorsal half (A) or the ventral half (B) of the PVCN. Arrow points to the region with the largest difference in neuron counts between reflex interrupting and reflex sparing cases. Average counts from the opposite (noninjected) sides are shown as a thick solid line. Number of neurons is plotted as a function of section number, beginning with the most rostral section of PVCN (section 1) and proceeding caudally. The reflex-interrupting case with almost complete cell loss is Exp. 31. DCN, dorsal cochlear nucleus.
To explore the path taken by the axons of the reflex interneurons, in one guinea pig the dorsal acoustic stria and intermediate stria (two of the output pathways of the cochlear nucleus) were cut using a scalpel. Transection was confirmed by postexperiment histology. No KA was injected in this experiment.
RESULTS
DPOAE post-onset effects as a MOC reflex metric
In the first several hundred msec after the onset of ipsilateral primary tones, the distortion product otoacoustic emission (DPOAE) at 2f1–f2 undergoes an amplitude change that has been called “post-onset adaptation” (e.g., Fig. 2A,B, left; Liberman et al., 1996; Sun and Kim, 1999; Kujawa and Liberman, 2001). This effect is mediated by primary-tone activation of the Ipsi MOC reflex: it is virtually eliminated by sectioning the OC bundle (Liberman et al., 1996; Kujawa and Liberman, 2001). As described by Kujawa and Liberman (2001), we measured DPOAE amplitude changes at a matrix of primary levels and used the largest value as our metric of Ipsi MOC reflex strength. This change is typically positive and can be over 20 dB. For each primary-level combination, amplitude change is defined as the difference between the initial value and the average steady state value (i.e., 450–500 msec; see Fig. 2A,B, left). Contra reflex strength was measured by presenting a contralateral noise 500 msec after primary onset (Fig. 2A,B, left) and measuring the further change in DPOAE (i.e., average value at 950–1,000 msec minus the average value at 450–500 msec). Test/retest measurements (see Materials and Methods section) suggested that the Ipsi reflex metric varied as much as 29% and the smaller Contra metric varied as much as 45%. Changes in metrics greater than these values will be thus be considered significant.
The large amplitudes of the DPOAE changes we observed indicate that the combination of urethane/fentanyl anesthesia produced preinjection reflex strengths approximately as large as those seen in awake animals (Boyev et al., 2002), thus this anesthetic regimen apparently does not significantly diminish the MOC reflex.
Effects of KA injections on MOC reflexes
In 29 guinea pigs, KA was injected into the CN. In 24 of these, there was an observable lesion upon histological examination. In five other cases, no lesion was clearly discernible, and these cases will not be considered further.
Within minutes of an injection, KA caused large decreases in Ipsi MOC reflex strength on the injected side. Over subsequent hours, reflex strength returned in some cases and not in others. Presumably, decreases in reflex strength are due to injection-induced damage of MOC-reflex interneurons in the CN. For the example in Figure 2A, a preinjection Ipsi reflex strength of 16.4 dB was reduced to 2.8 dB shortly after the injection, a decrease of 83%. It recovered to 20.7 dB at 8 hours postinjection (which is within the test/retest measurement variability described above). Figure 2B shows a case in which the injected-side Ipsi reflex strength did not recover, suggesting a permanent reduction.
Postinjection alterations in the DPOAEs included a large increase in DPOAE initial amplitude and a small decrease in the steady state (Fig. 2), as previously observed (Kujawa and Liberman, 2001). Across all 24 cases, initial DPOAE amplitudes increased immediately after injection by an average of 8.2 dB, whereas the steady-state amplitude decreased by an average of 2.5 dB. Because MOC effects have an onset time constant of ∼100 msec (Wiederhold and Kiang, 1970; Cooper and Guinan, 2003), the change in initial DPOAE amplitude may be due to elimination of background (spontaneous) MOC activity, whereas the changes in steady state amplitude are due to loss of sound-evoked MOC activity.
The short-term reductions in reflex strength seen within 2 hours after KA injection are plotted for all 24 injections in the middle column of Figure 3. For the Ipsi reflex on the KA-injected side (Fig. 3B), all cases had large reductions (average, 74%; range, 25 to 97%) that were above test/retest variability, except for one (Exp. 44) in which only 0.3 μl of KA was injected. In contrast, the Contra reflex on the injected side (Fig. 3E) was unaffected by KA injection (average, 1% increase; range, 32% increase to 45% decrease), presumably because it is driven by the reflex pathway through the intact (opposite) CN (Fig. 3D). This striking difference illustrates the independence of the Ipsi and Contra reflexes shown in Figure 3A,D. Furthermore, the results show that KA does not affect the axons of Contra MOC neurons, which course under the CN and send collaterals into the CN (Brown et al., 1991), even when the injections were large enough to almost abolish the Ipsi reflex on the injected side.
Fig. 3.
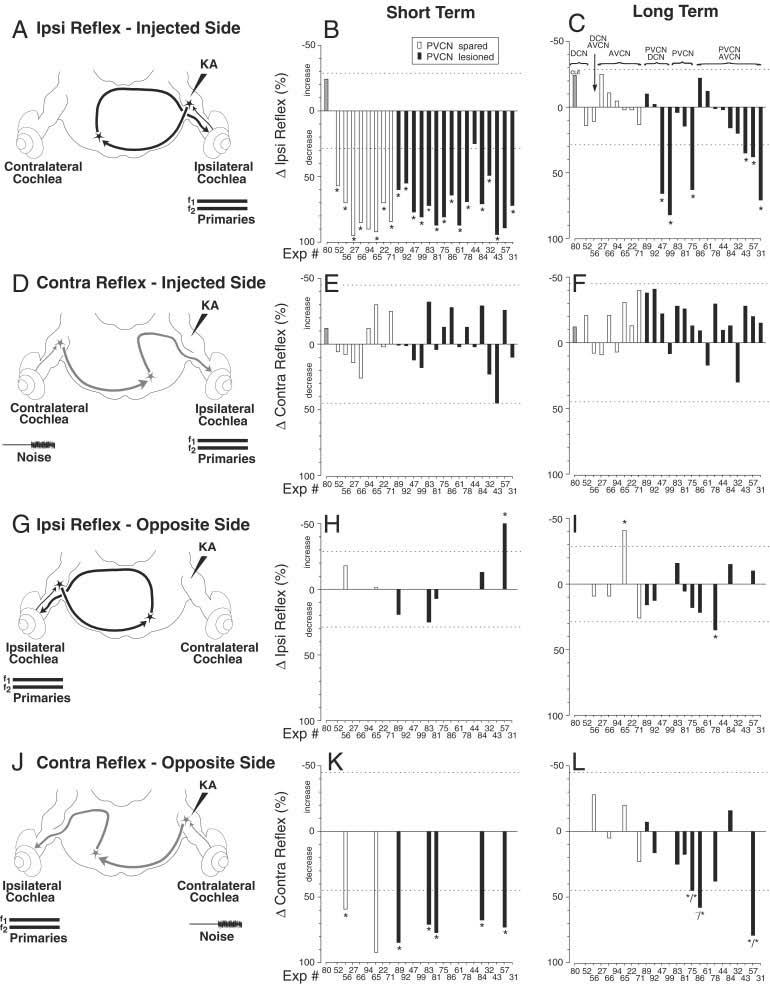
Summary of effects of kainic acid (KA) lesions. A,D,G,J: The four test conditions are schematized (also see Fig. 1 and text for explanation). B,C,E,F,H,I,K,L: Each set of bar graphs from middle (B,E,H,K) and right (C,F,I,l) columns illustrates data for the test condition schematized at the left. Bar graphs show average percentage changes in reflex strength after KA injection in the short-term (< 2 hours; middle column) and in the long-term (> 6 hours; right column). In each panel, each bar shows the result from one animal, averaged from two to four traces such as those of Figure 2. Individual experiment numbers are listed along the X-axis in each panel. The experiment numbers are arranged, in all panels, according to lesion locus, as described in the key above C. Filled and unfilled bars indicate whether the lesion involved or spared the posteroventral cochlear nucleus (PVCN), respectively (see key in B). Gray bar indicates surgical cut of the dorsal and intermediate acoustic striae. AVCN, anteroventral cochlear nucleus; DCN, dorsal cochlear nucleus.
In the majority of cases, reflex strength recovered within hours of the KA injection (Fig. 2A). The long-term reductions in reflex strength are shown for all cases in the right column of Figure 3. For the Ipsi reflex on the injected side (Fig. 3C), 18 of 24 cases demonstrated recovery (average long-lasting decrease 1%, range 25% increase to 20% decrease). Such cases will be termed “reflex sparing”. The time required for recovery averaged 5 h. 22 min (range, 1 hour 34 minutes to 9 hours 35 minutes). During this recovery, it was not uncommon for the L1, L2 level combination eliciting the largest DPOAE change to shift several decibels from preinjection values. The shifts were gradual and did not appear to be associated with the injection, nor was there usually a shift back to preinjection values as the reflex strength recovered. Shifts occurred in preparations with and without full recovery.
Importantly, there were six cases (stars in Fig. 3C) in which Ipsi reflex strength on the injected side did not recover completely. One example is shown in Figure 2B. Presumably, in such cases, KA lesioned the reflex interneurons in the CN (Fig. 3A). These lesion cases were followed up to 10 hours 15 minutes after KA injection, yet the decreases in reflex strength remained large. We define such cases as “reflex interrupting”. The average long-term decrease in these six cases was 59.2% (range, 35% to 82%).
KA effects on “opposite side” MOC reflexes
In many experiments, “opposite side” data were obtained by reversing the sound stimulation (Fig. 3G,J): i.e., primary tones were presented to the ear opposite the injection, and noise was presented to the ear on the injected side. Long-term opposite-side measurements were made in 13 experiments after KA injections (Fig. 3I,L). In seven of these, data were also obtained shortly after KA injection (Fig. 3H,K). The opposite-side data address the question of whether interneurons driving the Ipsi and Contra reflexes are in the same location in their respective CNs. In three cases, there were significant long-lasting reductions in the Contra reflex strength on the opposite side (asterisks in Fig. 3L). Two of these had corresponding long-term decreases in the Ipsi reflex on the injected side (Fig. 3C: Exp 75 and 57, tagged by */*), indicating that neurons driving Ipsi and Contra reflexes were damaged by the same injection and thus are located nearby in the CN. In contrast, the other case with a decrease in the opposite-side Contra reflex (Fig. 3L, Exp 86) did not have a corresponding long-term Ipsi reflex change on the injected side (Fig. 3C), suggesting that interneurons of the two reflexes do not have identical distributions.
Correlation of lesion locations with MOC reflex changes
KA injections resulted in well-defined regions of nearly complete cell loss surrounded by poorly defined regions of partial loss. Figure 4 compares photomicrographs of a lesion (Fig. 4A) with the same CN region on the uninjected side (Fig. 4B), which shows a normal population of globular bushy cells and multipolar cells. In this, and most other cases, the region of near-total cell loss (circled on figure) contained only cell fragments and glia, whereas the surrounding halo of partial loss showed some normal appearing neurons and others with abnormal histologic features (e.g., pyknotic nuclei). KA-induced changes in reflex strength were correlated with the location and extent of the KA-induced lesions. For these correlations, we used long-term changes in Ipsi reflex on the injected side, because these were obtained just before tissue was harvested. For the correlations, we define the lesion as the region of near-complete cell loss, because boundaries of the partial-loss region were too poorly defined.
Animals with lesions confined to DCN and AVCN showed full recovery of MOC reflex strength (Fig. 3C, open bars). Lesions from four of these experiments are illustrated in Figure 5. Our data set included two DCN lesions. One was restricted to the DCN (Fig. 5A). The other (Fig. 3C, gray bar) cut the dorsal and intermediate acoustic striae, the output pathways of the DCN as well as of some PVCN neurons. Our data included six lesions confined to AVCN, and one lesion that spanned DCN and AVCN. Two of these lesions were mainly in caudal AVCN (e.g., Fig. 5B), and four were mainly in rostral AVCN (e.g., Fig. 5C,D). The latter had cell loss in the AVCN marginal region of small cells and the superficial granule layer, although only a portion of this extensive marginal area was lesioned in any single experiment.
All six lesions producing long-lasting decreases in Ipsi reflex strength on the injected side involved the PVCN. However, not all lesions involving the PVCN produced long-lasting reflex decreases (Fig. 3C, black bars). Data from PVCN lesions (both reflex interrupting and reflex sparing) will be presented by (1) consideration of individual cases, (2) superposition of cases on a CN atlas, and (3) cell counts in the PVCN.
Example cases of PVCN lesions
In the six cases with long-lasting decreases in the Ipsi reflex, the common area of cell loss was the dorsal and caudal PVCN: four cases are shown in Figure 6.
The lesion in Figure 6A was centered in dorsal PVCN, although there was some decrease in cell density in the ventral half. The lesion spanned the entire rostrocaudal extent, grazing the most posterior aspect of AVCN and the most ventral part of DCN. The granule cell lamina was disrupted, and there was some (but not complete) loss of small cells in the dorsal cap overlying the VCN. In the posterior PVCN, the octopus cell area was lesioned, but fiber tracts such as the auditory nerve or the intermediate acoustic stria appeared unaffected.
The lesion in Figure 6B was smaller, involved both PVCN and DCN, and was centered on the lamina separating these two subdivisions. There was slight involvement of posterior AVCN. The ventral two thirds of PVCN were spared, as were some of the more rostral parts of PVCN (e.g., minor involvement of sections 71–75 on Fig. 6B). The lesion encompassed a much larger area of the caudal PVCN, with near complete cell loss in the octopus cell area. There was also loss of the small cells in the dorsal cap of PVCN. In DCN, the lesion involved the most ventral parts and encroached on layer 2 that contains the fusiform cells.
The case in Figure 6C has a similar lesion to that in Figure 6B, but extended further into DCN. As in the previous case, this lesion spares the ventral two thirds of PVCN and primarily involves the dorsal and caudal PVCN (e.g., sections 74–84 on Fig. 6C). The octopus cell region was completely eliminated, as was the small cell cap. In DCN, the deep layers were lesioned in the lateral and ventral parts, with some involvement of the fusiform cells.
Figure 6D shows a larger lesion spanning AVCN and PVCN. In PVCN, the dorsal and medial corner are completely lesioned, with decreased cell density throughout PVCN. The other two lesions that caused long-term decrease in Ipsi reflex strength on the injected side were both from large injections that killed cells in nearly all of PVCN including the dorsal and caudal PVCN and the associated octopus cell area. Most of AVCN was also lesioned in these two cases (see Fig. 8, Exps 43 and 31).
There were 10 cases in which lesions involved the PVCN to some degree, but in which the Ipsi reflex strength was not significantly changed. Most of these lesions were small. Those that were moderate or large spared parts of the dorsal and caudal PVCN. Drawings of four of the reflex-sparing PVCN lesions are shown in Figure 7. The case in 7A shows a moderate-sized lesion of dorsal PVCN and posterior nerve root area of AVCN that spared most of the caudal PVCN. The other lesions also spared the dorsal part of the PVCN, especially caudally (Fig. 7B-D). The case illustrated in Figure 7C was perhaps most similar to the reflex-interrupting cases. However, the lesion was modest in size, encompassing only a portion of the dorsal PVCN, with large areas of dorsal PVCN spared rostrally and caudally. The case illustrated in Figure 7D was large, although in the caudal PVCN it spared the dorsomedial part. One reason to suggest that the lesions illustrated in Figure 7C,D were close to the reflex interneurons is their long time courses of reflex recovery (6–8 hours) given the modest amounts of KA that were injected.
Close examination of the PVCN lesions did not reveal any unique cell type or region for which survival or loss correlated well with lesion effects on reflex strength. Although the octopus-cell area seemed especially susceptible to KA and was affected in most PVCN lesions (Figs. 6, 7), its loss was not a good predictor of whether the lesion was reflex-sparing or reflex-interrupting. Likewise, presence or absence of cells at the marginal shell of PVCN (i.e., superficial granular layer, granule cell lamina, and cap regions) were not indicative of loss of the reflex.
Superposition of lesion locations onto an atlas
To summarize the data, the lesion-interrupting cases are plotted on a CN atlas in Figure 8. When data are combined in this way, the lesion area common to all six cases can be determined (solid black in right-most column). This key area is centered in the dorsal and caudal part of the PVCN. Rostrally, it extends into the caudal part of the AVCN. Caudally, it extends into the octopus cell area in the caudal PVCN.
The six largest reflex-sparing PVCN lesions are plotted on the CN atlas in Figure 9. Superposition of the atlas plots revealed no area of cell loss common to all of the reflex-sparing lesions. To better compare reflex-preserving and reflex-interrupting cases, the area of cell loss common to the reflex-interrupting cases is superimposed (in black) on each of the reflex sparing cases in Figure 9. Many of the reflex-sparing lesions partially overlap the black area, but none overlap it completely.
Cell counts in PVCN
To demonstrate more quantitatively the location(s) of cell loss best correlated with changes in Ipsi reflex strength, we counted surviving PVCN neurons in reflex-sparing vs. reflex-interrupting cases in the dorsal (Fig. 10A) or ventral (Fig. 10B) parts of the PVCN and plotted the data as a function of section number from rostral to caudal extremes of the PVCN. All but one case showed significant neuronal loss in rostral PVCN relative to control. However, only in the caudal half (sections 11–30) of the dorsal PVCN (Fig. 10A) were there systematically fewer cells in the reflex-interrupting cases (dotted lines) than in the reflex-sparing cases (solid lines). These sections contain the middle of the octopus-cell area and surrounding multipolar and small cells. Within the reflex-interrupting cases, there was some correlation between degree of cell loss and decrease in reflex strength. The two cases showing the smallest decreases in reflex strength (35 and 38%, Exps 43 and 57) had more remaining neurons than the four cases with larger decreases (63–82%, Exps 31, 47, 75, 99).
KA effects on MOC Reflex strength vs. effects on ABR
In previous studies, KA lesions have been used to identify the CN cells that contribute to the ABR peaks (Melcher and Kiang, 1996). In the present study, we found no correlation between changes in ABR waveform and changes in reflex strength. Most importantly, we saw numerous examples with long-lasting changes in ABR waves P2–P5, yet full recovery of MOC reflex: one such case is illustrated in Figure 11A. Reflex-interrupting lesions often showed decreases in peaks P2 to P4, and, less often, decreases in P5. For example, decreases in peak P2 ranging from 2% to 64% were observed in reflex-interrupting cases (Fig. 11B, stars). These decreases in P2 from PVCN lesions are consistent with the hypothesis that globular bushy cells, many of which are located in rostral PVCN in guinea pigs (Hackney et al., 1990), dominate the generation of peak P2 (Melcher and Kiang, 1996). Conversely, the vigorous MOC reflexes in cases where P2 was greatly decreased (Fig. 11B) show that the generators of peaks P2 (globular bushy cells) are not critical to the MOC reflex. Overall, the relative independence of ABR amplitudes and MOC reflex strength suggests that the neurons contributing to the ABR (globular bushy cells and AVCN spherical cells) do not contribute to the MOC reflex.
Fig. 11.
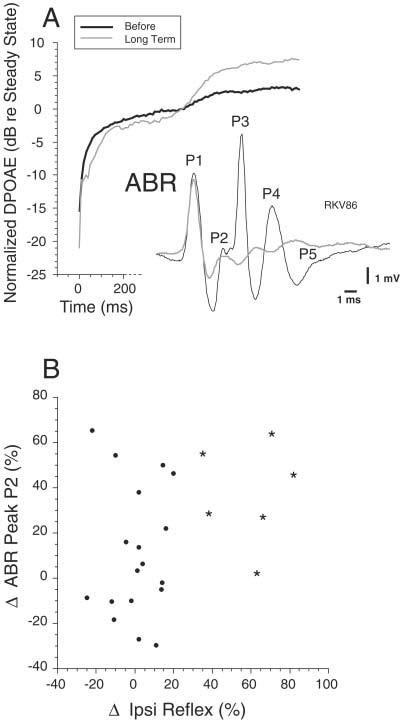
Comparison of the effects of kainic acid (KA) on medial olivocochlear (MOC) reflex strength and auditory brainstem response (ABR). A: Data from a large lesion in posterior anteroventral cochlear nucleus (AVCN)/anterior posteroventral cochlear nucleus (PVCN) that caused large long-term decreases in ABR peaks P2–P5 but that did not cause any long-term decrease in MOC reflex strength. Data were taken 10.5–12 hours after injection. B: Scatter plot of the change in ABR peak P2 and the change in MOC Ipsi reflex strength. Stars indicate data from the reflex-interrupting cases; dots indicate reflex-sparing cases.
DISCUSSION
PVCN is the site of MOC reflex interneurons
KA injections into AVCN or DCN, as well as cuts of the output tracts of the DCN, failed to cause long-term change in the MOC reflex. Thus, the AVCN and DCN subdivisions do not contain the interneurons that drive the MOC reflex.
KA lesions of the PVCN can produce long-term reduction of the MOC reflex (Figs. 3, 6, 8). This finding is consistent with two anatomical studies (Warr, 1969; Thompson and Thompson, 1991) that identified CN projections to MOC neurons or their vicinity. Warr (1969) demonstrated that lesions of the PVCN produced fiber degeneration leading to and including the periolivary nuclei, the locus of MOC somata. Thompson and Thompson (1991) demonstrated that fibers labeled by an anterograde tracer in PVCN project to MOC neurons labeled by retrograde tracers in the cochlea The present study extends these anatomical studies by showing that the majority of interneurons mediating the sound-evoked MOC reflex must be located in PVCN. The PVCN site of the MOC reflex interneurons is also consistent with a recent finding that electrical stimulation of this subdivision is the most effective for altering DPOAEs (Suzuki et al., 2004). A summary of the putative pathway for the Ipsi MOC reflex is given in Figure 12.
Fig. 12.
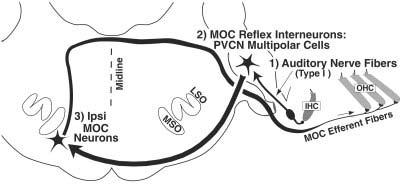
Summary wiring diagram of the Ipsi medial olivocochlear (MOC) reflex. The reflex begins with hair cells of the cochlea and continues with the three neurons of the pathway: (1) auditory-nerve fibers from spiral ganglion cells, (2) multipolar cells of the posteroventral cochlear nucleus (PVCN), and (3) Ipsi MOC neurons, which terminate on outer hair cells (OHCs). IHC, inner hair cell.
All reflex-interrupting lesions involved mainly the dorsal PVCN (Figs. 6, 8, 10), a region responsive to high-frequency sound (Bourk et al., 1981). A high-frequency CN region should be identified by our tests, because high frequencies (f2 = 10 or 12 kHz) were used for the primary tones (because high frequencies elicit the largest MOC reflex in guinea pigs; Kujawa and Liberman, 1998). If lower-frequency primaries had been used, more ventrally placed lesions might have been most effective in reducing the reflex, assuming that the reflex interneurons have a tonotopy similar to other CN principal cells. Our metric for the Contra MOC reflex is also biased toward high frequencies because the effect of contralateral noise was assessed using a DPOAE evoked by high frequencies.
Our data suggest that PVCN interneurons also drive the Contra MOC reflex. All three lesions with long-lasting decreases in the opposite-side Contra reflex involved the PVCN (Fig. 3L). Although two of these also included AVCN, none of the cases confined to AVCN produced a long-term decrease in the opposite-side Contra reflex. Our data are not extensive enough to indicate whether Ipsi and Contra reflexes are driven by exactly the same regions in their respective PVCNs. Two cases showed matching reductions in same-ear Ipsi vs. opposite-ear Contra reflexes; whereas one did not. However, because the stimulus used to elicit the Contra reflex is broad-band noise, Contra reflex assessment may have a somewhat different frequency dependence than the Ipsi reflex assessment. This may account for the lack of complete parity in lesion effects.
Candidate cell types for MOC reflex interneurons
MOC neurons can respond to sound with latencies as short as 5 msec (Robertson and Gummer, 1985; Liberman and Brown, 1986; Brown, 1989). Thus, the primary afferent drive to the reflex cannot be from the unmyelinated axons of type-II spiral ganglion cells, but must involve the myelinated projections from type-I cells innervating inner hair cells (Brown et al., 2003; Fig. 12).
Latency arguments also suggest that PVCN small cells or granule cells do not provide a key link in the CN circuitry. Octopus cells, located in caudal PVCN, can be ruled out for several reasons. First, lesions of the octopus cell region, e.g., Figure 7, showed full recovery of Ipsi reflex strength. Second, cutting the intermediate acoustic stria, the output pathway for octopus cell axons, did not interrupt the reflex (Fig. 3B,C). Third, their transient, “onset” response to tone bursts (Rhode et al., 1983; Rouiller and Ryugo, 1984) does not match the sustained tone-bursts responses observed for MOC neurons (Fex, 1962; Robertson and Gummer, 1985; Liberman and Brown, 1986; Brown, 2001).
PVCN bushy cells also seem unlikely candidates for several reasons. First, although there are many bushy cells in PVCN, especially in the guinea pig (Hackney et al., 1990), they are found predominately in rostral PVCN, whereas caudal lesions of PVCN were most effective in eliminating the MOC reflex (Figs. 8, 10). Second, the onset/pri-notch response of bushy cells (Rhode et al., 1983; Rouiller and Ryugo, 1984; Smith et al., 1991) may not be consistent with the sustained responses of MOC fibers. The pri-notch response pattern is usually associated with low sustained discharge rates, although convergent projections from several globular cells could drive the sustained firing of the MOC neurons. Third, bushy cells are key to the generation of peaks P2 and P3 of the ABR (Melcher and Kiang, 1996), yet we saw several cases with virtually complete loss of P2 and P3 coupled with full recovery of the MOC reflex.
The mostly likely candidate for MOC reflex interneuron is the multipolar cell, a heterogeneous cell type distributed widely throughout the PVCN (Osen, 1969; Brawer et al., 1974; Hackney et al., 1990; Doucet and Ryugo, 1997). First, in addition to octopus cells, multipolar cells are the major neuronal type in caudal PVCN, the locus of our reflex-interrupting lesions. Second, multipolar cells contribute little to the ABR peaks, in agreement with the lack of correlation of KA-induced ABR changes and MOC reflex changes observed in the present study. Third, there is anatomical evidence for multipolar projections to the MOC cells (Thompson and Thompson, 1991). These projections exit the CN by means of the ventral acoustic stria, which is consistent with our observation that cutting the intermediate acoustic stria does not affect MOC reflex strength.
Several subclasses of multipolar cells have been distinguished on both morphological and physiological grounds. For example, “T” multipolar cells project by means of the trapezoid body or ventral acoustic stria, whereas “D” cells project more dorsally (Oertel et al., 1990). Because dorsal cuts were reflex-sparing, MOC reflex interneurons presumably correspond to T multipolar cells. Multipolar cells have also been classified by number of terminals on the soma (Cant, 1981) and by shape of the soma (Doucet and Ryugo, 1997; Doucet et al., 1999). The preponderance of “planar” multipolar cells in PVCN (Doucet et al., 1999) suggests that this subgroup may correspond to the MOC reflex interneurons.
Multipolar cells produce a chopper discharge (Rhode et al., 1983; Rouiller and Ryugo, 1984; reviewed by Rhode and Greenberg, 1992), and several physiological subgroups have been described. Chop-S or “regular” choppers and chop-T or “irregular” choppers are distinguished by interspike intervals (Young et al., 1988). Chop-S units have little adaptation, a characteristic shared by MOC neurons (Brown, 2001). Another subgroup, onset choppers, fires mainly at tone-burst onset and have wide dynamic ranges (Rhode and Smith, 1986), similar to the wide dynamic ranges of MOC neurons (Liberman and Brown, 1986). Other physiological characteristics of chopper neurons are consistent with a role as MOC reflex interneurons: (1) choppers are sharply tuned (Godfrey et al., 1975), as are MOC neurons (Robertson and Gummer, 1985; Liberman and Brown, 1986; Brown, 1989); and (2) choppers show inhibition in their response areas (Shofner and Young, 1985; Blackburn and Sachs, 1992; Rhode and Greenberg, 1994) similar to that reported for some MOC neurons (Brown, 1989).
The idea that multipolar cells drive the MOC system has implications for the interpretation of certain physiological experiments. Electrical stimulation of the inferior colliculus can elicit MOC effects on the cochlea (Ota et al., 2004), and a descending projection from the colliculus to MOC neurons has been described (Faye-Lund, 1986). A descending pathway from the cortex to the MOC neurons has also been described (Mulders and Robertson, 2000) which must be mediating descending influences of the cortex that modulate hair-cell responses (Xiao and Suga, 2001). However, there is also an ascending projection from multipolar cells to the inferior colliculus (Adams, 1979). Thus, if the same multipolar cells project up to the colliculus as well as to the MOC neurons, electrically evoked effects from colliculus stimulation could arise from anti-dromic activation of the multipolar cell reflex interneurons.
Monaural reflexes and binaural facilitation
KA injections into the CN caused large short-term decreases in MOC reflex strength that demonstrate the independence of the four MOC reflexes schematized Figure 3A,D,G,J. Combining the data from the injection-side and opposite-side measurements suggests that reflexes involving afferent traffic through the lesioned CN (Fig. 3A,B,J,K) are greatly reduced, whereas reflexes involving afferent traffic through the intact CN (Fig. 3D,E,G, H) are little changed. This independence of the various MOC reflexes indicates that their effects should be additive, at least for our stimulation paradigm. Neurophysiological studies of single MOC neurons suggest that most receive strong excitatory input from a single dominant ear (Robertson and Gummer, 1985; Liberman and Brown, 1986; Brown, 1989), and a weaker, facilitatory input from the opposite ear (Liberman, 1988; Brown et al., 1998a). In our paradigm, KA injections into the ipsilateral cochlear nucleus did not change the contralateral effect. The contralateral effect thus is a true measure of the Contra reflex: it is mainly generated by the response of Contra neurons rather than the facilitated response of Ipsi neurons. Facilitation may have been missed, though, because our contralateral effect is small and variable. Such facilitation may be generated by a very different reflex pathway, possibly from the marginal shell of AVCN (Ye et al., 2000).
ACKNOWLEDGMENTS
We thank Dr. Daniel J. Lee for comments on the article and Dr. Wen Xu for technical assistance.
Footnotes
Grant sponsor: National Institute on Deafness and Other Communication Disorders; Grant number: RO1 DC 01089; Grant number: RO1 DC 00188; Grant number: P30 DC05209; Grant number: T32 DC00020-11; Grant sponsor: Triological Society.
LITERATURE CITED
- Adams JC. Ascending projections to the inferior colliculus. J Comp Neurol. 1979;183:519–538. doi: 10.1002/cne.901830305. [DOI] [PubMed] [Google Scholar]
- Bird S, Gulley R, Wenthold R, Fex J. Kainic acid injections result in degeneration of cochlear nucleus cells innervated by the auditory nerve. Science. 1978;202:1087–1089. doi: 10.1126/science.31000. [DOI] [PubMed] [Google Scholar]
- Blackburn CC, Sachs MB. Effects of off-BF tones on responses of chopper units in ventral cochlear nucleus I. Regularity and temporal adaptation patterns. J Neurophysiol. 1992;68:124–143. doi: 10.1152/jn.1992.68.1.124. [DOI] [PubMed] [Google Scholar]
- Bourk TR, Mielcarz JP, Norris BE. Tonotopic organization of the anteroventral cochlear nucleus of the cat. Hearing Res. 1981;4:215–241. doi: 10.1016/0378-5955(81)90008-3. [DOI] [PubMed] [Google Scholar]
- Boyev K, Liberman M, Brown M. Effects of anesthesia on efferent-mediated adaptation of the DPOAE. J Assoc Res Otolaryngol. 2002;3:362–373. doi: 10.1007/s101620020044. [DOI] [PMC free article] [PubMed] [Google Scholar]
- Brawer JR, Morest DK, Kane EC. The neuronal architecture of the cochlear nucleus of the cat. J Comp Neurol. 1974;155:251–300. doi: 10.1002/cne.901550302. [DOI] [PubMed] [Google Scholar]
- Brown MC. Morphology of labeled efferent fibers in the guinea pig cochlea. J Comp Neurol. 1987;260:605–618. doi: 10.1002/cne.902600412. [DOI] [PubMed] [Google Scholar]
- Brown MC. Morphology and response properties of single olivocochlear fibers in the guinea pig. Hearing Res. 1989;40:93–110. doi: 10.1016/0378-5955(89)90103-2. [DOI] [PubMed] [Google Scholar]
- Brown MC. Response adaptation of medial olivocochlear neurons is minimal. J Neurophysiol. 2001;86:2381–2392. doi: 10.1152/jn.2001.86.5.2381. [DOI] [PubMed] [Google Scholar]
- Brown MC, Nuttall AL. Efferent control of cochlear inner hair cell responses in the guinea-pig. J Physiol. 1984;354:625–646. doi: 10.1113/jphysiol.1984.sp015396. [DOI] [PMC free article] [PubMed] [Google Scholar]
- Brown MC, Pierce S, Berglund AM. Cochlear-nucleus branches of thick (medial) olivocochlear fibers in the mouse: a cochleotopic projection. J Comp Neurol. 1991;303:300–315. doi: 10.1002/cne.903030211. [DOI] [PubMed] [Google Scholar]
- Brown MC, Kujawa SG, Duca ML. Single olivocochlear neurons in the guinea pig: I. Binaural facilitation of responses to high-level noise. J Neurophysiol. 1998a;79:3077–3087. doi: 10.1152/jn.1998.79.6.3077. [DOI] [PubMed] [Google Scholar]
- Brown MC, Kujawa SG, Liberman MC. Single olivocochlear neurons in the guinea pig: II. Response plasticity due to noise conditioning. J Neurophysiol. 1998b;79:3088–3097. doi: 10.1152/jn.1998.79.6.3088. [DOI] [PubMed] [Google Scholar]
- Brown MC, de Venecia RK, Guinan JJ., Jr. Responses of medial olivocochlear (MOC) neurons: specifying the central pathways of the MOC reflex. Exp Brain Res. 2003;153:491–498. doi: 10.1007/s00221-003-1679-y. [DOI] [PubMed] [Google Scholar]
- Cant NB. The fine structure of two types of stellate cells in the anterior division of the anteroventral cochlear nucleus of the cat. Neuroscience. 1981;6:2643–2655. doi: 10.1016/0306-4522(81)90109-3. [DOI] [PubMed] [Google Scholar]
- Cody AR, Johnstone BM. Acoustically evoked activity of single efferent neurons in the guinea pig cochlea. J Acoust Soc Am. 1982;72:280–282. doi: 10.1121/1.387993. [DOI] [PubMed] [Google Scholar]
- Cooper NP, Guinan JJ., Jr. Separate mechanical processes underlie fast and slow effects of medial olivocochlear efferent activity. J Physiol. 2003;548:307–312. doi: 10.1113/jphysiol.2003.039081. [DOI] [PMC free article] [PubMed] [Google Scholar]
- Coyle JT, Molliver ME, Kuhar MJ. In situ injection of kainic acid: a new method for selectively lesioning neuronal cell bodies while sparing axons of passage. J Comp Neurol. 1978;180:301–324. doi: 10.1002/cne.901800208. [DOI] [PubMed] [Google Scholar]
- de Venecia RK, Liberman MC, Guinan JJ, Jr, Brown MC. Effects of kainate lesions in different cochlear nucleus regions on the MOC reflex. Abstr Assoc Res Otolaryngol. 2001;24:46. [Google Scholar]
- Doucet JR, Ryugo DK. Projections from the ventral cochlear nucleus to the dorsal cochlear nucleus in rats. J Comp Neurol. 1997;385:245–264. [PubMed] [Google Scholar]
- Doucet JR, Ross AT, Gillespie MB, Ryugo DK. Glycine immunoreactivity of multipolar neurons in the ventral cochlear nucleus which project to the dorsal cochlear nucleus. J Comp Neurol. 1999;408:515–531. [PubMed] [Google Scholar]
- Elgoyhen AB, Johnson JB, Boulter J, Vetter D, Heinemann S. Alpha 10:A determinant of nicotinic cholinergic receptor function in mammalian vestibular and cochlear mechanosensory cells. Proc Natl Acad Sci U S A. 2001;98:3501–3506. doi: 10.1073/pnas.051622798. [DOI] [PMC free article] [PubMed] [Google Scholar]
- Elgoyhen AB, Johnson JB, Boulter J, Vetter D, Heinemann S. Alpha 9: An acetylcholine receptor with novel pharmacological properties expressed in rat cochlear hair cells. Cell. 2003;79:705–715. doi: 10.1016/0092-8674(94)90555-x. [DOI] [PubMed] [Google Scholar]
- Faye-Lund H. Projection from the inferior colliculus to the superior olivary complex in the albino rat. Anat Embryol (Berl) 1986;175:35–52. doi: 10.1007/BF00315454. [DOI] [PubMed] [Google Scholar]
- Fekete DM, Rouiller EM, Liberman MC, Ryugo DK. The central projections of intracellularly labeled auditory nerve fibers in cats. J Comp Neurol. 1984;229:432–450. doi: 10.1002/cne.902290311. [DOI] [PubMed] [Google Scholar]
- Fex J. Auditory activity in centrifugal and centripetal cochlear fibers in cat. Acta Physiol Scand. 1962;55(Suppl 189):1–68. [PubMed] [Google Scholar]
- Fex J. Auditory activity in uncrossed centrifugal cochlear fibers in cat. Acta Physiol Scand. 1965;64:43–57. doi: 10.1111/j.1748-1716.1965.tb04152.x. [DOI] [PubMed] [Google Scholar]
- Geisler CD. Hypothesis on the function of the crossed olivocochlear bundle. J Acoust Soc Am. 1974;56:1908–1909. doi: 10.1121/1.1903532. [DOI] [PubMed] [Google Scholar]
- Godfrey DA, Kiang NYS, Norris BE. Single unit activity in the posteroventral cochlear nucleus of the cat. J Comp Neurol. 1975;162:247–268. doi: 10.1002/cne.901620206. [DOI] [PubMed] [Google Scholar]
- Guinan JJ., Jr. The physiology of olivocochlear efferents. In: Dallos P, Popper AN, Fay RR, editors. The cochlea. Springer-Verlag; New York: 1996. pp. 435–502. [Google Scholar]
- Guinan JJ, Jr, Stankovic TK. Medial efferent inhibition produces the largest equivalent attenuations at moderate to high sound levels in cat auditory-nerve fibers. J Acoust Soc Am. 1996;100:1680–1690. doi: 10.1121/1.416066. [DOI] [PubMed] [Google Scholar]
- Gummer M, Yates GK, Johnstone BM. Modulation transfer functions of efferent neurones in the guinea pig cochlea. Hearing Res. 1988;36:41–52. doi: 10.1016/0378-5955(88)90136-0. [DOI] [PubMed] [Google Scholar]
- Hackney CM, Osen KK. The cochlear nucleus of the guinea pig: some light microscopic observations. Neurosci Lett Suppl. 1985;21:S15. [Google Scholar]
- Hackney CM, Pick GF. The distribution of spherical cells in the anteroventral cochlear nucleus of the guinea pig. Br J Audiol. 1986;20:215–220. doi: 10.3109/03005368609079018. [DOI] [PubMed] [Google Scholar]
- Hackney CM, Osen KK, Kolston J. Anatomy of the cochlear nuclear complex of the guinea pig. Anat Embryol (Berl) 1990;182:123–149. doi: 10.1007/BF00174013. [DOI] [PubMed] [Google Scholar]
- Kawase T, Liberman MC. Antimasking effects of the olivocochlear reflex. I. Enhancement of compound action potentials to masked tones. J Neurophysiol. 1993;70:2519–2532. doi: 10.1152/jn.1993.70.6.2519. [DOI] [PubMed] [Google Scholar]
- Kujawa S, Liberman M. Olivocochlear reflex effects on DPOAE amplitude in anesthetized guinea pigs. Abstr Assoc Res Otolaryngol. 1998;21:139. [Google Scholar]
- Kujawa S, Liberman MC. Effects of olivocochlear feedback on distortion product otoacoustic emissions in guinea pig. J Assoc Res Otolaryngol. 2001;2:268–278. doi: 10.1007/s101620010047. [DOI] [PMC free article] [PubMed] [Google Scholar]
- Liberman MC. Efferent synapses in the inner hair cell area of the cat cochlea: An electron microscopic study of serial sections. Hearing Res. 1980;3:189–204. doi: 10.1016/0378-5955(80)90046-5. [DOI] [PubMed] [Google Scholar]
- Liberman MC. Response properties of cochlear efferent neurons: monaural vs. binaural stimulation and the effects of noise. J Neurophysiol. 1988;60:1779–1798. doi: 10.1152/jn.1988.60.5.1779. [DOI] [PubMed] [Google Scholar]
- Liberman MC, Brown MC. Physiology and anatomy of single olivocochlear neurons in the cat. Hearing Res. 1986;24:17–36. doi: 10.1016/0378-5955(86)90003-1. [DOI] [PubMed] [Google Scholar]
- Liberman MC, Puria S, Guinan JJ., Jr. The ipsilaterally evoked olivocochlear reflex causes rapid adaptation of the 2f1-f2 distortion product otoacoustic emission. J Acoust Soc Am. 1996;99:3572–3584. doi: 10.1121/1.414956. [DOI] [PubMed] [Google Scholar]
- Maison SF, Adams JC, Liberman MC. Olivocochlear innervation in the mouse: Immunocytochemical maps, crossed versus uncrossed contributions, and transmitter colocalization. J Comp Neurol. 2003;455:406–416. doi: 10.1002/cne.10490. [DOI] [PMC free article] [PubMed] [Google Scholar]
- Melcher JR, Kiang NYS. Generators of the brainstem auditory evoked potential in cat III. Identified cell populations. Hearing Res. 1996;93:52–71. doi: 10.1016/0378-5955(95)00200-6. [DOI] [PubMed] [Google Scholar]
- Melcher JR, Guinan JJ, Jr, Knudson IM, Kiang NYS. Generators of the brainstem auditory evoked potential in cat. II. Correlating lesion sites with waveform changes. Hearing Res. 1996a;93:28–51. doi: 10.1016/0378-5955(95)00179-4. [DOI] [PubMed] [Google Scholar]
- Melcher JR, Knudson IM, Fullerton BC, Guinan JJ, Jr, Norris BE, Kiang NYS. Generators of the brainstem auditory evoked potential in cat: I. An experimental approach to their identification. Hearing Res. 1996b;93:1–27. doi: 10.1016/0378-5955(95)00178-6. [DOI] [PubMed] [Google Scholar]
- Mountain DC. Changes in endolymphatic potential and crossed olivocochlear bundle stimulation alter cochlear mechanics. Science. 1980;210:71–72. doi: 10.1126/science.7414321. [DOI] [PubMed] [Google Scholar]
- Mugnaini E, Warr WB, Osen KK. Distribution and light microscopic features of granule cells in the cochlear nucleus of cat, rat, and mouse. J Comp Neurol. 1980;191:581–606. doi: 10.1002/cne.901910406. [DOI] [PubMed] [Google Scholar]
- Mulders WHAM, Robertson D. Evidence for direct cortical innervation of medial olivocochlear neurones in rats. Hearing Res. 2000;144:65–72. doi: 10.1016/s0378-5955(00)00046-0. [DOI] [PubMed] [Google Scholar]
- Oertel D, Wu SH, Garb MW, Dizack C. Morphology and physiology of cells in slice preparations of the posteroventral cochlear nucleus of mice. J Comp Neurol. 1990;295:136–154. doi: 10.1002/cne.902950112. [DOI] [PubMed] [Google Scholar]
- Osen KK. Cytoarchitecture of the cochlear nuclei in the cat. J Comp Neurol. 1969;136:453–484. doi: 10.1002/cne.901360407. [DOI] [PubMed] [Google Scholar]
- Osen KK. Projection of the cochlear nuclei on the inferior colliculus in the cat. J Comp Neurol. 1972;144:355–372. doi: 10.1002/cne.901440307. [DOI] [PubMed] [Google Scholar]
- Ota Y, Oliver D, Dolan DF. Frequency-specific effects on cochlear responses during activation of the inferior colliculus in the guinea pig. J Neurophysiol. 2004;91:2185–2193. doi: 10.1152/jn.01155.2003. [DOI] [PubMed] [Google Scholar]
- Rajan R. Frequency and loss dependence of the protective effects of the olivocochlear pathways in cats. J Neurophysiol. 1995;74:598–615. doi: 10.1152/jn.1995.74.2.598. [DOI] [PubMed] [Google Scholar]
- Reiter ER, Liberman MC. Efferent mediated protection from acoustic overexposure: relation to “slow” effects of olivocochlear stimulation. J Neurophysiol. 1995;73:506–514. doi: 10.1152/jn.1995.73.2.506. [DOI] [PubMed] [Google Scholar]
- Rhode WS, Greenberg S. Physiology of the cochlear nuclei. In: Popper AN, Fay RR, editors. The mammalian auditory pathway: neurophysiology. Springer-Verlag; New York: 1992. pp. 94–152. [Google Scholar]
- Rhode WS, Greenberg S. Lateral suppression and inhibition in the cochlear nucleus of the cat. J Neurophysiol. 1994;71:493–513. doi: 10.1152/jn.1994.71.2.493. [DOI] [PubMed] [Google Scholar]
- Rhode WS, Smith P. Encoding of timing and intensity in the ventral cochlear nucleus of the cat. J Neurophysiol. 1986;56:261–286. doi: 10.1152/jn.1986.56.2.261. [DOI] [PubMed] [Google Scholar]
- Rhode WS, Oertel D, Smith PH. Physiological response properties of cells labeled intracellularly with horseradish peroxidase in cat ventral cochlear nucleus. J Comp Neurol. 1983;213:448–463. doi: 10.1002/cne.902130408. [DOI] [PubMed] [Google Scholar]
- Robertson D, Gummer M. Physiological and morphological characterization of efferent neurons in the guinea pig cochlea. Hearing Res. 1985;20:63–77. doi: 10.1016/0378-5955(85)90059-0. [DOI] [PubMed] [Google Scholar]
- Robertson D, Winter IM. Cochlear nucleus inputs to olivocochlear neurones revealed by combined anterograde and retrograde labelling in the guinea pig. Brain Res. 1988;462:47–55. doi: 10.1016/0006-8993(88)90583-5. [DOI] [PubMed] [Google Scholar]
- Rouiller EM, Ryugo DK. Intracellular marking of physiologically characterized cells in the ventral cochlear nucleus of the cat. J Comp Neurol. 1984;225:167–186. doi: 10.1002/cne.902250203. [DOI] [PubMed] [Google Scholar]
- Ryugo DK, Willard FH. The dorsal cochlear nucleus of the mouse: a light microscopic analysis of neurons that project to the inferior colliculus. J Comp Neurol. 1985;242:381–396. doi: 10.1002/cne.902420307. [DOI] [PubMed] [Google Scholar]
- Shofner WP, Young ED. Excitatory/Inhibitory response types in the cochlear nucleus: relationships to discharge patterns and responses to electrical stimulation of the auditory nerve. J Neurophysiol. 1985;54:917–939. doi: 10.1152/jn.1985.54.4.917. [DOI] [PubMed] [Google Scholar]
- Siegel JH, Kim DO. Efferent neural control of cochlear mechanics? Olivocochlear bundle stimulation affects cochlear biomechanical nonlinearity. Hearing Res. 1982;6:171–182. doi: 10.1016/0378-5955(82)90052-1. [DOI] [PubMed] [Google Scholar]
- Smith PH, Joris PX, Carney LH, Yin TCT. Projections of physiologically characterized globular bushy cell axons from the cochlear nucleus of the cat. J Comp Neurol. 1991;304:387–407. doi: 10.1002/cne.903040305. [DOI] [PubMed] [Google Scholar]
- Spangler KM, Warr WB. The descending auditory system. In: Altschuler RA, Bobbin RP, Clopton BM, Hoffman DW, editors. Neurobiology of hearing: the central auditory system. Raven Press; New York: 1991. pp. 27–45. [Google Scholar]
- Stineman RW. A consistently well-behaved method of interpolation. 1980 Creative Computing July 1980. [Google Scholar]
- Sun X-M, Kim DO. Adaptation of 2f1-2f2 distortion product otoacoustic emission in young-adult and old CBA and C57 mice. J Acoust Soc Am. 1999;105:3399–3409. doi: 10.1121/1.424668. [DOI] [PubMed] [Google Scholar]
- Suzuki R, Lee DJ, Brown MC. Olivocochlear and middle ear muscle reflex interneurons in the cochlear nucleus. Abstr Assoc Res Otolaryngol. 2004;27:354. [Google Scholar]
- Thompson AM, Thompson GC. Posteroventral cochlear nucleus projections to olivocochlear neurons. J Comp Neurol. 1991;303:267–285. doi: 10.1002/cne.903030209. [DOI] [PubMed] [Google Scholar]
- Ver IL, Brown RM, Kiang NYS. Low-noise chambers for auditory research. J Acoust Soc Am. 1975;58:392–398. doi: 10.1121/1.380682. [DOI] [PubMed] [Google Scholar]
- Vetter DE, Mugnaini E. Distribution and dendritic features of three groups of rat olivocochlear neurons. A study with two retrograde cholera toxin tracers. Anat Embryol (Berl) 1992;185:1–16. doi: 10.1007/BF00213596. [DOI] [PubMed] [Google Scholar]
- Vetter DE, Liberman MC, Mann J, Barhanin J, Boulter J, Brown MC, Saffiote-Kolman J, Heinemann SF, Elgoyhen AB. Role of α9 nicotinic ACh receptor subunits in the development and function of cochlear efferent innervation. Neuron. 1999;23:93–103. doi: 10.1016/s0896-6273(00)80756-4. [DOI] [PubMed] [Google Scholar]
- Warr WB. Fiber degeneration following lesions in the posteroventral cochlear nucleus of the cat. Exp Neurol. 1969;23:140–155. doi: 10.1016/0014-4886(69)90040-5. [DOI] [PubMed] [Google Scholar]
- Warr WB. Organization of olivocochlear efferent systems in mammals. In: Webster DB, Popper AN, Fay RR, editors. The mammalian auditory pathway: neuroanatomy. Springer-Verlag; New York: 1992. pp. 410–448. [Google Scholar]
- Warr WB, Guinan JJ., Jr. Efferent innervation of the organ of Corti: two separate systems. Brain Res. 1979;173:152–155. doi: 10.1016/0006-8993(79)91104-1. [DOI] [PubMed] [Google Scholar]
- Wiederhold ML, Kiang NYS. Effects of electric stimulation of the crossed olivocochlear bundle on single auditory-nerve fibers in the cat. J Acoust Soc Am. 1970;48:950–965. doi: 10.1121/1.1912234. [DOI] [PubMed] [Google Scholar]
- Winslow R, Sachs MB. Effect of electrical stimulation of the crossed olivocochlear bundle on auditory nerve response to tones in noise. J Neurophysiol. 1987;57:1002–1021. doi: 10.1152/jn.1987.57.4.1002. [DOI] [PubMed] [Google Scholar]
- Wuerthele SM, Lovell KL, Jones MZ, Moore KE. A histological study of kainic acid-induced lesions in the rat brain. Brain Res. 1978;149:489–497. doi: 10.1016/0006-8993(78)90491-2. [DOI] [PubMed] [Google Scholar]
- Xiao Z, Suga N. Modulation of cochlear hair cells by the auditory cortex in the mustached bat. Nat Neurosci. 2001;5:57–63. doi: 10.1038/nn786. [DOI] [PubMed] [Google Scholar]
- Ye Y, Machado DG, Kim DO. Projection of the marginal shell of the anteroventral cochlear nucleus to olivocochlear neurons in the cat. J Comp Neurol. 2000;420:127–138. [PubMed] [Google Scholar]
- Young ED, Robert J-M, Shofner WP. Regularity and latency of units in ventral cochlear nucleus: implications for unit classification and generation of response properties. J Neurophysiol. 1988;60:1–29. doi: 10.1152/jn.1988.60.1.1. [DOI] [PubMed] [Google Scholar]