

Abstract
The Streptococcus pneumoniae toxin pneumolysin belongs to the group of cholesterol-dependent cytolysins. It produces rapid cell lysis at higher concentrations or apoptosis at lower concentrations. In cell membranes, it forms prepores and pores. Here, we show that sublytic concentrations of pneumolysin produce rapid activation of Rho and Rac GTPases and formation of actin stress fibers, filopodia, and lamellipodia. That Rac1-specific and Rho-associated kinase (ROCK)-specific inhibitors reverted the formation of lamellipodia and stress fibers, respectively, identifies RhoA and Rac1 as key toxin effectors. Live imaging excluded macropore formation (as judged by membrane impermeability toward calcein) but indicated very early membrane depolarization [as judged by bis-(1,3-dibutylbarbituric acid)trimethine oxanol staining], indicative of formation of micropores with ion channel properties. That Rac1-dependent lamellipodia formation was reverted by the voltage-gated calcium channel inhibitor SKF96365 and by toxin exposure in calcium-free medium suggests a role for calcium influx via endogenous calcium channels in the Rac1 activation. Cellular cholesterol depletion by methyl-β-cyclodextrin or incubation of the toxin with cholesterol before cell treatment eliminated its membrane binding and the subsequent GTPase activation. Thus, that our experiments show small GTPase activation by a cholesterol-dependent cytolysin suggests a membrane cholesterol-dependent activation mechanism.
Keywords: cholesterol-binding cytolysin, small GTPase
Streptococcus pneumoniae causes sepsis, meningitis, otitis media, and infections of the respiratory tract. Pneumococcal meningitis is accompanied by a high mortality and substantial residual neurological sequelae in surviving patients (1). A major virulence factor of S. pneumoniae is the 52-kDa toxin pneumolysin (PLY).
PLY belongs to the group of cholesterol-dependent cytolysins (CDCs) and shares homology with other toxins, such as perfringolysin O, streptolysin O, and others (2). Bacterial lysis releases PLY monomers in the interstitial space that assemble into membrane-bound multimers. A typical feature of this class of toxins is the formation of ring-like pores in cholesterol-containing membranes that lead to cell lysis. The “classical” PLY pore consists of 30–50 monomers that form a transmembrane channel with a diameter of ≈260 Å, allowing the exchange of ions and some small molecules (3). Recently, an additional prepore step was described by cryoelectron microscopy analysis (3).
Bacteria have developed mechanisms to facilitate their interaction with higher organisms during the course of evolution. One of these mechanisms is the pore-forming capacity of CDCs. Other toxins modulate intracellular signaling cascades and allow bacteria to overcome the pathogen defense of the host. The modulation of the Rho GTPases is most common, facilitating pathogen penetration through the endothelial barriers of the organism. Rho GTPases belong to the large superfamily of Ras proteins, monomeric GTP-binding proteins with a molecular mass between 20 and 30 kDa. They translate environmental changes into cellular morphological responses. Rho, Rac, and Cdc42 are the most thoroughly studied Rho GTPases. They mediate cell adhesion, motility, endo- and exocytosis, and phagocytosis through the regulation of actin cytoskeleton. Furthermore, the Rho GTPases affect apoptotic processes, gene expression, and the microtubule cytoskeleton (4).
Rho-family GTPases exist in an inactive GDP-bound form and an active GTP-bound form. Guanine nucleotide exchange factors (GEFs) mediate the release of GDP and binding of GTP to the GTPases, which leads to their activation. GTP-bound GTPases undergo a conformational change that permits the interaction with downstream effectors. GTPases are inactivated by GTP hydrolysis to GDP, which is initiated by GTPase-activating proteins (GAPs) (5). GTPases are maintained in the inactive form in the cytoplasm by binding to guanine dissociation inhibitors (GDIs).
Bacteria have elaborated two approaches to manipulate the small GTPase activity of the host cell:
By covalent GTPase modification (5). Some toxins, such as Clostridium difficile toxins A and B, Clostridium botulinum exoenzyme C3, and Clostridium sordelli lethal toxin, modify a residue in the switch 1 domain of the GTPases to inhibit their coupling to downstream effectors, thus inhibiting their action (6–8). Others, such as the cytotoxic necrotizing factors (CNF) 1 and 2 (CNF1 and CNF2) from pathogenic Escherichia coli, the dermonecrotizing toxin from Bordetella bronchiseptica, and the CNF of Yersinia pseudotuberculosis activate GTPases by modifying a residue in the switch 2 domain, blocking GAP-mediated GTPase activation (9–12).
By mimicking GTPase regulatory proteins. Some Gram-negative bacteria possess a type III secretion apparatus, allowing them to “inject” toxins into the host cell cytoplasm. These toxins mimic GTPase regulatory proteins. YopE from Yersinia, ExoS from Pseudomonas aeruginosa, and SptP from Salmonella act as GAPs. SopE from Salmonella typhimurium acts as a GEF for Rac and Cdc42 (13, 14).
We found that PLY leads to the rapid formation of filopodia, stress fibers, and lamellipodia in neuronal cells, consistent with the activation of RhoA and Rac1, respectively. That their activation preceded the formation of lytic PLY macropores revealed the involvement of pore-independent and/or micropore-dependent mechanisms in the cytoskeletal modifications effected by this CDC.
Results
PLY Induces Rapid Cell Shape Changes That Precede Macropore, but Not Micropore, Formation.
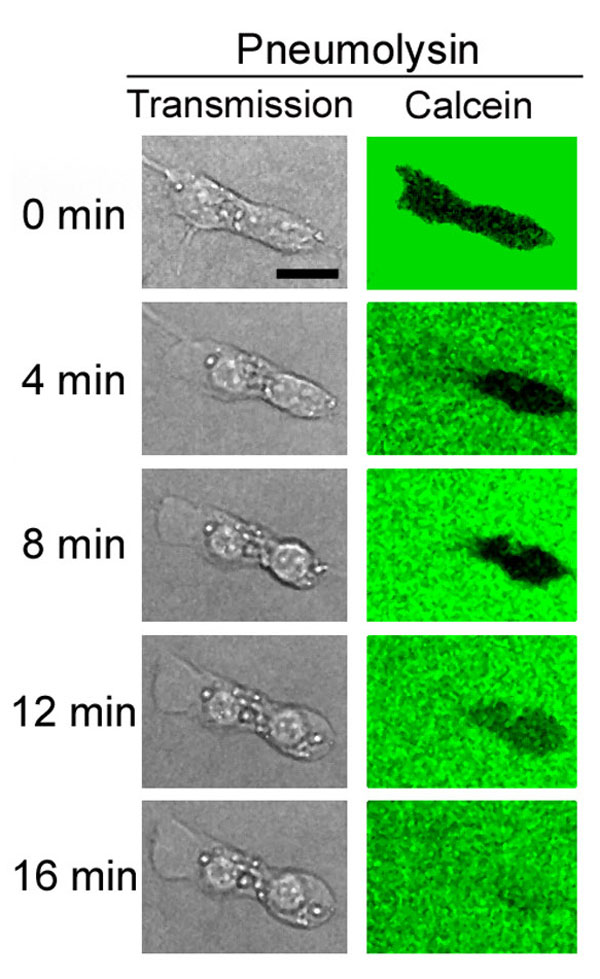
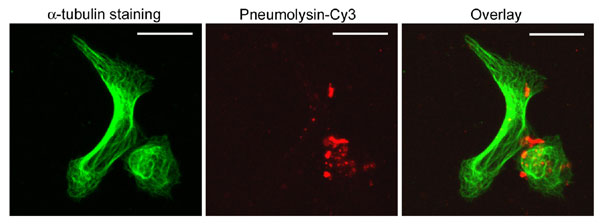
Live imaging experiments with human SH-SY5Y neuroblastoma cells showed cell shape changes within 4–8 min after treatment with 0.35 μg/ml PLY (Fig. 1). Macropore formation was assessed by exclusion of the fluorescent marker calcein, which has a diameter of 13 Å, ≈1/20 that of a PLY macropore (15). The mock-treated control cells (henceforth referred to as “control cells”) showed no discernable motility, cell shape change, or permeabilization within 60 min (Fig. 1A). Within 20 min of PLY treatment, ≈20% of the cells became permeabilized [white arrowheads in Fig. 1 A and B and both cells shown in supporting information (SI) Fig. 5]. Permeabilization was accompanied by nuclear condensation and cell swelling (SI Fig. 5). Other cells remained impermeable for calcein but demonstrated early cell shape changes, such as shrinking (asterisk in Fig. 1A), membrane protrusions (Fig. 1 A and B), or motility (red arrowheads in Fig. 1B). Such rapid cell shape changes imply the active remodeling of the actin cytoskeleton. The variation among cell phenotypes after toxin challenge could be explained by variable toxin loads, confirmed by imaging of Cy3-labeled PLY (SI Fig. 6).
Fig. 1.

Live imaging of PLY-treated SH-SY5Y neuroblastoma cells. (A) Cells were treated with 0.35 μg/ml PLY in medium containing fluorescent calcein to verify macropore formation. Whereas untreated cells preserved an intact morphology and constant cell shape excluding the calcein, after treatment with PLY, some cells shrunk without permeabilization (asterisk), whereas others were permeabilized (white arrowheads). (B) Some cells showed lamellipodia- and filopodia-like membrane protrusions, and increased motility without permeabilization (red arrowheads). (C) Cell incubation with membrane potential-sensitive dye DiBAC4(3) revealed membrane depolarization within the first 30–60 s after exposure to 0.1 μg/ml PLY, as judged by an increase of the relative fluorescent intensity. Values represent mean ± SEM. n = 10 cells. (Scale bars, 10 μm.)
That cell incubation with the membrane potential-sensitive fluorescent dye bis-(1,3-dibutylbarbituric acid)trimethine oxanol [DiBAC4(3)] revealed membrane depolarization within the first 30–60 s after exposure to 0.1 μg/ml PLY suggests the formation of micropores with depolarizing properties (Fig. 1C).
PLY Activates RhoA and Rac1 GTPases, and Produces Stress Fibers, Filopodia, and Lamellipodia.
SH-SY5Y cells were fixed, and the actin cytoskeleton was visualized by using phalloidin staining at different time points of 0.1 μg/ml PLY challenge (Fig. 2A). Indeed, 4–8 min after treatment, stress fibers and massive lamellipodia and filopodia were formed. Approximately two-thirds of the cells demonstrated a combined lamellipodia/stress fiber phenotype, whereas 1/3 predominantly formed filopodia. Stress fiber formation persisted during a longer observation period of 60 min, whereas lamellipodia, although present even at 60 min after toxin challenge, started diminishing between 45 and 60 min (data not shown), and plateaued at 12–16 min after exposure of the cells.
Fig. 2.

PLY treatment induces actin remodeling and small GTPase activation. (A) Phalloidin staining of SH-SY5Y cells after 0.1 μg/ml PLY treatment revealed filopodia, lamellipodia, and stress fiber formation. (Scale bars, 10 μm.) (B) Pull-down analysis of active RhoA, Rac, and Cdc42, visualized by using Western blotting (Left), showed increased RhoA and Rac activation 4, 8, and 16 min (4′, 8′, and 16′) after treatment with 0.1 μg/ml PLY vs. mock-treated controls (Ctrl or 0′). (Right) Bars represent densitometric analysis of five independent experiments. All values represent means ± SEM. ∗∗∗, P < 0.001, repeated measures ANOVA with Bonferroni post hoc test. (C) The specific Rac1 inhibitor NSC23766 (100 μM) inhibited the formation of lamellipodia 8 min after 0.1 μg/ml PLY treatment. All values represent means ± SEM. n = 100 cells for the lamellipodia perimeter length experiments; n = 4 experiments for the relative lamellipodia density evaluation. ∗∗, P < 0.01; ∗∗∗, P < 0.001, one-way ANOVA with Bonferroni post hoc test. (D) The specific ROCK inhibitor Y27632 (10 μM) reverted the increased stress fiber formation 20 min after 0.1 μg/ml PLY treatment. All values represent means ± SEM of five independent experiments. ∗∗∗, P < 0.001, one-way ANOVA with Bonferroni post hoc test.
Generally, Rho-subclass GTPases predominantly produce stress fiber formation, Rac–filopodia and lamellipodia, and Cdc42–filopodia (16). A rhotekin-based pull-down assay identified an ≈3-fold activation of RhoA as early as 4 min after PLY treatment, which increased to ≈6-fold at 8 and 16 min (P < 0.001 for the three time points, one-way ANOVA) (Fig. 2B). A p21-activated kinase-based pull-down assay showed ≈5-fold Rac activation within the first 4 min, and the activation remained constant for 16 min (P < 0.001 for all time points, one-way ANOVA), whereas Cdc42 showed an upward trend that did not reach statistical significance (Fig. 2B). Analysis of Rho/Rac activation dynamics revealed an increase within the first 30 min with a subsequent decrease to basic levels (data not shown).
The molecular basis of the actin changes was verified by cell treatment with the Rac1-specific inhibitor NSC23766 and the RhoA–associated kinase (ROCK) inhibitor Y27632; the latter is known to inhibit stress fiber formation after RhoA activation. That NSC23766 reduced the number of PLY-induced lamellipodia at 8 min of treatment (P < 0.01 vs. PLY-treated cells, one-way ANOVA) (Fig. 2C and SI Fig. 7), and lamellipodia perimeter length (P < 0.001 vs. PLY-treated cells, one-way ANOVA) (Fig. 2C and SI Fig. 7) confirmed the role of Rac1 in lamellipodia formation. That the inhibitor Y27632 prevented the increased stress fiber formation at 20 min of PLY treatment implies a role of RhoA (Fig. 2D and SI Fig. 7) (P < 0.001 vs. PLY-treated cells, one-way ANOVA).
The Actin Phenotype Is Not Caused by Cell Death Mechanisms.
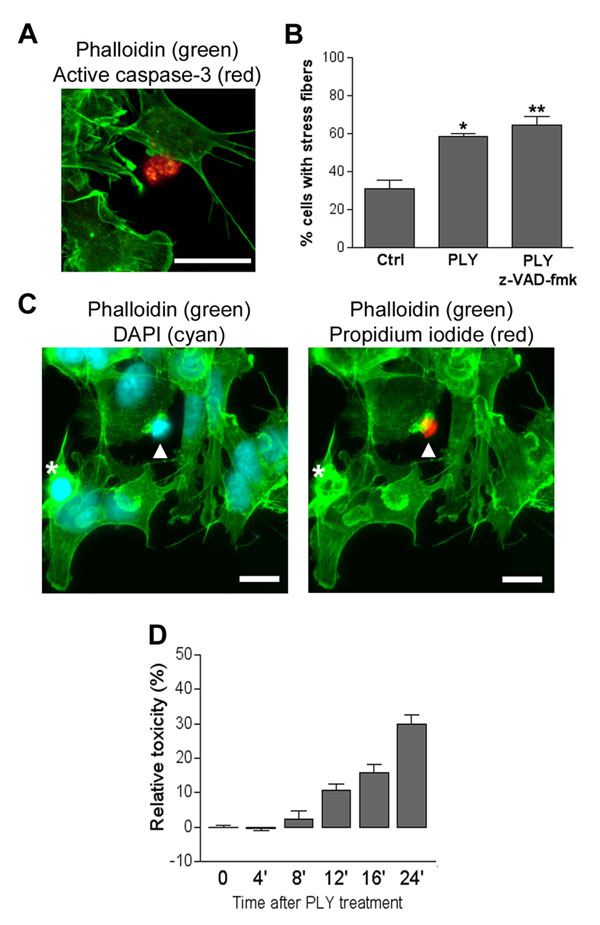
Because apoptosis is a major phenomenon in cell death that has been induced by low concentrations of PLY, and small GTPases are known to be involved in apoptosis (5), we tested whether the actin phenotype correlates with markers of cell damage. We investigated caspase-3 activation (early apoptosis marker), because ROCK activation and stress fiber formation could occur after ROCK cleavage by activated caspase-3 (17). Cells with activated caspase-3 were completely devoid of actin staining (SI Fig. 8A). No change of the PLY-induced stress fiber formation was observed in the presence of 50 μM z-VAD-fmk pancaspase inhibitor, either (SI Fig. 8B).
Next, cells were treated with PLY for 12 min in propidium iodide (PI)-containing medium. PI has a molecular size similar to that of calcein and stains nuclei upon membrane permeabilization. Nuclear PI staining was never observed in cells with actin stress fibers, filopodia, or lamellipodia (SI Fig. 8C). Actin labeling was completely absent in cells that exhibited PI-staining of the chromatin (SI Fig. 8C, arrowhead). Cells with an intact membrane but with signs of ongoing damage (e.g., condensed nuclei in DAPI staining) (SI Fig. 8C, asterisks) possessed a collapsed actin cytoskeleton without formation of lamellipodia, filopodia, or stress fibers. Finally, a lactate dehydrogenase-release toxicity test revealed the first signs of cell lysis 8–12 min after PLY exposure, when the actin changes were already fully developed (SI Fig. 8D).
PLY Produces Rapid Vesicle Release with a Possible Role for RhoA Activation.
Human neuroblastoma cells were either prelabeled for 10 min at 37°C with FM1-43FX dye (to stain their plasmalemma and endosomes) or exposed to the dye simultaneously with PLY for 2 min (recycled vesicles staining). In both cases, strong vesicle release at the apical portion of the cells and decreased vesicle recycling was observed (SI Fig. 9A). Cell exposure to α-latrotoxin, which induces exocytosis and mediator release in neuronal cells (18), failed to produce lamellipodia formation but did initiate stress fibers (SI Fig. 9 B and C). Thus, we cannot exclude the possibility that RhoA activation by PLY is produced secondary to vesicle release, mediator release, and subsequent receptor effects.
Rac Activation Depends on the Influx of Extracellular Ca2+.
Cellular Ca2+ influx is observed after treatment with PLY (19, 20). Thus, we analyzed the role of extracellular Ca2+ on actin modifications. In Ca2+-depleted buffer, PLY induced the formation of filopodia but virtually without lamellipodia (Fig. 3A). Pull-down analysis of active GTPases confirmed that RhoA activation was preserved at similar levels in Ca2+-containing and Ca2+-depleted buffer (≈1.5 times). In contrast, Rac1 activation was completely inhibited in Ca2+-depleted buffer, compared with ≈2.5 times activation in Ca2+-containing buffer (Fig. 3B). That PLY treatment in the presence of the voltage-gated Ca2+ channel blocker SKF96365 inhibited Rac1-dependent lamellipodia formation implies a role for endogenous Ca2+ channels (Fig. 3C). Because cytosolic Ca2+ influx might produce Rac activation in a protein kinase C (PKC)-dependent way (21), we exposed neuroblastoma cells to PLY in the presence of the PKC inhibitor Gö 6850, which inhibited lamellipodia formation (Fig. 3D). Nevertheless, note that none of the inhibitors tested exactly produced the PLY phenotype in Ca2+-free buffer, implying the existence of additional modification factors.
Fig. 3.

Extracellular Ca2+ and small GTPase activation. (A) Treatment of human neuroblastoma cells with 0.1 μg/ml PLY for 12 min in Ca2+-containing extracellular buffer produces the formation of filopodia, lamellipodia, and stress fibers (phalloidin staining). Incubation in nominally Ca2+-free buffer fully inhibited the formation of lamellipodia and resulted in massive filopodia formation. (B) Incubation in nominally Ca2+-free buffer inhibited the activation of Rac1, as confirmed by activity pull-down assays. (C) The voltage-gated Ca2+ channel blocker SKF96365 (40 μM) inhibited the formation of lamellipodia by PLY. Values represent means ± SEM. ∗∗∗, P < 0.001 vs. PLY, one-way ANOVA with Bonferroni post hoc test. (D) PKC inhibition by 2 μM Gö 6850 prevented PLY-induced lamellipodia formation (phalloidin staining). (Scale bars, 10 μm.)
PLY Does Not Function as a Small GTPase GEF.
Some bacteria that modulate GTPase activity have developed the ability to deliver their toxins in the host cytoplasm to perform GEF or GAP-like function. PLY did not exhibit intrinsic GEF-like activity toward Rho and Rac in an in vitro biochemical assay at a concentration of 70 μg/ml (1.2 μM) purified PLY (data not shown).
Toxin Effects Are Cholesterol-Dependent.
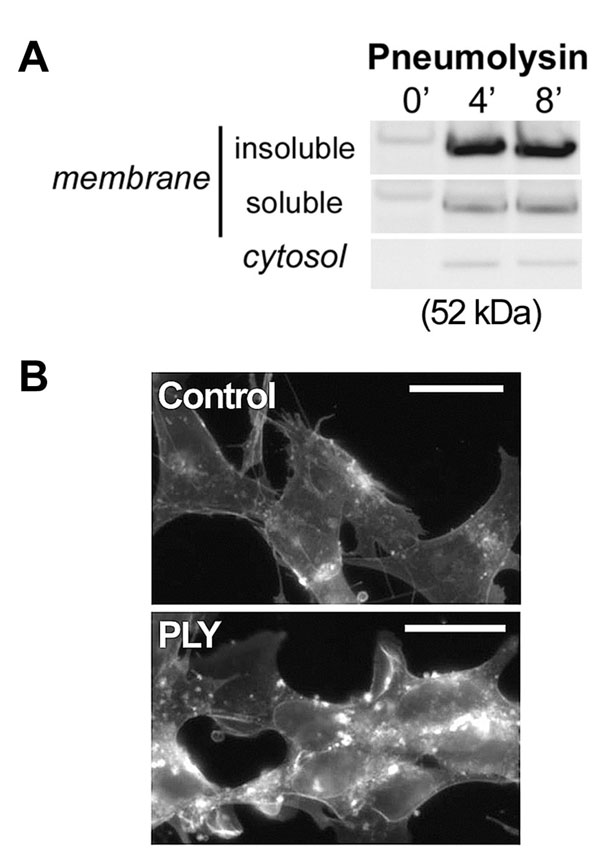
To test whether the activation of small GTPases by PLY depends on the presence of an intact membrane, we performed activation assays on membrane-free cell lysates, but neither Rac1 nor RhoA was activated (data not shown). The cholesterol affinity of the toxin was verified by detergent-based fractionation of crude membrane preparations. PLY nearly completely localized in the detergent-insoluble cholesterol-rich fraction (SI Fig. 10A). Cholesterol inactivation experiments represent a standard approach to verify cholesterol-dependence of the effects of PLY and the other members of the CDC group (22). We exposed PLY to cholesterol at mass ratios of 1:1 and 1:5 for 15 min at 37°C immediately before challenging the cells with the toxin. The 1:1 cholesterol:PLY pretreatment reduced the formation of lamellipodia and filopodia, although actin stress fiber formation persisted. After cholesterol pretreatment of the toxin at a 5:1 cholesterol:PLY ratio, the PLY-induced actin changes were completely absent (Fig. 4A). Analysis of cellular toxin binding by using Western blotting verified that such cholesterol pretreatment inhibited the PLY binding to cell membranes (Fig. 4B). Similarly inhibited toxin binding was observed after cellular cholesterol depletion by 2 mM methyl-β-cyclodextrin (MβCD) for 15 min before PLY challenge (Fig. 4B), which resembles the nearly complete inhibition of prefringolysin O membrane binding after MβCD cholesterol depletion in platelets (23). Because MβCD treatment itself produces actin changes, we analyzed the level of RhoA and Rac activation by pull-down analysis. MβCD fully inhibited PLY-induced GTPase activation (Fig. 4C).
Fig. 4.

GTPase activation and actin remodeling by PLY are cholesterol-dependent. (A) Cholesterol pretreatment of the toxin led to a partial (1:1 toxin:cholesterol wt/wt ratio) or full (1:5 ratio) inhibition of the actin changes 12 min after 0.1 μg/ml PLY treatment. Chol, cholesterol. (Scale bars, 10 μm.) (B) Cholesterol pretreatment of the toxin (1:5 toxin:cholesterol ratio) and cell membrane cholesterol depletion with 2 mM MβCD before 0.1 μg/ml PLY challenge for 12 min inhibited the cellular toxin binding. (C) Membrane cholesterol depletion with 2 mM MβCD fully inhibited the activation of RhoA and Rac1 after 8 min of 0.1 μg/ml PLY treatment.
Visualization of cellular cholesterol by the fluorescent cholesterol-binding antibiotic filipin revealed a relatively homogenous cholesterol distribution, whereas at 4–8 min of treatment with 0.1 μg/ml PLY, cholesterol clustered in patches (bright spots in SI Fig. 10B).
Discussion
Using a combination of live cell imaging, protein biochemistry, and conventional microscopy, we present evidence on the activation of RhoA and Rac1 GTPases by the cholesterol-binding pore-forming toxin PLY.
During evolution, bacteria have evolved to modify the actin cytoskeleton to increase their virulence. Strategies aiming at the activation of small GTPases can be divided in two major groups. The first includes the toxins CNF1 and CNF2, the dermonecrotizing toxin from B. bronchiseptica, and the CNF of Y. pseudotuberculosis (see Introduction) that act by amino acid modification in the switch 2 domain to block GTPase activity (9–11). CNF1 and CNF2 catalyze the deamidation of glutamine-63 of Rho to glutamic acid (12, 24). The dermonecrotizing toxin from B. bronchiseptica deamidates or polyamidates the same residue to achieve the same effect (25). These modifications change the charge of the GTPase molecules, a change that is apparent from a motility shift during SDS/PAGE, especially for RhoA (10). In our pull-down assays, none of the RhoA and Rac1 species demonstrated an electrophoretic shift. Additionally, that PLY does not share homology with these toxins makes this activation mechanism very unlikely.
Pore formation by PLY, perfringolysin O, and other toxins of the group is well established, and the molecular mechanisms of the process are known in detail. Because the average pore size is 260 Å (3), calcein and PI should easily penetrate. However, our data showed that the activation of small GTPases occurs before macropore formation. Electrophysiological evidence with artificial membranes, however, shows that PLY produces a heterogenous population of pores with different sizes and various ion conductivities (26). The early membrane depolarization as judged by DiBAC4(3) staining supports the concept of formation of micropores with depolarizing ion channel properties.
Because previous reports indicate the critical role of Ca2+ influx in PLY-induced cell death (19, 20), we tested whether extracellular Ca2+ contributes to the observed phenotype. Ca2+-free extracellular buffer inhibited Rac1 activation after PLY treatment, whereas Rho activation was preserved. Considering that Ca2+ influx by itself might suffice for the activation of Rac1, we challenged the neuroblastoma cells with the Ca2+ ionophore ionomycin. However, that no sign of lamellipodia (the major Rac1-associated phenotype in our system) was observed indicates that additional factors are required besides the influx of Ca2+. The efficient inhibition of lamellipodia formation by the voltage-gated Ca2+ channel blocker SKF96365 suggests that extracellular Ca2+ influx occurs via endogenous channels, most probably triggered by the early membrane depolarization, rather than through Ca2+-permeable toxin pores. In 3T3 cells, intracellular Ca2+ transients together with protein kinase C activation are required for the phosphorylation of RhoGDIα and the subsequent Rac activation and translocation to the plasma membrane after thrombin receptor activation (21). The lack of either Ca2+ increase or thrombin receptor activation is sufficient to prevent effective Rac1 activation. We speculate that a similar “permissive” role of extracellular Ca2+ influx might be present in the PLY-induced Rac1 activation. The efficient inhibition of lamellipodia formation by a PKC inhibitor in our system implies the existence of a similar mechanism. Nevertheless, note that PKC inhibition combined with PLY treatment does not fully reproduce the actin phenotype in Ca2+-free buffer, suggesting the involvement of additional mechanisms.
Toxin pretreatment with cholesterol and cellular cholesterol depletion by MβCD fully inhibited cholesterol binding to the membrane and the subsequent GTPase activation and actin remodeling. Note, however, that MβCD treatment could inhibit RhoA and Rac1 activation by means of lipid raft disruption (27).
We observed membrane cholesterol clustering in filipin-stained cholesterol patches after toxin exposure. Similar lipid microdomain clustering is known for another cholesterol-binding pore-forming toxin, listeriolysin O (28), which shares partial homology with PLY and streptolysin O (29). Cholesterol-rich membrane microdomains are known to play a role in small GTPase activation and actin cytoskeletal remodeling (30, 31). The role of the raft integrity in the small GTPase activation by PLY was also confirmed in our cholesterol-depletion experiments by MβCD, where Rho and Rac activation was diminished. These experiments, however, also inhibited PLY membrane binding, which could be the prevailing factor that ameliorates the small GTPase activation. At this point, it is difficult to estimate whether the observed inhibitory effect is due to inhibited toxin binding, raft disruption, or both.
Similarly to streptolysin O (32), PLY was able to initiate rapid vesicle release shortly after cellular challenge. Initiation of vesicle release by latrotoxin in our experimental system reproduced stress fiber formation but not lamellipodia. Thus, it should be considered that RhoA activation by PLY might involve mediator (e.g., neurotransmitter) release by means of exocytosis and subsequently secondary effect via membrane receptors.
We limited our studies to neuronal cell types, because the central nervous system represents an establised niche for the invasion of S. pneumoniae. In neurons, small GTPases play essential role in dendritic spine morphology and synapse formation (33). Thus, PLY-induced RhoA and Rac activation might contribute to the long-term neurological sequelae after pneumococcal meningitis due to synaptic dysfunction.
Other representatives of the cholesterol-binding pore-forming toxin group, such as perfringolysin O, listeriolysin O, and streptolysin O, also cause serious pathologies, often associated with high morbidity and mortality. It has been shown that members of the CDC family can produce membrane-associated changes not immediately attributable to their pore-forming capacity: streptolysin O induces ceramide generation by neutral sphingomyelinase (34); aerolysin, which forms smaller pores than PLY, causes activation of the G protein Gi (35). Experiments with PLY, α-hemolysin, streptolysin O, and anthrolysin O in epithelial cells suggest an osmotic stress-mediated cell response caused by insertion of a sublethal number of pores into cell membranes (36), which is consistent with our findings. The subsequent stress kinase phosphorylation appears to be a conserved response shared among all these toxins. It would be interesting to test whether these toxins share the same mechanism of small GTPase activation.
Our work contributes to the current understanding of the mechanism of bacteria/host interactions. The small GTPase activation properties of PLY represent a unique feature of a toxin from the group of CDCs. These findings could be important for understanding the pathogenesis of pneumococcal infections and could provide new tools for the treatment of these conditions.
Materials and Methods
PLY Preparation.
Wild-type PLY was expressed in E. coli XL-1 cells (Stratagene, Cambridge, U.K.) in HySoy J medium (Sigma–Aldrich, Dorset, U.K.) and purified by hydrophobic interaction chromatography as described in ref. 37. Fractions that contained >98% pure PLY were pooled and dialyzed overnight. The concentrated sample was then further purified by anion exchange with Poros HQ20 Micron chromatography medium by using the BioCAD 700E workstation (Applied Biosystems, Warrington, U.K.) and introducing a 0–1 M NaCl gradient. The LPS content of purified toxin was determined by using the Limulus Amebocyte Lysate Kinetic-QCL Kit (Cambrex, Nottingham, U.K.), according to the manufacturer's instructions. All purified proteins had <0.6 endotoxin units/μg of protein. The purified toxin had an activity of ≈5 × 10⁴ hemolytic units/mg. One hemolytic unit was defined as the minimum amount of toxin needed to lyse >90% of 1.5 × 10⁸ human erythrocytes per ml within 1 h at 37°C.
Cell Cultures.
SH-SY5Y human neuroblastoma cells [American Type Culture Collection (ATCC), Manassas, VA] were cultured in RPMI medium 1640 (GIBCO/BRL, Carlsbad, CA) and supplemented with 10% FCS (PAN Biotech, Aidenbach, Germany) and 1% penicillin/streptomycin (GIBCO/BRL). During PLY treatment, cells were incubated in serum-free medium without prior serum starvation.
Culture Treatment.
Cells were treated with PLY at a final concentration of 0.1 μg/ml or 0.35 μg/ml in the live imaging experiments. Inhibitors were applied at the following final concentrations: 10 μM ROCK inhibitor Y27632 (Calbiochem, Schwalbach, Germany), 1 h before toxin treatment; 100 μM Rac1-specific inhibitor NSC23766, 16 h before PLY; 50 μM pancaspase inhibitor z-VAD-fmk (Calbiochem), 2 h before PLY; 40 μM SKF96365 (Calbiochem), 30 min before PLY; 2 μM bisindolylmaleimide I (Gö 6850) (Calbiochem), 30 min before PLY. α-Latrotoxin (Calbiochem) was applied at concentrations of 0.1 or 1 nM, and ionomycin (Calbiochem) was applied at concentrations of 5 and 10 μM. In some experiments, cells were treated in normal extracellular buffer [140 mM NaCl /2 mM KCl/2.5 mM CaCl2/1 mM MgCl2/10 mM Hepes/40 mM glucose (pH 7.3)] or in a nominally Ca2+-free buffer in which MgCl2 was substituted for CaCl2 without EGTA addition (19).
Cholesterol inactivation experiments were performed as described in ref. 22. Ethanol-dissolved cholesterol (Sigma–Aldrich) was mixed in PBS, because the final ethanol concentration in PBS did not exceed 0.5%. Subsequently, the PLY stock was thoroughly mixed with the PBS/cholesterol suspension and incubated for 15 min at 37°C. After the end of incubation, the samples were diluted in RPMI medium 1640 and added to cells.
MβCD (Sigma–Aldrich) was freshly dissolved in RPMI medium 1640. Cells were treated with 2 mM MβCD in serum-free medium for 15 min before PLY treatment, as described in ref. 38.
Immunofluorescent Staining.
After fixation in 4% paraformaldehyde in PBS (pH 7.3), cells were permeabilized with 0.1% Triton X-100 (Sigma–Aldrich) and blocked with 4% BSA (Sigma–Aldrich) in PBS. In some experiments, nuclei were stained with DAPI (Molecular Probes, Carlsbad, CA) (1:1,000) for 10 min before mounting in Mowiol (Aventis Pharma Deutschland, Bad Soden am Taunus, Germany). Actin staining was performed by using phalloidin-FITC (1:200; Sigma–Aldrich). Membrane cholesterol staining was performed after fixation by incubation with 100 μg/ml filipin. Cell membrane and endosomes/recycled vesicles were labeled with FM1-43FX (Molecular Probes) at a concentration of 10 μg/ml.
Confocal imaging was performed on a Leica (Mannheim, Germany) TCS SP2 AOBS system by using a ×63 oil-immersion objective.
Live Imaging Experiments.
Experiments were performed in Hepes-buffered phenol red-free and serum-free DMEM (GIBCO/BRL). Cell permeability was tested by using calcein (2 μg/ml; Molecular Probes) or the DiBAC4(3) membrane potential-sensitive dye (500 nM; Molecular Probes). Confocal imaging was performed by using a heated chamber system at 36°C, acquiring images at 30 s (calcein), or at 10 s intervals [using DiBAC4(3)] at an image resolution of 512 × 512 pixels and argon laser intensity at 1%. All images were acquired by using Leica Confocal software and were processed in ImageJ, version 1.33 for Mac OSX (National Institutes of Health, Bethesda, MD).
GTPase and GEF Activity Assays.
GTPase activity was evaluated by using Rho, Rac, and Cdc42 activity kits (Cytoskeleton, Denver, CO) according to the manufacturer's instructions. Lysates were incubated with GST-rhotekin polo-box domain (PBD) protein beads (for evaluation of Rho activity) or GST-PAK PBD protein beads (for evaluation of Rac and Cdc42 activity) for 1 h at 4°C under gentle rotation and washed subsequently. Pulled-down proteins were analyzed by using Western blotting. In suspension activation experiments, cells were homogenized in lysis buffer with detergent for Rac1 or without detergent for RhoA, and samples were clarified by centrifugation at 9,000 × g for 10 min and incubated for 15 min at 30°C before treatment with 200 nM PLY (10 μg/ml) or 200 nM guanosine 5′-[γ-thio]triphosphate (GTPγS) according to the manufacturer's instructions.
GEF activity of PLY was tested by using a GEF GTPase exchange assay kit (Cytoskeleton) according to the manufacturer's instructions and analyzed with a Tecan fluorescent multiplate reader (Tecan Trading, Baar, Switzerland) for 1,800 s.
Membrane Fractionation.
Total crude cell membranes were isolated as described in ref. 39. Cells were homogenized in 1 ml of buffer [10 mM Tris·HCl (pH 7.4)/1 mM EDTA/200 mM sucrose] (Sigma–Aldrich) and protease inhibitor mix (Roche Diagnostics, Mannheim, Germany)]. The nuclei and cellular debris were removed by centrifugation at 900 × g for 10 min at 4°C. The resulting supernatant was centrifuged at 110,000 × g for 75 min at 4°C. The crude membrane pellet was solubilized in buffer [10 mM Tris·HCl (pH 7.4)/1 mM EDTA/0.5% Triton X-100/protease inhibitor mix) for 30 min at 4°C. The detergent-insoluble fraction was separated by centrifugation at 14,000 × g for 10 min at 4°C.
Protein Biochemistry.
Equal amounts of protein samples were separated on a NuPAGE Novex 4–12% polyacrylamide Bistris gel (Invitrogen) and transferred onto PVDF membrane (Schleicher & Schüll, Dassel, Germany). Membranes were blocked with 5% skim milk and incubated for 1 h at room temperature with mouse anti-Rho (1:700), rabbit anti-Rac (1:500), sheep anti-Cdc42 antibody (1:500) (all from Cytoskeleton), or mouse anti-PLY (1:40) (Novocastra Laboratories, Newcastle Upon Tyne, U.K.). After incubation with horseradish peroxidase-conjugated goat anti-mouse, goat anti-rabbit, or rabbit anti-sheep antibody (Dianova, Hamburg, Germany), the product was visualized by using an ECL+ kit (GE Healthcare, Buckinghamshire, U.K.). Densitometric analysis of the bands was performed by using ImageJ software.
Toxicity Assays.
To assess toxicity, a lactate dehydrogenase detection kit (Roche Diagnostics) was used according to the manufacturer's instructions. In some cases, nuclear morphology was assessed by DAPI staining of the nuclei.
Statistical Analysis.
Data were analyzed by using Prism 3.0 (GraphPad, San Diego, CA).
Supplementary Material
Acknowledgments
This work was supported by the Deutsche Forschungsgemeinschaft Research Center for Molecular Physiology of the Brain (A.I.I. and F.S.W.). The European Neuroscience Institute Göttingen is jointly funded by the Göttingen University Medical School, the Max Planck Society, and the Schering Aktiengesellschaft. The work in Glasgow is supported by the Wellcome Trust, the Biotechnology and Biological Sciences Research Council, and the European Union.
Abbreviations
- CDC
cholesterol-dependent cytolysin
- CNF
cytotoxic necrotizing factor
- DiBAC4(3)
bis-(1,3-dibutylbarbituric acid)trimethine oxanol
- GEF
guanine nucleotide exchange factor
- MβCD
methyl-β-cyclodextrin
- PI
propidium iodide
- PLY
pneumolysin
- Rac1
Rac1 GTPase
- RhoA
RhoA GTPase
- ROCK
RhoA-associated kinase.
Footnotes
The authors declare no conflict of interest.
This article is a PNAS direct submission.
This article contains supporting information online at www.pnas.org/cgi/content/full/0608213104/DC1.
References
- 1.Schmidt H, Heimann B, Djukic M, Mazurek C, Fels C, Wallesch CW, Nau R. Brain. 2006;129:333–345. doi: 10.1093/brain/awh711. [DOI] [PubMed] [Google Scholar]
- 2.Palmer M. Toxicon. 2001;39:1681–1689. doi: 10.1016/s0041-0101(01)00155-6. [DOI] [PubMed] [Google Scholar]
- 3.Tilley SJ, Orlova EV, Gilbert RJ, Andrew PW, Saibil HR. Cell. 2005;121:247–256. doi: 10.1016/j.cell.2005.02.033. [DOI] [PubMed] [Google Scholar]
- 4.Wennerberg K, Der CJ. J Cell Sci. 2004;117:1301–1312. doi: 10.1242/jcs.01118. [DOI] [PubMed] [Google Scholar]
- 5.Fiorentini C, Falzano L, Travaglione S, Fabbri A. Cell Death Differ. 2003;10:147–152. doi: 10.1038/sj.cdd.4401151. [DOI] [PubMed] [Google Scholar]
- 6.Just I, Selzer J, von Eichel-Streiber C, Aktories K. J Clin Invest. 1995;95:1026–1031. doi: 10.1172/JCI117747. [DOI] [PMC free article] [PubMed] [Google Scholar]
- 7.Aktories K, Braun U, Rosener S, Just I, Hall A. Biochem Biophys Res Commun. 1989;158:209–213. doi: 10.1016/s0006-291x(89)80199-8. [DOI] [PubMed] [Google Scholar]
- 8.Popoff MR, Chaves-Olarte E, Lemichez E, von Eichel-Streiber C, Thelestam M, Chardin P, Cussac D, Antonny B, Chavrier P, Flatau G, et al. J Biol Chem. 1996;271:10217–10224. doi: 10.1074/jbc.271.17.10217. [DOI] [PubMed] [Google Scholar]
- 9.Fiorentini C, Fabbri A, Flatau G, Donelli G, Matarrese P, Lemichez E, Falzano L, Boquet P. J Biol Chem. 1997;272:19532–19537. doi: 10.1074/jbc.272.31.19532. [DOI] [PubMed] [Google Scholar]
- 10.Hoffmann C, Pop M, Leemhuis J, Schirmer J, Aktories K, Schmidt G. J Biol Chem. 2004;279:16026–16032. doi: 10.1074/jbc.M313556200. [DOI] [PubMed] [Google Scholar]
- 11.Lerm M, Schmidt G, Goehring UM, Schirmer J, Aktories K. J Biol Chem. 1999;274:28999–29004. doi: 10.1074/jbc.274.41.28999. [DOI] [PubMed] [Google Scholar]
- 12.Flatau G, Lemichez E, Gauthier M, Chardin P, Paris S, Fiorentini C, Boquet P. Nature. 1997;387:729–733. doi: 10.1038/42743. [DOI] [PubMed] [Google Scholar]
- 13.Baldwin MR, Barbieri JT. Curr Top Microbiol Immunol. 2005;291:147–166. doi: 10.1007/3-540-27511-8_8. [DOI] [PubMed] [Google Scholar]
- 14.Schlumberger MC, Hardt WD. Curr Top Microbiol Immunol. 2005;291:29–42. doi: 10.1007/3-540-27511-8_3. [DOI] [PubMed] [Google Scholar]
- 15.Bonnafous P, Stegmann T. J Biol Chem. 2000;275:6160–6166. doi: 10.1074/jbc.275.9.6160. [DOI] [PubMed] [Google Scholar]
- 16.Aspenstrom P, Fransson A, Saras J. Biochem J. 2004;377:327–337. doi: 10.1042/BJ20031041. [DOI] [PMC free article] [PubMed] [Google Scholar]
- 17.Sebbagh M, Renvoize C, Hamelin J, Riche N, Bertoglio J, Breard J. Nat Cell Biol. 2001;3:346–352. doi: 10.1038/35070019. [DOI] [PubMed] [Google Scholar]
- 18.Watanabe O, Torda M, Meldolesi J. Neuroscience. 1983;10:1011–1024. doi: 10.1016/0306-4522(83)90239-7. [DOI] [PubMed] [Google Scholar]
- 19.Stringaris AK, Geisenhainer J, Bergmann F, Balshusemann C, Lee U, Zysk G, Mitchell TJ, Keller BU, Kuhnt U, Gerber J, et al. Neurobiol Dis. 2002;11:355–368. doi: 10.1006/nbdi.2002.0561. [DOI] [PubMed] [Google Scholar]
- 20.Braun JS, Sublett JE, Freyer D, Mitchell TJ, Cleveland JL, Tuomanen EI, Weber JR. J Clin Invest. 2002;109:19–27. doi: 10.1172/JCI12035. [DOI] [PMC free article] [PubMed] [Google Scholar]
- 21.Price LS, Langeslag M, ten Klooster JP, Hordijk PL, Jalink K, Collard JG. J Biol Chem. 2003;278:39413–39421. doi: 10.1074/jbc.M302083200. [DOI] [PubMed] [Google Scholar]
- 22.Johnson MK, Geoffroy C, Alouf JE. Infect Immun. 1980;27:97–101. doi: 10.1128/iai.27.1.97-101.1980. [DOI] [PMC free article] [PubMed] [Google Scholar]
- 23.Waheed AA, Shimada Y, Heijnen HF, Nakamura M, Inomata M, Hayashi M, Iwashita S, Slot JW, Ohno-Iwashita Y. Proc Natl Acad Sci USA. 2001;98:4926–4931. doi: 10.1073/pnas.091090798. [DOI] [PMC free article] [PubMed] [Google Scholar]
- 24.Schmidt G, Sehr P, Wilm M, Selzer J, Mann M, Aktories K. Nature. 1997;387:725–729. [Google Scholar]
- 25.Masuda M, Betancourt L, Matsuzawa T, Kashimoto T, Takao T, Shimonishi Y, Horiguchi Y. EMBO J. 2000;19:521–530. doi: 10.1093/emboj/19.4.521. [DOI] [PMC free article] [PubMed] [Google Scholar]
- 26.Korchev YE, Bashford CL, Pasternak CA. J Membr Biol. 1992;127:195–203. doi: 10.1007/BF00231507. [DOI] [PubMed] [Google Scholar]
- 27.Kawamura S, Miyamoto S, Brown JH. J Biol Chem. 2003;278:31111–31117. doi: 10.1074/jbc.M300725200. [DOI] [PubMed] [Google Scholar]
- 28.Gekara NO, Weiss S. Biochem Soc Trans. 2004;32:712–714. doi: 10.1042/BST0320712. [DOI] [PubMed] [Google Scholar]
- 29.Mengaud J, Chenevert J, Geoffroy C, Gaillard JL, Cossart P. Infect Immun. 1987;55:3225–3227. doi: 10.1128/iai.55.12.3225-3227.1987. [DOI] [PMC free article] [PubMed] [Google Scholar]
- 30.del Pozo MA, Alderson NB, Kiosses WB, Chiang HH, Anderson RG, Schwartz MA. Science. 2004;303:839–842. doi: 10.1126/science.1092571. [DOI] [PubMed] [Google Scholar]
- 31.Lacalle RA, Mira E, Gomez-Mouton C, Jimenez-Baranda S, Martinez AC, Manes S. J Cell Biol. 2002;157:277–289. doi: 10.1083/jcb.200109031. [DOI] [PMC free article] [PubMed] [Google Scholar]
- 32.Howell TW, Gomperts BD. Biochim Biophys Acta. 1987;927:177–183. doi: 10.1016/0167-4889(87)90132-7. [DOI] [PubMed] [Google Scholar]
- 33.Tashiro A, Minden A, Yuste R. Cereb Cortex. 2000;10:927–938. doi: 10.1093/cercor/10.10.927. [DOI] [PubMed] [Google Scholar]
- 34.Walev I, Tappe D, Gulbins E, Bhakdi S. J Leukocyte Biol. 2000;68:865–872. [PubMed] [Google Scholar]
- 35.Krause KH, Fivaz M, Monod A, van der Goot FG. J Biol Chem. 1998;273:18122–18129. doi: 10.1074/jbc.273.29.18122. [DOI] [PubMed] [Google Scholar]
- 36.Ratner AJ, Hippe KR, Aguilar JL, Bender MH, Nelson AL, Weiser JN. J Biol Chem. 2006;281:12994–12998. doi: 10.1074/jbc.M511431200. [DOI] [PMC free article] [PubMed] [Google Scholar]
- 37.Mitchell TJ, Walker JA, Saunders FK, Andrew PW, Boulnois GJ. Biochim Biophys Acta. 1989;1007:67–72. doi: 10.1016/0167-4781(89)90131-0. [DOI] [PubMed] [Google Scholar]
- 38.Urano Y, Hayashi I, Isoo N, Reid PC, Shibasaki Y, Noguchi N, Tomita T, Iwatsubo T, Hamakubo T, Kodama T. J Lipid Res. 2005;46:904–912. doi: 10.1194/jlr.M400333-JLR200. [DOI] [PubMed] [Google Scholar]
- 39.Nagamatsu S, Kornhauser JM, Burant CF, Seino S, Mayo KE, Bell GI. J Biol Chem. 1992;267:467–472. [PubMed] [Google Scholar]
Associated Data
This section collects any data citations, data availability statements, or supplementary materials included in this article.