
Figure 3. Summary Percentile Statistics of NSAF-Based Ranks for Rpd3/Sin3 Subunits.
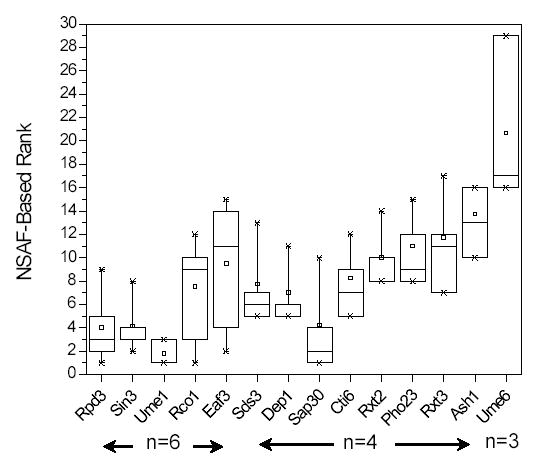
Specific proteins detected within a particular run were ranked based on their NSAF values calculated for each of the six analyses reported here (section 4.3, eq. 2). The distribution of these ranks for the 14 proteins belonging to Rpd3/Sin3 complexes was plotted as a box plot representation, where the 25th and 75th percentiles are represented by the upper and lower boundaries of the box, the median being the line dissecting the box, and the mean being the small square in each box. The 5th and 95th percentiles are shown with lines attached to the box, the ‘X’ represents the 1st and 99th percentiles, and the stand alone ‘–’ represents the complete range. The number (n) of runs in which each protein was detected is shown within arrows below the graph.