

Abstract
Structural genomics (or proteomics) activities are critically dependent on the availability of high-throughput structure determination methodology. Development of such methodology has been a particular challenge for NMR based structure determination because of the demands for isotopic labeling of proteins and the requirements for very long data acquisition times. We present here a methodology that gains efficiency from a focus on determination of backbone structures of proteins as opposed to full structures with all side chains in place. This focus is appropriate given the presumption that many protein structures in the future will be built using computational methods that start from representative fold family structures and replace as many as 70% of the side chains in the course of structure determination. The methodology we present is based primarily on residual dipolar couplings (RDCs), readily accessible NMR observables that constrain the orientation of backbone fragments irrespective of separation in space. A new software tool is described for the assembly of backbone fragments under RDC constraints and an application to a structural genomics target is presented. The target is an 8.7 kDa protein from Pyrococcus furiosus, PF1061, that was previously not well annotated, and had a nearest structurally characterized neighbor with only 33% sequence identity. The structure produced shows structural similarity to this sequence homologue, but also shows similarity to other proteins that suggests a functional role in sulfur transfer. Given the backbone structure and a possible functional link this should be an ideal target for development of modeling methods.
Keywords: NMR, partial alignment, pyrococcus furiosus, RDC, structure determination
Abbreviations: C12E5, Pentaethylene Glycol Monododecyl Ether; CTAB, Hexadecyltrimethylammonium bromide; DSS, 2,2-dimethyl-2-silapentane- 5-sulfonic acid DTT, dithiothreitol
Introduction
Recent interest in structural genomics (proteomics) has forced significant rethinking of accepted practice in protein structure determination methodology. This has been particularly important for NMR structure determination because traditional methods, based on NOE distance constraints, require both long periods of data acquisition and significant preparative effort in introducing NMR active nuclear isotopes 1. Both factors make it difficult to envision NMR contributing to a high-throughput structure determination activity. Recently we introduced a new concept, based largely on the use of residual dipolar couplings (RDCs) instead of NOEs, that offered the possibility of reduced labeling requirements, reduced data acquisition time, and streamlined analysis that integrated resonance assignment and structure determination steps 2. The concept was based on potential time savings associated with the production of backbone structures as opposed to structures containing both backbone and sidechain atoms. Production of just backbone structures melds well with one of the primary tenants of the structural genomics initiative. In particular, the initiative envisions coverage of “fold space” by solving representative structures in something on the order of 7000 different fold families 3; 4. Computational methods are then anticipated to provide structures for many new proteins using their specific sequences and representative structures as starting points. Since sequence deviation within fold families can be up to 70%, most sidechains in the representative structure will be replaced in the course of computational modeling, making backbone atom positions of primary importance 5; 6. Here, we describe a new efficient protocol for backbone structure determination, and apply that protocol to a significant target in a structural genomics effort 7.
The protocol begins with production of proteins with high levels of 15H labeling, but low levels of 13C labeling. These isotopes, in combination with the 100% naturally abundant 1H can provide a variety of bonded nuclear pairs with measurable RDCs (1H-15H, 1H-1H, 1H-13C and 15H-13C). 15H labeling through expression of protein targets in Escherichia coli grown on minimal media is inexpensive compared to the cost of uniform labeling at high levels of 13C. Use of a mixture of C1-13C-glucose and C2-13C-glucose to provide a 15-20% 13C labeled sample reduces cost somewhat in comparison to use of uniformly and highly enriched glucose, and does so without debilitating losses in sensitivity. More importantly, methodology based on less than 90% 13C labeling sets a useful precedent for work with expression systems in which high levels of 13C labeling are more difficult to achieve. The samples are subsequently prepared in one or more field orientable liquid crystal media to induce partial orientation of the protein needed to give finite residual dipolar couplings.
Acquisition of RDC data is based on just three core experiments and two supplemental experiments. A coupled 15H-1H HSQC returns 15H-1H residual dipolar couplings. An E.COSY HNCA experiment 2 returns three types of RDCs ( 1HN-1HCαi, 1HN-1HCαi-1, 1Hα-13Cα), plus a 3JHN-Hα scalar coupling. It also establishes residue connectivity through Cα chemical shift correlations between i and i-1 residues. Finally, a coupled HNCO experiment provides two additional types of couplings (1HN-13CO, 13CO-15H) 2. Supplementary NOESY-HSQC and TOCSY-HSQC experiments provide a limited number of long-range backbone NOEs important for fixing translational degrees of freedom. They also provide some help with sequential assignment. Data acquisition time of a little over one week is shown to be accessible. This is about one third the time used in conventional NMR approaches.
The structure determination program developed here adopts the integral assignment and structure determination characteristics of our earlier proof-of-principle application 2, but it is highly automated, is more tolerant of errors in experimental data, and produces structures more efficiently. Initially, the program generates fragments of just two peptide planes connected by a Cα carbon with variable φ and ψ angles, collects RDC data for these fragments, and solves for order matrix elements using singular value decomposition. Scoring of fragment geometries is based on agreement with back-calculated RDCs, agreement with allowed Ramachandran space, agreement with estimated principal order parameters, and agreement with scalar coupling values. Two peptide fragments of acceptable geometry are selected and combined based on consistency with sequential connectivity through Cα shifts, new order tensor solutions are found for the extended fragment, new combined geometries are scored, and the process is repeated.
Once fragments are extended to five or more amino acids we find that they can be placed in the protein sequence utilizing limited Cα chemical shift and a recently reported program named SEASCAPE 8, or they can be manually placed in sequence using additional data from TOSCY experiments. Finally, extended fragments of well-defined local structure are oriented using coincidence of alignment axes found for two different alignment media, and translated to satisfy chemical connectivity and limited backbone-backbone NOE data. Missing loops are added and the final structure is refined with the program XPLOR-NIH 9.
The target of application presented here is an 8.7 kDa protein selected from the genome of Pyrococcus furiosus. Protein targets from this genome were initially selected based on their lack of significant sequence identity (less than 30%) with structures already in the protein data bank (PDB, www.rcsb.org) 10. This particular target (PF1061) initially showed less than 20% identity (over > 60 amino acids), but subsequent to selection, a structure of a protein with 33% identity was deposited (1JSB/1RYJ). This level of sequence identity puts PF1061 at the limit where production of a reasonable structure by homology modeling might be expected. Both proteins were also annotated simply as conserved hypothetical proteins, offering the possibility of either producing a novel structure or improving functional definition by making a structural link to a better defined protein. Structure determination did prove successful and comparison of the new structure to the closest sequence homologue, 1JSB/1RYJ, showed the expected level of structural agreement (< 3.3Å rmsd of structured backbone atoms). Both can be described as mixed α/β proteins with a ubiquitin-like roll. Of more interest is a strong structural similarity to functionally characterized proteins, suggesting that this protein may play a role in sulfur transfer in the synthesis of molybdopterin cofactors or thiamine.
Software Development
The reason that residual dipolar couplings (RDCs) are so well suited to backbone structure determination is that they are capable of providing orientational constraints as opposed to distance constraints. While NOEs are generally very useful in structure determination, distance constraints derived from NOEs are very short range, and atoms in non-sequential segments of protein backbones seldom come within distances appropriate for NOE observation. Orientational constraints, on the other hand, have no distance limitations and can effectively constrain remote sections of protein backbones no matter what their separation. The utility of RDCs in protein structure determination was recognized nearly a decade ago 11;12, and several applications to rapid protein structure determination have evolved since that time 2; 13; 14; 15. However, demonstration that RDC analysis can be the basis of an efficient structure determination protocol requires a significant effort in software development.
Residual dipolar couplings arise from the interaction of two magnetically active nuclei in the presence of an external magnetic field 16;17. Equation 1 describes the average angular dependence of the RDC.
| Eq. 1 |
Dij is the observed residual dipolar coupling in Hz between the nuclei i and j, γij are nuclear magnetogyric ratios, μo is the permittvity of free space, h is Planck’s constant, r is the inter-nuclear distance and θ(t) is the time dependent angle of the inter-nuclear vector with respect to the external magnetic field. When nuclei are directly bonded, r is fixed and the primary variable is the angle, θ. The brackets around the angular function signify the time average of the quantity. Normally, the random, isotropic sampling of angles by a molecule tumbling in solution reduces RDCs to zero. This isotropic sampling may be made anisotropic by a magnetically induced alignment or with the aid of various types of liquid crystalline media 18. This anisotropic sampling will result in a measurable RDC quantity that is indicative of the average orientation of an inter-nuclear vector.
The dipolar couplings can also be written in terms of elements of an order matrix, skl, which contains orientation and order information for a molecular fragment, and direction cosines relating various vectors in a rigid fragment to an arbitrarily chosen fragment frame.
| Eq. 2 |
Given a trial fragment geometry, analysis of a set of equations in the form of equation 2 for a collection of RDCs allows evaluation of all order matrix elements. These elements can then be used to assess the correctness of the hypothesized geometry by back-calculating RDCs using equation 2 and comparing calculated to experimental values. This is the computational basis of the program developed here.
The program, named REDcRAFT for residual dipolar coupling based residue assembly and filter tool, analyzes RDC data in two separate stages; namely a short-range and a long-range stage. The first stage generates coordinates for dipolar interaction vectors contained in a fragment composed of just two peptide planes connected by variable angles φ, ψ. In our implementation this is done for all φ and ψ angles using a 10º step size spanning 0º–360º. RDC data for each pair are collected, equation 2 is solved, and RDCs are back calculated. The program produces a list of possible geometries for sequential pairs of peptide planes (in terms of φ, ψ angles) ranked in the order of best to worst based on a comparison of back-calculated RDC data to experimental RDC. Subjecting all possible combinations of (φ, ψ) angles to a Ramachandran filter creates the initial list for this procedure. The current implementation only accommodates two types of residues, either Glycine or Alanine (anything that is not Glycine). Glycines are allowed to assume all possible geometries, whereas a limited set of torsion angles is allowed for Alanines based on a user selectable level of geometry preference. Although the allowed Ramachandran space is much more restricted for Proline than for Alanine, the current version of this program does not take advantage of this difference.
The list of possible torsion angles is further filtered based on the experimentally collected scalar coupling data (J-Filter). This filter utilizes the Karplus relation for 3JHNHα to eliminate geometries that are in severe conflict with the experimentally collected scalar couplings. This equation is used in a slightly different fashion in the case of Glycines. Since it is difficult to measure and assign the individual scalar couplings for the two Hαs of Glycines, we utilize the sum of scalar couplings. In both cases conformations are eliminated based on back-calculated values deviating more than twice the estimated error in scalar coupling measurements.
In the second stage, dipeptide planes are assembled to produce a longer fragment. Selection of pairs of dipeptides to be connected proceeds primarily based on overlap of inter-residue Cα chemical shifts seen for fragment i with the intra-residue Cα shifts seen for fragment i-1, but this connectivity is supplemented by requiring a match of 13Cα-1Hα splittings as well. In principle, each entry in the allowed φ, ψ list for one peptide could be combined with each entry in the allowed φ, ψ list for the second peptide. The coordinates for each combined geometry could be generated, new order matrices and back-calculated RDCs could be computed, and each new geometry ranked. The process would then be repeated for the next dipeptide extension. Scoring geometries for combined dipeptide fragments in this way can grow into a computationally intensive task. We therefore perform a restricted search at each step based on the ranking within the list. This strategy has enabled the attainment of structures in real time (less than a day in most cases). The depth of search can be selected by the user as a fixed depth or an rmsd cutoff. Each one of these two approaches has its advantages and disadvantages. A fixed depth will result in a fixed execution time. This is useful if an answer is required within a predetermined amount of time. On the other hand an rmsd cut-off may allow the search to proceed over a more relevant list of possible torsion angles.
Materials and Methods
Protein Cloning, Expression and Purification
All standard molecular biology was performed as described 33. Reagents were obtained from either Sigma Chemical (St. Louis, MO) or USB (Cleveland, OH). PF1061 was subcloned into the BamHI and NotI restriction sites of a modified pET-24 vector containing an N-terminal His-tag and kanamycin (Kan) resistance (Novagen, Madison, WI). The sequence of the tagged, recombinant protein is: (M)AHHHHHHGSKMIKVKVIGRNIEKEIEWREGMKVRDILRAVGFNTESAIAKVNGKVVLEDDEVKDGDFVEVIPVVSGG
The presence of an Alanine in the second position results in removal of the N-terminal Methionine by the endogenous methionine aminopeptidase of E. coli. The plasmid was transformed into E. coli BL21(DE3) supplemented with the pRIL plasmid (Strategene, LaJolla, CA) for rare codon usage and plated onto LB/kanamycin (50 μg/mL) plates overnight. Five colonies were used to inoculate 30 mL of M9 minimal medium supplemented with Kan (50 μg/mL), vitamins and trace metals (Sambrook and Russell, 2001), which was incubated overnight at 37 ºC. 10 mL of this culture was then used to inoculate 500 mL of media that was incubated with shaking at 200 rpm at 37 ºC for about 6 hours before the inducer isopropyl-β-D-thiogalactopyranoside (IPTG) was added to a final concentration of 0.4 mM. The temperature was then lowered to 18 ºC, the cells were incubated overnight with shaking, and then harvested by centrifugation. Isotopically-labeled protein was expressed using uniformly labeled 15H ammonium chloride (1 g/L) and a 1:1 ratio of 13C-1 and 13C-2 labeled glucose (2 g/L) as the nitrogen and carbon sources. Cells were harvested by centrifugation and resuspended in 30 mL of start/lysis buffer (50 mM sodium phosphate, 500 mM NaCl, 10 mM imidazole, pH 7.0 and frozen at −20 ºC. After thawing, phenylmethylsulfonyl fluoride (PMSF, 1 mM), DNAse (0.1 mg/mL) and lysozyme (0.1 mg/mL) were added and the cells incubated at 37 ºC for one hour before sonication (5 minutes on ice). The cellular debris was removed by centrifugation (20,000 x g for 20 min) and the supernatant containing the recombinant protein was saved.
The protein was purified using NiNTA affinity chromatography (Novagen). A column with a 3 mL bed volume of NiNTA superflow media (Qiagen, Valencia, CA) was equilibrated in start/lysis buffer. Protein was eluted from the column with the same buffer containing 300 mM imidazole and concentrated to 1.5 mL. A heat shock (70 ºC, 5 min) was used to precipitate contaminating E. coli proteins. The precipitate was removed in a micro-centrifuge (15,800 x g, 10 min) and the supernatant was loaded onto a Superdex 30 16/60 gel filtration column (Amersham Biosciences, Piscataway, NJ) equilibrated with 50 mM K Phosphate, 100 mM NaCl, 2 mM dithipthreitol (DTT), pH 8.0. The eluted protein was pooled and concentrated to about 25 mg/ml (3 mM). The final yield was typically 10 mg protein per liter of culture.
NMR Sample Preparation, including Alignment
An isotropic sample of 1mM 16% 13C/u-15H PF1061was prepared in a buffer containing 50 mM potassium phosphate and 200 mM KCl at pH 5.5. All samples also contained 2 mM DTT, 1 mM DSS and 10% D2O. After isotropic data collection, this sample was used to prepare two aligned samples. A sample with C12E5 bicelles as the alignment medium was prepared to be 0.5 mM PF1061 in 50 mM potassium phosphate and 100 mM KCl at pH 6.0. The 4.26% (w/v) bicelle medium composed of C12E5/hexanol at a 0.98 molar ratio was allowed to equilibrate at room temperature overnight at which point it showed a deuterium splitting of 8.7 Hz. A second aligned sample was prepared to be 4% (w/v) C12E5/hexanol at a molar ratio of 0.87, doped with CTAB at a C12E5:CTAB ratio of 27:1. This sample gave a 13.0 Hz 2H splitting after equilibration. An isotropic sample containing 3 mM 15H labeled PF1061 was also prepared and used for the 15H-edited experiments.
NMR Data Collection, Processing and Analysis
NMR data were collected on a Varian UnityInova 600 MHz spectrometer using a conventional z-gradient triple resonance probe or a z-gradient triple resonance cryogenic probe, or on an Inova 800 MHz spectrometer using a conventional z-gradient triple resonance probe (Varian Inc., Palo Alto, CA). Isotropic data were collected at 298K, C12E5 data were collected at 300K and C12E5/CTAB data were collected at 293K.
Three experiments were run using the cryogenic probe for measurement of residual dipolar couplings: a soft HNCA-E.COSY 34, modified HNCO 2 and 15H coupled HSQC. Data were acquired for the isotropic and the C12E5 bicelle sample using all three experiments to provide a complete set of residual dipolar couplings. The HNCA-E.COSY and 15H coupled HSQC were collected on the C12E5/CTAB sample to provide a partial data set for a second alignment medium. Data collection for the soft HNCA-E.COSY included 96 t1 points, 20 t2 points and 2048 t3 points over 37 h. Data collection for the modified HNCO included 256 t1 points, and 2048 t2 points over 16 h. Data collection for the 15H coupled HSQC included 512 t1 points, and 2048 t2 points over 2 h. Residual dipolar couplings were calculated as the difference of the coupling measured in the aligned and isotropic conditions.
In addition, an 15H-edited NOESY and 15H-edited TOCSY data sets were collected on the isotropic 15H sample using the standard probe. The two 3-D 15H experiments were collected with 32 t1 points, 16 t2 points and 2048 t3 points over 16 h. NOEs involving HN-Hα and HN-HN connections were identified for use in energy minimization (see below).
NMR Data Processing
The soft HNCA-E.COSY, modified HNCO and 15H coupled HSQC were processed using NMRPipe 35 and visualized using NMRDraw. Peaks were picked using the automatic picking procedure in NMRDraw. Arbitrary assignments were automatically transferred in from the HSQC and the splittings (J or J+D) calculated using a series of tcl scripts modified from NMRDraw. Intra- and inter-residue designations were automatically assigned for the E.COSY-HNCA based on the isotropic 3JHNHα value (zero for inter-residue). Text files containing chemical shifts and splittings were inserted into a mySQL database. A table of RDCs was generated from the difference between splittings in aligned and isotropic datasets. From this point on, all data were stored in and accessed from the database, which ensures data integrity, provides a means of data sharing, and allows for rapid software development.
Fragment structure determination (REDcRAFT)
The main analysis of the RDC data was conducted by the use of an in-house developed program named REDcRAFT (REsidual Dipolar coupling based Residue Assembly and Filter Tool). This program was developed specifically for the task of structure determination based on orientational information from RDCs. This program, written in C++, was installed on both desktop computers and a 64 node LINUX cluster, each node having dual Pentium 3 processors. RDC data for fragments were assembled into formatted input files, with the assistance of PERL and Tcl scripts. Computational time required for Production of the dipeptide lists is very insignificant and the procedure was therefore implemented on a single CPU machine. This procedure requires less than 5 minutes for a protein of size 60 residues. Runtimes for final fragments of varying lengths were presented in Table 1.
The time required for each fragment depended greatly on the length of fragment and the depth of search into dipeptide and fragment ranked geometry lists. We attempted to assemble fragments at least 5 peptide planes in length; the longest fragment was 18 residues. In terms of search depth, we used the fixed depth option. A typical search depth of 1000 was used with search depths of up to 10000 examined for more problematic fragments.
The above fragment structure determination process was also applied to several possible assembled sets of planes because connection based on Cα overlap was ambiguous. When several possibilities for extension exist, each possibility must be examined. In a number of instances only one assembly gave an acceptable RMSD between experimental and back-calculated data. The process aided in identifying proper sequential assemblies. The process terminated when ambiguities could not be resolved or no suitable extension could be found. Fragments could normally be extended beyond one or two residues with completely missing data (such as Prolines). However this was done only if the segment with missing data was proceeded by a segment with a near complete set of data.
Fragment validation, assembly and refinement
The principal order parameters obtained from the analysis of the correct rigid fragment structures should approximate the same principle order parameters obtained from analysis of the distribution of all observed couplings 16; 36; 37. The program REDCAT 19 was used to determine principal order parameters and Euler angles that relate the initial coordinate frames to the principal alignment frames for each final fragment. This information was used to validate the structure of the final fragments. A threshold for agreement was set to ±10 % and ±20 % for the z and x/y order parameters respectively. All but the C-terminal fragment met this condition. Fragments that demonstrate different order parameters from the rest of the molecule, or from the order parameters estimated from a histogram of all RDCs, can be accepted if there is experimental data to support flexibility of that region such as the presence of rapid amide exchange or anomalous spin relaxation data. This was the case for the C-terminal fragment where amide exchange data exhibited anomalously high rates for several residues in the terminus. The final result of the entire process produced structures that are in agreement with Ramachandran space, observed J coupling and RDC data and estimated magnitudes of order parameters.
REDCAT Euler angles, and a rotate PDB function in REDCAT were used to produce principal alignment frame coordinates for the various PF1061 fragments. These fragments were loaded into the molecular graphics program, Chimera 38 (http://www.cgl.ucsf.edu/chimera), and the fragments were translated manually to satisfy a small set of inter-fragment NOEs and covalent end-to-end connections. Connections between fragments were made adding missing residues and connecting bonds using utilities in the program MolMol 21. This procedure produced an unrefined structure of the complete protein.
Structure refinement
The bonds created in MolMol were not of ideal lengths and the backbone dihedral angles for the connecting residues were chosen arbitrarily. In addition, REDcRAFT in its current application does not correct for bad Van der Waal’s contacts between atoms. XPLOR-NIH 9 was used to correct these issues and produce a minimized structure that satisfied all the geometrical and orientational restraints.
RDC restraints were included as both SANI (directly bonded) and XDIP (non-bonded) terms, and were scaled by a factor of the maximum RDC for that atom pair divided by the cube of the bond length. The bond length denominator was not included for the non-bonded terms. The errors associated with the measured RDC values were scaled in the same way. The scaled RDC terms were used to calculate the coefficients Da and Rh, according to 39; these values were −8.2832 and −0.32, respectively. The force constants used for the RDC terms were taken from the square of the ratio of the scaled errors with respect to the 1HN-15H value. For example, a 1HN-15H error of 4Hz and a 1Hα-13Cα error of 2Hz would give in a 1Hα-13Cα force constant of (4/2)2 = 4, with respect to the force constant of 1 for 1HN-15H. This would result in the 1Hα-13Cα RDC value being weighted 4x more strongly than the 1HN-15H RDC value. The force constants determined in this manner were: 13CO-15H = 0.063; 1HN-13CO= 0.50; 1HN-1HCα (non-bonded intra- and inter-residue) = 177. Note that the value for 1HN-13CO= 0.50 is higher than the value of 0.18 calculated using the above method; the calculated value proved to be too low and resulted in a lack of agreement of the structures with the RDC data. Final force constants of 50 for NOE terms, 200 for dihedral terms, and 4 for VdW terms were also used.
The refinement procedure began with 50 steps of Powell minimization of the entire protein with a small Van der Waal’s force constant (0.002) to allow atoms to move through each other. This was followed by a round of simulated annealing during which only the atomic positions for the connecting residues and the two residues immediately preceding and following them were allowed to change (5 residues total per gap). The simulated annealing stage consisted of 8 cycles of 2.23 ps each as the temperature of the system was cooled from 100K to 20 K with 10K increments. During this time, the force constants of the RDC, NOE and VdW terms were slowly increased from 0.01, 2.0 and 0.003, respectively, to their final values. Force constants for dihedral terms remained at 200 during the cooling stage. The final stage of refinement consisted of 30000 steps of Powell minimization to allow the system to converge.
In all, 20 structures were calculated. Each was examined for agreement with the RDC data using REDCAT 19 and for Ramachandran quality and peptide planarity using Procheck on the RCSB ADIT server (http://deposit.pdb.org/validate). The structure which best fit these criteria was chosen as the final structure.
Results
Representative E.COSY HNCA data are shown in Figure 1 for both isotropic and aligned conditions. These spectra provide 1Hα-13Cα dipolar couplings, 1HN-1Hα intra-residue dipolar couplings, 1HN-1Hα inter-residue dipolar couplings, and 1HN-1Hα intra residue scalar couplings. They also allow connection of residues into fragments by comparing 13Cα chemical shifts and 1Hα-13Cα dipolar couplings for inter- and intra-residue peaks. Ambiguities in connections that normally arise from 13Cα shift degeneracy in using HNCA data for residue connectivity is reduced by matching the 1Hα-13Cα splittings (under multiple alignment conditions). Distinction of intra- and inter-residue multiplets is also aided by recognizing that there should be no significant 1HN-1Hα coupling for the inter-residue peak in the isotropic spectrum (a four-bond coupling). Extraction of couplings and collection of residues into fragments was initially accomplished using in-house software that stores data in a searchable database (see methods). During this automated step of assembling fragments a generous chemical shift cutoff of 0.2 ppm in 13C was used to avoid eliminating the correct connection in cases of spectral overlap or peak distortion. Approximately thirteen short, unambiguous, fragments were generated in this way and used as starting points for further analysis. These fragments ended with ambiguous extensions that were examined in terms of consistency with residual dipolar coupling data.
Figure 1.
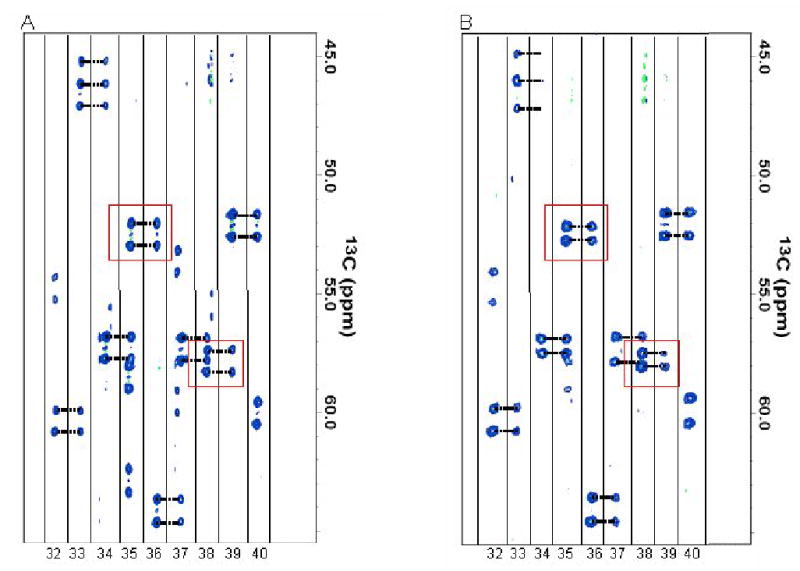
E.COSY HNCA spectra for PF1061 under (a) isotropic and (b) C12E5 aligned conditions. Boxed peaks show the change in coupling upon alignment, which was used to measure RDCs as well as to connect fragments. The samples were prepared as described in the NMR Sample Preparation section of Materials and Methods.
The initial fragments were confirmed and extended by manual inspection of the HNCA data. In addition, 15H-edited NOESY data were used on a limited basis to confirm some sequential connectivities when 13Cα chemical shifts were ambiguous. Several of the longer fragments were structurally characterized using RDC data at this point (see below). Having the local φ and ψ angle geometry defined enhances the value of Cα chemical shifts in identifying amino acid types and placing fragments into the protein sequence. An automated program (SEASCAPE) 8 was used to identify best placements for these fragments. In addition, data from 15H edited TOCSY experiments were used to confirm amino acid types and extend several segments once an appropriate placement in the sequence was deduced. In this manner, we generated five fragments, described in Table 1, which ranged in length from 5 to 18 amino acids. Each fragment contained at least one Glycine, which made a definitive sequential assignment relatively straightforward. Fragment 2, a 16-mer, had 2 Glycine residues separated by 10 amino acids, and could only be assigned to residues 21–36. The shortest fragment, a 5-mer, ended in Gly-Gly, and corresponded to the C-terminal residues 73–77. Correct placement of the other three fragments was easily confirmed based on the positions of the Glycines and other characteristic chemical shifts such as those for Val, Ile and Leu.
Additional RDCs were collected from coupled HSQC spectra (1H-15H couplings) and ECOSY-HNCO spectra (1H-13CO and 15H-13CO couplings) to complement the structural data from the ECOSY-HNCA experiment. These were measured and collected in a central database in a manner analogous to that described for couplings coming from the ECOSY-HNCA experiment. In all, 68 1H-15H dipolar couplings, 69 1H-13CO dipolar couplings, 69 15H-13CO dipolar couplings, 59 1Hα-13Cα dipolar couplings, 59 1HN-1Hα intra-residue dipolar couplings, 56 1HN-1Hα inter-residue dipolar couplings, and 59 1HN-1Hα intra-residue scalar couplings were collected. This amounts to an average of 5.5 residual dipolar couplings per amino acid residue. All couplings have been deposited with the BMRB along with residue specific chemical shift values for the backbone atoms (deposition # 6187).
Fragment geometry
Determination of the local geometry of various fragments proceeded in parallel with the sequential placement and extension of fragments described above. The five fragments as shown in Table 1 were analyzed in their entirety. All of the geometric analyses were conducted using the program called REDcRAFT. The philosophy behind this program was described briefly in the introduction and details will be reported more fully in a separate publication. The output is a ranked list of possible sets of φ and ψ angles for each fragment. The computational times required to reach a structure for each of the fragments are shown below. The top scoring set for each fragment has been converted to a PDB file, representing amino acids as either Alanine or Glycine as appropriate for their sequential placement. It is possible to make fragment-by-fragment comparisons of these structures to the corresponding fragments found in the closest sequential homologue (1RYJ, 33% sequence identity) by overlaying fragments for the best RMSD of backbone atom coordinates. Figures 2 and 3 show fragments 3 and 1 (respectively) superimposed on the corresponding fragments from 1RYJ. Figure 2 illustrates a hairpin fragment that exhibits a high degree of backbone correlation to that of the homologue. Figure 3 illustrates a region that shows more substantial divergence. RMSD values for all fragments are included in Table 1.
Figure 2.
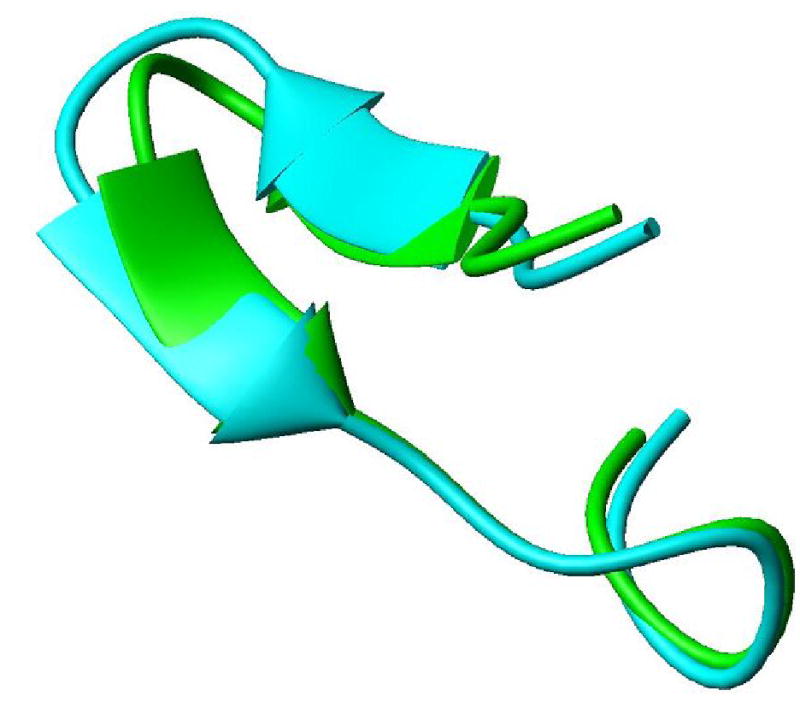
Structural overlay of fragment 3 with the appropriate section of the structure modeled from 1JSB with backbone rmsd of 0.82 Å. This fragment is a direct outcome of REDcRAFT before any minimization. This structure exhibits the hair-pin like structure very well.
Figure 3.
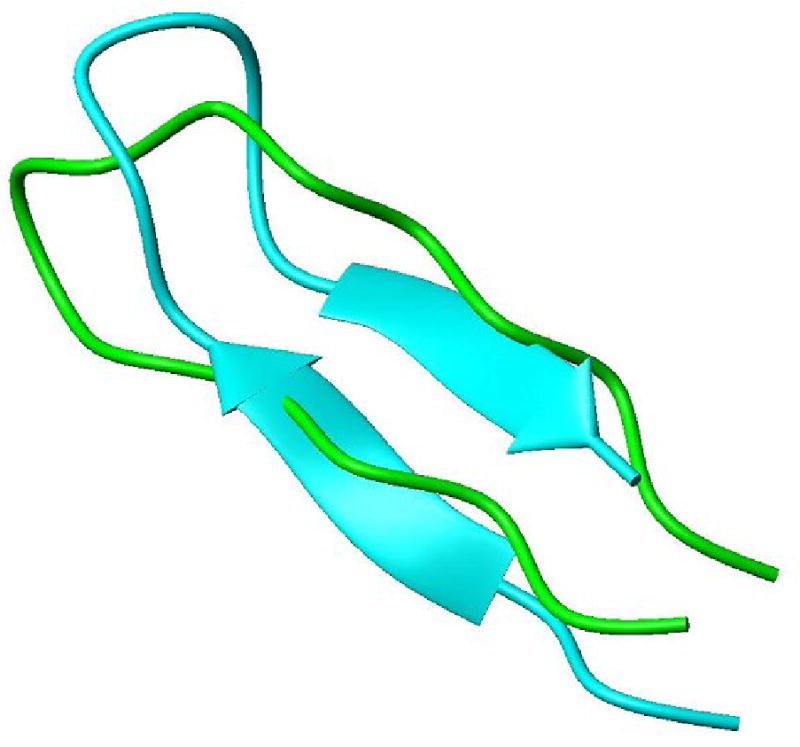
Structural overlay of fragment 1 with the appropriate section of the structure modeled from 1JSB win backbone rmsd of 3.4 Å. This fragment is a direct outcome of REDcRAFT before any minimization. Although the dihedral angles of each strand correspond to that of a β strand, the relative orientation of the two strands is not recognized as a β sheet in MolMol.
Fragment assembly
Fragments described above carry with them inherent information about their preferred orientation in space. This is contained in the order tensors produced by REDcRAFT in the process of solving sets of equations describing dipolar couplings for each trial geometry of fragments (Equation 2). Equivalently, an order tensor can be produced for the final fragment using the analysis tool, REDCAT 19. This tool can also rotate the PDB coordinate file for each fragment into a principal alignment frame using Euler angles that result from diagonalizing the initial order tensor. Since all fragments of a rigid protein must share an alignment frame, displaying fragments in their principal alignment frames will in principle show their relative orientations. There is one caveat; alignment frames have a four-fold degeneracy corresponding to rotation of the initial frame by 180° about any single axis. The resulting degeneracy in fragment orientations needs to be removed. In cases where there is a small number of amino acids separating fragment ends degeneracies can often be eliminated by considering allowed covalent connections. There is however, a more general approach using data from two or more alignment media 20. In our case we have sufficient data from C12E5 media with and without the positively charged amphiphile, CTAB. Figure 4 illustrates the procedure with fragments 2 and 3. The top line shows the initial principal frame orientation for fragment 2 along with the four degenerate orientations for fragment 3 as determined in one medium (C12E5). The bottom line shows the fragment orientation for fragment 2 along with the four degenerate orientations for fragment 3 as determined in a second medium (C12E5-CTAB), except that all have been rotated so that the orientations of fragment 2 coincide for the two media. Note that there is only one case in each line where the orientation of the alternate views of fragment 3 coincide (state 1 of the upper line and state 1 of the lower line). This effectively fixes the true relative orientation, and removes the degeneracy problem. All other relative fragment orientations were defined in a similar way.
Figure 4.

Resolving orientational ambiguities using two media. (A) possible relative orientations for a helix and hairpin fragment using C12E5-CTAB as a medium. (B) possible relative orientations for the same helix and hairpin fragments using C12E5 as a medium. All structures in (B) have been rotated to superimpose helix orientations. Only the relative orientation shown as the first hairpin structure is seen in both media.
Theoretically, the magnitudes of principle order parameters for each fragment must also agree if they are a part of a single rigid entity. This can be a useful additional basis for selection of fragment geometries once order parameters for several segments are known. However, there are circumstances in which the calculated principle order parameters do not agree, even when fragment geometries are approximately correct. One prime example occurs when there is substantial internal motion and one fragment moves relative to the others. This normally forces an overall reduction in the magnitude of the principle order parameters reported by that particular fragment. In our case, with the exception of one fragment, the order parameters reported from all of the fragments are similar (−1.85e-4 ± 0.1e-4, −4.26e-4 ± 0.64e-4 and 6.1e-4 ± 0.9e-4). The exception was the C-terminal fragment. It had order parameters of −7.65e-5, −2.18e-4 and +2.95e-4. The nearly 50% reduction in the order parameters indicates a substantial degree of motion at the C-terminus. If motion is approximated as the C-terminus wobbling in a cone, geometry and average orientation relative to the rest of the fragments would still be relevant, but the amplitude of wobble would be substantial (approximately ± 50º). Although we include a structure for the C-terminus in what follows, the structure must be interpreted with caution.
The final structure was assembled by translation of oriented fragments to satisfy a set of 12 inter-fragment HN-HN and HN-HA NOEs. These have been deposited along with the RDC data to the BMRB (deposition # 6187). Fragments were connected by simply bonding or adding missing residues between fragment ends using a utility in MolMol 21. The final structure was refined with minimization and mild simulated annealing of connecting loops using the program XPLOR-NIH 9. The structure is shown in Figure 5.
Figure 5.
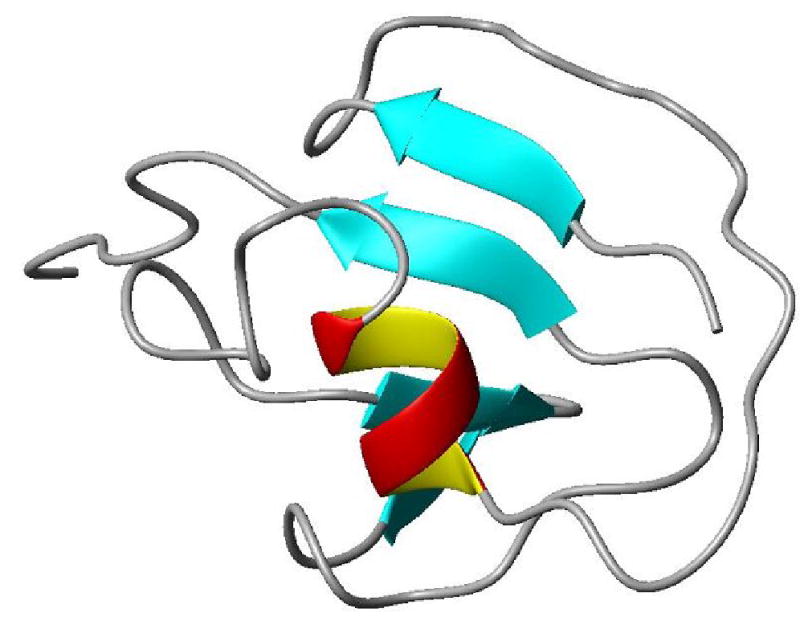
Final structure of PF1061. The structure was produced with the MolMol program. The mixed α/β character is apparent as is the C-terminal tail which exhibits substantial internal motion.
Discussion
The structure produced for PF1061 can be classified using protein structure classification schemes such as CATH22. Using the GRATH server for this database, PF1061 has classification 3.10.20. It can be described as a mixed α/β protein with a ubiquitin-like roll. Thus, despite a significant divergence in sequence from the nearest structurally defined proteins (33% identity), the protein is found to belong to a well-populated fold class.
Visually, the structure of PF1061 bears a striking similarity to that of 1JSB/1RYJ, the homologue identified based on sequence identity and threading programs early in our studies. The rmsd for backbone atoms between our structure and 1RYJ is 3.4Å over a central segment that excludes the first residue and the C-terminal mobile segment (2–63). If a subset of 44 residues in regions conserved in the top threading targets (1F0Z, 1FMA) found using a current version of mGenThreader23, 15–38 plus 49–64, is used, the rmsd to 1RYJ is 2.5Å. Models can be built using alignments with 1JSB/1RYJ generated by threading programs such as PROSPECT 24 and a complete structure generated using programs such as MODELLER 25. A structure produced from 1JSB in this way shows a slight improvement for both the central segment and conserved segments, 3.2 and 2.4Å RMSD respectively. This level of agreement between experimental and modeled structures is within expected accuracy for threading approaches beginning with a template having 30% sequence identity. Thus, the structure does confirm a suspected similarity to 1JSB/1RYJ and adds confidence to a structure produced by a new NMR structure determination approach.
Our heavy reliance on new methodology makes it difficult to attach absolute measures of accuracy to our structure. Families of structures satisfying constraints are difficult to generate by the usual simulated annealing protocols because these protocols do not converge well in the absence of large numbers of translational constraints. We can, however, calculate a quality factor for our structure 26. Using all RDC constraints we obtain a value of 27%. If we compare this to quality factors for structures in the literature that can be compared to other NMR or crystal structures we would suggest a pairwise rmsd for backbone atoms of between 1.8 and 2.0Å 26. The utility of a structure at this level of accuracy as a starting point for modeling of other proteins, complete with side chains, remains to be seen. Assessment of the accuracy required for backbone atom positions in the application of programs that fill in sidechains remains an active area of research 27; 28; 29.
The availability of a structure also offers the possibility of further functional characterization of PF1061. Unfortunately, 1JSB, the only homologue identified with confidence by threading and sequence identity at the beginning of our studies was classified simply as a conserved hypothetical protein. Having produced a structure, one can now use structural similarity to search against structural databases. Using a structural comparison program based purely on backbone atom positions, DALI 30, there are three structurally related proteins that score better than 1JSB/1RYJ. These include 1C1Y, a Ras related protein Rap 1A, 1UBI, ubiquitin itself, and 1FMA-D, which plays a role in sulfur transfer during a molybdopterin biosynthesis. Programs that include residue specific information for alignments such as PSI-BLAST 31 and the newer multiple alignment version of GenThreader 23 do not score 1C1Y and 1UBI near the top of their lists, but 1FMA is near the top of both, as is another protein 1F0Z, a sulfur transfer protein involved in thiamin synthesis. The latter protein appears in the DALI list as well, but with a somewhat lower score than 1JSB/1RYJ.
The two protein structures, 1FMA-D and 1F0Z, also have slightly better RMSDs from backbone atoms of PF1061 than does 1RYJ. If we use the same 44 amino acid conserved alignment region discussed above which excludes the C-terminus, 1FMA-D has an RMSD of 2.3 Å with respect to PF1061 as compared to 2.5Å for 1RYJ. 1F0Z has a deviation of 2.5 Å, the same as 1RYJ for the conserved region, but a smaller RMSD if a longer segment is used. These two new structures are interesting comparisons because they are better annotated. 1F0Z is the thiamine-S protein from E. coli. It is involved in sulfur transfer in which the sulfur is carried as a thiocarboxylate at the terminal Glycine. 1FMA-D is a converting factor involved in the synthesis of protein bound pterin cofactors that bind molybdenum in molybdo enzymes via a dithiolene side-chain. The crystal structure as deposited actually contains two proteins; the 1FMA-D subunit to which PF1061 bears similarity is denoted the MoaD protein; it interacts very specifically with its partner, MoaE.
Both 1F0Z and 1FMA have a characteristic C-terminal pair of Glycines as well as other conserved residues. In fact, comparing our sequence to a consensus sequence generated by ProDom32 that contains 1F0Z and 1FMA-D, our protein, with some allowance for gaps, appears to share the 11 most conserved residues. Aside from the C-terminal residues these conserved residues cluster on one side of the molecule, indicating a possible involvement in protein-protein interaction. It is significant that the C-terminus in our structure showed significantly lower order parameters than the rest of the protein, suggesting that in isolation this segment was undergoing significant internal motion. On examining the structure of the MoaD part of the IFMA-D converting factor, one sees that the C-terminal extension extends deeply into the core of the MoaE. One would, therefore, not expect this terminus to be structured in the absence of its partner protein. Hence, structural data in this case supports a possible assignment of PF1061 to a family of thiaminS proteins and the structure has possible implications for its function as a part of a complex. This suggestion requires a more detailed search for a partner to PF1061 in the Pyrococcus furiosus genome as well as further functional testing.
Hence, we have been able to produce a protein backbone structure for the conserved hypothetical protein, PF1061, from Pyrococcus furiosus, using a significantly new approach to protein structure determination. The new methodology based heavily on residual dipolar couplings, allowed data acquisition in a time period of slightly over one week. This represents a reduction in time required by about a factor of three. Experiments are chosen primarily for the structural data returned, and no strictly separate set of experiments for resonance assignment is required. The analysis in terms of structure benefited from development of a new analysis package called REDcRAFT. This has allowed structure determination in a period well matched to the week-long data acquisition. The resulting structure appears to be accurate at the 2.0 Å level and shows utility in making connections to function for a previously un-annotated protein.
Acknowledgments
We would like to thank Anita Kishore for her assistance in the preperation of the alignment media for this work. This work was supported by a grant from the National Institutes of Health, GM062407.
References
- 1.Montelione GT, Zheng DY, Huang YPJ, Gunsalus KC, Szyperski T. Protein NMR spectroscopy in structural genomics. Nature Structural Biology. 2000;7:982–985. doi: 10.1038/80768. [DOI] [PubMed] [Google Scholar]
- 2.Tian F, Valafar H, Prestegard JH. A dipolar coupling based strategy for simultaneous resonance assignment and structure determination of protein backbones. J Am Chem Soc. 2001;123:11791–11796. doi: 10.1021/ja011806h. [DOI] [PubMed] [Google Scholar]
- 3.Orengo CA, Todd AE, Thornton JM. From protein structure to function. Curr Opin Struct Biol. 1999;9:374–382. doi: 10.1016/S0959-440X(99)80051-7. [DOI] [PubMed] [Google Scholar]
- 4.Sali A, Kuriyan J. Challenges at the frontiers of structural biology. Trends in Biochemical Sciences. 1999;24:M20–M24. [PubMed] [Google Scholar]
- 5.Holm L, Sander C. Database Algorithm for Generating Protein Backbone and Side-Chain Coordinates from a C-Alpha Trace Application to Model-Building and Detection of Coordinate Errors. J Mol Biol. 1991;218:183–194. doi: 10.1016/0022-2836(91)90883-8. [DOI] [PubMed] [Google Scholar]
- 6.Lee C, Subbiah S. Prediction of Protein Side-Chain Conformation by Packing Optimization. J Mol Biol. 1991;217:373–388. doi: 10.1016/0022-2836(91)90550-p. [DOI] [PubMed] [Google Scholar]
- 7.Adams MWW, Dailey HA, Delucas LJ, Luo M, Prestegard JH, Rose JP, Wang BC. The Southeast Collaboratory for Structural Genomics: A high-throughput gene to structure factory. Accounts of Chemical Research. 2003;36:191–198. doi: 10.1021/ar0101382. [DOI] [PubMed] [Google Scholar]
- 8.Morris LC, Valafar H, Prestegard JH. Assignment of protein backbone resonances using connectivity, torsion angles and C-13(alpha) chemical shifts. J Biomol NMR. 2004;29:1–9. doi: 10.1023/B:JNMR.0000019500.76436.31. [DOI] [PubMed] [Google Scholar]
- 9.Schwieters CD, Kuszewski JJ, Tjandra N, Clore GM. The Xplor-NIH NMR molecular structure determination package. J Magn Reson. 2003;160:65–73. doi: 10.1016/s1090-7807(02)00014-9. [DOI] [PubMed] [Google Scholar]
- 10.Berman HM, Westbrook J, Feng Z, Gilliland G, Bhat TN, Weissig H, Shindyalov IN, Bourne PE. The Protein Data Bank. Nucleic Acids Research. 2000;28:235–242. doi: 10.1093/nar/28.1.235. [DOI] [PMC free article] [PubMed] [Google Scholar]
- 11.Tolman JR, Flanagan JM, Kennedy MA, Prestegard JH. Nuclear Magnetic Dipole Interactions in Field-Oriented Proteins - Information for Structure Determination in Solution. Proc Natl Acad Sci U S A. 1995;92:9279–9283. doi: 10.1073/pnas.92.20.9279. [DOI] [PMC free article] [PubMed] [Google Scholar]
- 12.Tjandra N, Bax A. Direct measurement of distances and angles in biomolecules by NMR in a dilute liquid crystalline medium. Science. 1997;278:1111–1114. doi: 10.1126/science.278.5340.1111. [DOI] [PubMed] [Google Scholar]
- 13.Cornilescu G, Delaglio F, Bax A. Protein backbone angle restraints from searching a database for chemical shift and sequence homology. J Biomol NMR. 1999;13:289–302. doi: 10.1023/a:1008392405740. [DOI] [PubMed] [Google Scholar]
- 14.Fowler CA, Tian F, Al-Hashimi HM, Prestegard JH. Rapid determination of protein folds using residual dipolar couplings. J Mol Biol. 2000;304:447–460. doi: 10.1006/jmbi.2000.4199. [DOI] [PubMed] [Google Scholar]
- 15.Andrec M, Du PC, Levy RM. Protein backbone structure determination using only residual dipolar couplings from one ordering medium. J Biomol NMR. 2001;21:335–347. doi: 10.1023/a:1013334513610. [DOI] [PubMed] [Google Scholar]
- 16.Prestegard JH, Al-Hashimi HM, Tolman JR. NMR structures of biomolecules using field oriented media and residual dipolar couplings. Q Rev Biophys. 2000;33:371–424. doi: 10.1017/s0033583500003656. [DOI] [PubMed] [Google Scholar]
- 17.Bax A, Kontaxis G, Tjandra N. Nuclear Magnetic Resonance of Biological Macromolecules, Pt B. Vol. 339. 2001. Dipolar couplings in macromolecular structure determination; pp. 127–174. [DOI] [PubMed] [Google Scholar]
- 18.Prestegard JH, Kishore AI. Partial alignment of biomolecules: an aid to NMR characterization. Curr Opin Struct Biol. 2001;5:584–590. doi: 10.1016/s1367-5931(00)00247-7. [DOI] [PubMed] [Google Scholar]
- 19.Valafar H, Prestegard JH. REDCAT: a residual dipolar coupling analysis tool. J Magn Reson. 2004;167:228–41. doi: 10.1016/j.jmr.2003.12.012. [DOI] [PubMed] [Google Scholar]
- 20.Al-Hashimi HM, Valafar H, Terrell M, Zartler ER, Eidsness MK, Prestegard JH. Variation of molecular alignment as a means of resolving orientational ambiguities in protein structures from dipolar couplings. J Magn Reson. 2000;143:402–406. doi: 10.1006/jmre.2000.2049. [DOI] [PubMed] [Google Scholar]
- 21.Koradi R, Billeter M, Wuthrich K. MOLMOL: A program for display and analysis of macromolecular structures. Journal of Molecular Graphics. 1996;14:51-&. doi: 10.1016/0263-7855(96)00009-4. [DOI] [PubMed] [Google Scholar]
- 22.Pearl FMG, Lee D, Bray JE, Sillitoe I, Todd AE, Harrison AP, Thornton JM, Orengo CA. Assigning genomic sequences to CATH. Nucleic Acids Research. 2000;28:277–282. doi: 10.1093/nar/28.1.277. [DOI] [PMC free article] [PubMed] [Google Scholar]
- 23.Jones DT. GenTHREADER: An efficient and reliable protein fold recognition method for genomic sequences. J Mol Biol. 1999;287:797–815. doi: 10.1006/jmbi.1999.2583. [DOI] [PubMed] [Google Scholar]
- 24.Xu Y, Xu D, Crawford OH, Einstein JR, Larimer F, Uberbacher E, Unseren MA, Zhang G. Protein threading by PROSPECT: a prediction experiment in CASP3. Protein Engineering. 1999;12:899–907. doi: 10.1093/protein/12.11.899. [DOI] [PubMed] [Google Scholar]
- 25.Sali A, Blundell TL. Comparative Protein Modeling by Satisfaction of Spatial Restraints. J Mol Biol. 1993;234:779–815. doi: 10.1006/jmbi.1993.1626. [DOI] [PubMed] [Google Scholar]
- 26.Bax A. Weak alignment offers new NMR opportunities to study protein structure and dynamics. Protein Science. 2003;12:1–16. doi: 10.1110/ps.0233303. [DOI] [PMC free article] [PubMed] [Google Scholar]
- 27.Liang SD, Grishin NV. Side-chain modeling with an optimized scoring function. Protein Science. 2002;11:322–331. doi: 10.1110/ps.24902. [DOI] [PMC free article] [PubMed] [Google Scholar]
- 28.Mendes J, Baptista AM, Carrondo MA, Soares CM. Improved modeling of side-chains in proteins with rotamer-based methods: A flexible rotamer model. Proteins. 1999;37:530–543. doi: 10.1002/(sici)1097-0134(19991201)37:4<530::aid-prot4>3.0.co;2-h. [DOI] [PubMed] [Google Scholar]
- 29.Looger LL, Hellinga HW. Generalized dead-end elimination algorithms make large-scale protein side-chain structure prediction tractable: Implications for protein design and structural genomics. J Mol Biol. 2001;307:429–445. doi: 10.1006/jmbi.2000.4424. [DOI] [PubMed] [Google Scholar]
- 30.Holm L, Sander C. Dali - a Network Tool for Protein-Structure Comparison. Trends in Biochemical Sciences. 1995;20:478–480. doi: 10.1016/s0968-0004(00)89105-7. [DOI] [PubMed] [Google Scholar]
- 31.Altschul SF, Madden TL, Schaffer AA, Zhang JH, Zhang Z, Miller W, Lipman DJ. Gapped BLAST and PSI-BLAST: a new generation of protein database search programs. Nucleic Acids Research. 1997;25:3389–3402. doi: 10.1093/nar/25.17.3389. [DOI] [PMC free article] [PubMed] [Google Scholar]
- 32.Servant F, Bru C, Carrere S, Courcelle E, Gouzy J, Peyruc D, Kahn D. ProDom: automated clustering of homologous domains. Brief Bioinform. 2002;3:246–51. doi: 10.1093/bib/3.3.246. [DOI] [PubMed] [Google Scholar]
- 33.Joe Sambrook DR. Molecular Cloning, A Laboratory Manual. 3. Cold Spring Harbor Laboratory Press; 2000. 3 vols. [Google Scholar]
- 34.Weisemann R, Ruterjans H, Schwalbe H, Schleucher J, Bermel W, Griesinger C. Determination of H(N),H-Alpha and H(N), C' Coupling- Constants in C-13,N-15-Labeled Proteins. J Biomol NMR. 1994;4:231–240. doi: 10.1007/BF00175250. [DOI] [PubMed] [Google Scholar]
- 35.Delaglio F, Grzesiek S, Vuister GW, Zhu G, Pfeifer J, Bax A. Nmrpipe - a Multidimensional Spectral Processing System Based on Unix Pipes. J Biomol NMR. 1995;6:277–293. doi: 10.1007/BF00197809. [DOI] [PubMed] [Google Scholar]
- 36.Varner SJ, Vold RL, Hoatson GL. An efficient method for calculating powder patterns. J Magn Reson Ser A. 1996;123:72–80. doi: 10.1006/jmra.1996.0215. [DOI] [PubMed] [Google Scholar]
- 37.Clore GM, Gronenborn AM, Bax A. A robust method for determining the magnitude of the fully asymmetric alignment tensor of oriented macromolecules in the absence of structural information. J Magn Reson. 1998;133:216–221. doi: 10.1006/jmre.1998.1419. [DOI] [PubMed] [Google Scholar]
- 38.Huang CC, Couch GS, Pettersen EF, Ferrin TE. Chimera: An Extensible Molecular Modeling Application Constructed Using Standard Components. Pacific Symposium on Biocomputing. 1996;1:724. [Google Scholar]
- 39.Clore GM, Gronenborn AM, Tjandra N. Direct structure refinement against residual dipolar couplings in the presence of rhombicity of unknown magnitude. J Magn Reson. 1998;131:159–162. doi: 10.1006/jmre.1997.1345. [DOI] [PubMed] [Google Scholar]