

Abstract
Simultaneous imaging of multiple cellular components is of tremendous importance in the study of complex biological systems, but the inability to use probes with similar emission spectra and the time consuming nature of collecting images on a confocal microscope are prohibitive. Hyperspectral imaging technology, originally developed for remote sensing applications, has been adapted to measure multiple genes in complex biological tissues. A spectral imaging microscope was used to acquire overlapping fluorescence emissions from specific mRNAs in brain tissue by scanning the samples using a single fluorescence excitation wavelength. The underlying component spectra obtained from the samples are then separated into their respective spectral signatures using multivariate analyses, enabling the simultaneous quantitative measurement of multiple genes either at regional or cellular levels.
Keywords: hyperspectral imaging, immediate early genes, fluorescence imaging, pushbroom line-imaging, multivariate image analysis, spectral unmixing
1. Introduction
Confocal microscopy is a valuable tool for cellular and molecular biologists, but a limitation of the confocal microscope technology is the necessity of using fluorescent dyes with distinctly separate emission spectra to avoid spectral overlap. Fluorophores with overlapping wavelengths are difficult to discern and can lead to an inaccurate assessment of dye localization. Often the optimal choice for envisioning multiple targets is abandoned due to the inability of the imaging system to resolve two or more fluorophores. A hyperspectral imaging system is designed to collect an entire spectrum at each image pixel and uses mathematical modeling known as spectral unmixing methods to determine images of the emissions from the underlying individual fluorescent components. In recent years hyperspectral imaging has been extended from its original applications in remote sensing to biological microscopy (Schultz et al., 2001; Huebschman et al, 2002; Zimmerman et al., 2003).
The hyperspectral imager (HSI) used for these studies was developed by Sandia National Laboratories and is a pushbroom (also known as a linescan) spectrum imaging microscope. Details of the design and characterization are published elsewhere. (Sinclair et al., 2004). This system is extremely sensitive and employs self-modeling curve resolution methods, specifically multivariate curve resolution (MCR) algorithms (Schoonover et al., 2003; Kotula et al., 2003; Haaland et al., 2003), to quantitatively assess the emissions from each of the fluorescent species with little a priori information. MCR is an extension to the more familiar principal component analysis (PCA). While PCA is a powerful analysis technique, it is of limited value for spectral imaging applications because the resulting orthogonal vectors can be difficult to interpret. In contrast, the MCR algorithms used in this work are based on a constrained alternating least squares procedure (Kotula et al., 2003; Haaland et al., 2003) and the incorporation of non-negativity constraints results in physically meaningful pure component spectra that are directly proportion to the emission spectra of the fluorescent components and thus easily interpreted. MCR requires some spatial or spectral variation of the fluorophores within an image to ensure accurate separation of all components, but the algorithms applied to the hyperspectral imager are fast, capable of handling large data sets, and yield quantitative estimates and relative concentrations of each dye component present at each pixel without requiring reference spectra or the presence of single component image pixels. This is an advantage over other spectral unmixing methods such as linear unmixing, which require the component spectra to be known or pure component pixels to exist within the image.
Another advantage of the hyperspectral imager used in this study is the pushbroom spectral imaging microscope. Typical confocal microscopes focus the excitation source into a point on the sample and collect the emitted light on the CCD one pixel at a time. The pushbroom line-imaging format focuses the laser into a line on the sample and focuses the line of emission spectra onto the vertical dimension of a CCD detector. By gathering a line of pixels instead of one pixel at a time, a data frame containing the emission spectra for each y position along the sample is collected. Multiple frames can be assembled into a data cube to create a 2-D image representing the full emission spectrum for each point in the sample. However, a trade-off of any line-imaging system is that the use of an entrance slit in front of the spectrometer rather than a pinhole prohibits true confocal image capabilities. Though, confocal imaging is a powerful tool for visualizing gene expression, the advantages of hyperspectral imaging outlined above extends and complements the capabilities of the confocal microscope.
2. Materials and methods
To evaluate the capabilities of the hyperspectral imager for imaging brain tissue, coronal brain sections were obtained from young male Spague-Dawley rats exposed to a novel environment for 5 min and then sacrificed. Previous studies (Guzowski et al., 1999, 2001; Vazdarjanova el al., 2002, 2006) have demonstrated that the transcription of the immediate early gene Arc is dramatically upregulated in a subset of hippocampal pyramidal neurons of rats allowed to briefly explore a novel environment. Triple label fluorescence in situ hybridization (FISH) was performed to detect the cellular location of the RNAs for Arc, glutamic acid decarboxylase (GAD65/67; a marker for interneurons), and α -CaMKII (α -calcium/calmodulin-dependent protein kinase II; a marker for pyramidal neurons) (Guzowski et al., 1999). Arc positive cells were labeled with TSA Cyanine 3 system (Cy3; PerkinElmer, Boston, MA), GAD65/67 was labeled with Texas Red (Jackson Laboratories, Bar Harbor, ME), α -CAMKII was labeled with TSA Cyanine 5 system (Cy5; PerkinElmer) and nuclei were labeled with Sytox green (Molecular Probes, Eugene, OR). These dyes have overlapping emission spectra with peaks at 523 nm, 565 nm, 615 nm, and 670 nm for Sytox green, Cy3, Texas Red, and Cy5, respectively and are not adequately resolved using standard filters.
Two dimensional high-resolution image scans were obtained at 60X magnification (CFI Plan Apo, NA 0.95, Nikon,Melville, NY) using a 532 nm laser (25mW frequency doubled solid-state Nd:YVO4 laser (Crystal Laser, Reno, NV)). Low-resolution image scans were obtained on the same system using 10X magnification (CFI Plan Apo, NA 0.45, Nikon,Melville, NY). Hyperspectral image data cubes containing 2 spatial dimensions (x and y) and one spectral dimension (emission wavelengths) were processed using a weighted PCA analysis to determine the number of pure component spectra followed by MCR methods based on a constrained alternating least squares algorithm to identify and separate each of the overlapping emission spectra (including spectra obtained from autofluorescence, though not shown in this publication). Relative concentration images of each pure component emitting species were then obtained. More details on the specific analyses methods applied to these images can be found in Haaland et al., 2003 and Timlin et al, 2005. (Haaland et al., 2003;Timlin et al., 2005)
3. Results
For this application, the hyperspectral imaging system scanned a 10 mm x 8 mm tissue section in less than 2 minutes at 30 μ m (low) resolution and a 100 μ m x 200 μ m section at 0.8 μ m (high) resolution in 1 minute. The spectral resolution was ~3 nm/pixel with 560 spectral pixels collected over the visible spectrum (480 nm-850 nm) at both of these spatial resolutions. Figure 1 illustrates the capabilities of the multivariate curve resolution algorithm to extract underlying emission spectra from a high resolution hyperspectral image of brain tissue. Figure 1A contains the mean intensity image with a line of laser excitation marked. A region on this line of excitation is enlarged in Figure 1B to show detail and three sample pixels of differing composition. Raw spectra and MCR analysis results for these three pixels are shown in Figure 1C. Figure 1D contains 222 emission spectra acquired simultaneously from the line of excitation marked in Figure 1A. Upon close inspection, contributions from all four dye spectra can be observed, but severe overlap prohibits one from obtaining good images using univariate or filter-based methods. Figure 1E illustrates the unmixed spectral components as determined by MCR.
Figure 1.
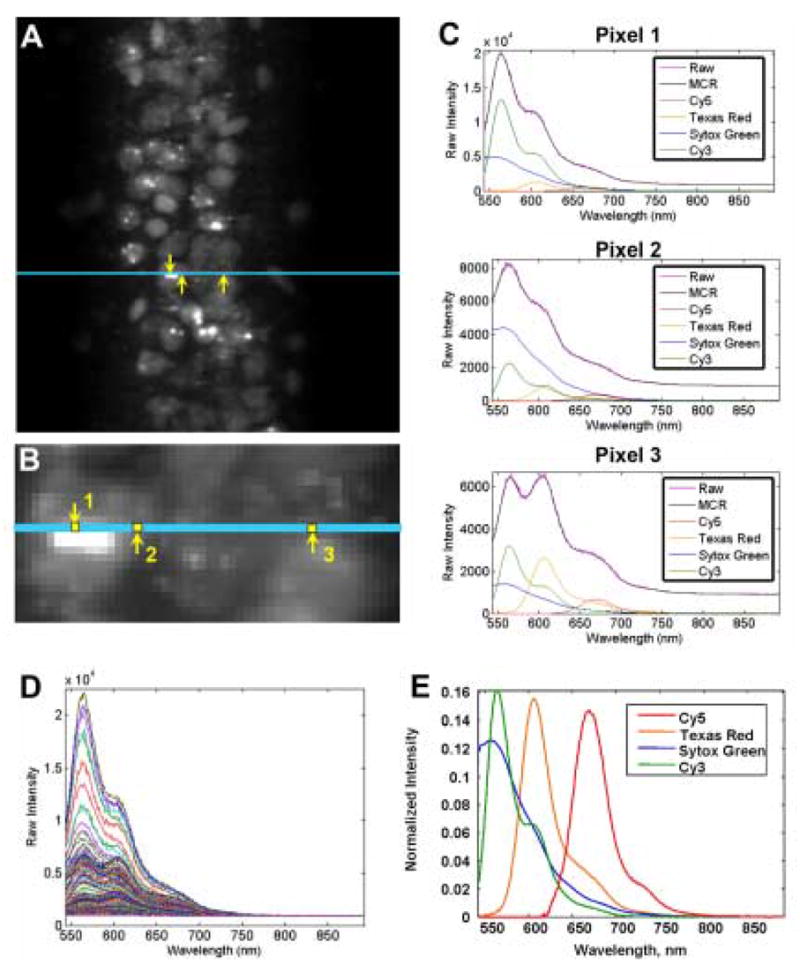
MCR analysis applied to hyperspectral image data from the dorsal hippocampus (CA1). (A) Grayscale mean intensity image. Entire image contains ~50000 fluorescence emission spectra. Cyan line indicates one line of excitation light used to generate the image. Spectra from each of the 222 pixels on this line are acquired simultaneously in the line-imager. (B) Enlargement of the area shown in (A). Within the cyan excitation line, three pixels of differing spectral composition are called out to illustrate the analysis procedure and results. (C) Raw data and analysis results from three example pixels (Pixel 1, Pixel 2 and Pixel 3) along the line of excitation shown in (A) and (B). Pixels are indicated with yellow arrows and numbered. Each plot shows the raw fluorescence emission spectrum obtained at the pixel of corresponding number in (B), as well as the MCR modeled spectrum and the four individual, scaled component spectra as determined by the analysis for that pixel. (D) 222 overlapping fluorescence emission spectra from all pixels along the cyan line shown in (B). (E) MCR extracted component spectra corresponding to the four dyes in the tissue, Sytox green (523 nm, blue trace), Cy3 (565 nm, green trace), Texas Red (615 nm, orange trace), and Cy5 (670 nm, red trace). The extracted component spectra are normalized to unit length in this panel.
In our application, the MCR analysis has several benefits. MCR can identify autofluorescence and background emissions within the tissue and generate independent concentration images for those, eliminating their contamination of dye images. Because MCR defines the pure components, it often can allow identification and extraction of all emitting species without the need for reference spectra, as required by other multivariate algorithms previously employed in hyperspectral image analysis (Dickinson et al., 2001). In addition, MCR can be used effectively to calibrate the sample. Although no reference spectra were used for the dyes in the present study, pure component emission spectra of control tissue can be determined from spectral images, and then subsequently constrained in the experimental condition images, permitting a clearer view of the experimental effect. Based on the pure components identified by MCR, shown in Figure 1E, an independent image for each of the individual dyes was obtained and false-colored (Fig. 2a–2d) and a composite RGB image was constructed (Fig. 2e). MCR generated images for each individual dye from a large area scan acquired at low resolution are shown in grayscale, Figure 3a–3d, to illustrate the potential for high throughput imaging of multiple genes in whole brain sections.
Figure 2.
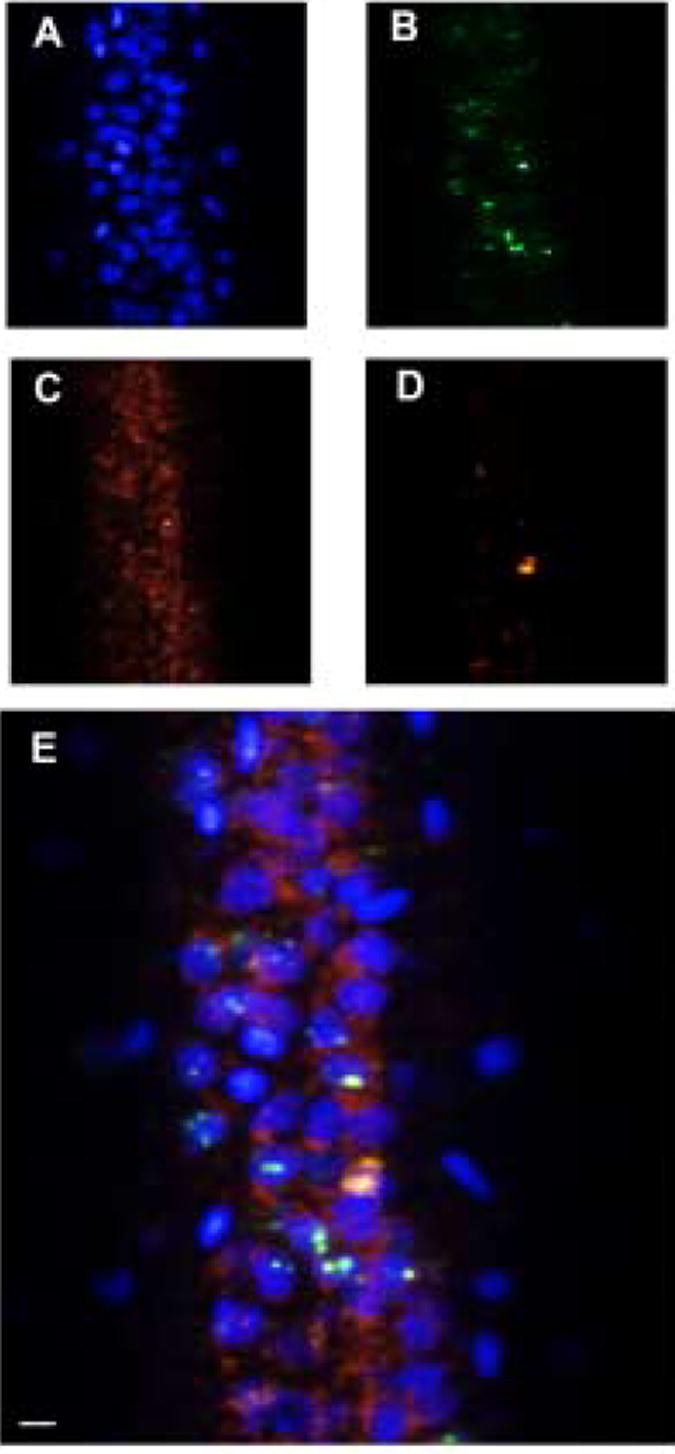
High resolution hyperspectral images of the dorsal hippocampus (CA1) labeled with 4 dyes having overlapping emission spectra: Sytox green (523 nm), Cy3 (565 nm), Cy5 (670 nm), and Texas Red (615 nm). In addition to identifying the pure component spectra shown in Fig. 1, the MCR analysis generates images that correspond to the concentrations of each of the components. (A) Sytox green labels the nuclei (blue), (B) Cy3 identifies the immediate early gene, Arc (green), (C) Cy5 labels CAMKII (red), and (D) Texas Red labels GAD65/67 (orange). (D) An RGB image constructed from the false-colored individual images. Mean intensity image of the original raw data is shown in Figure 1a. Scale bar = 10 μm.
Figure 3.

Low resolution hyperspectral images of rat brain coronal sections labeled with 4 dyes having overlapping emission spectra: Sytox green (523 nm), Cy3 (565 nm), Cy5 (670 nm), and Texas Red (615 nm). In addition to identifying the pure component spectra shown in Fig. 1, the MCR analysis generates images that correspond to the concentrations of each of the components. (A) Sytox green labels the nuclei, (B) Cy3 identifies the immediate early gene, Arc, (C) Cy5 labels CAMKII, and (D) Texas Red labels GAD65/67. Scale bar = 1.0 mm.
4. Discussion
Using this microscope scanner and analysis software, four emission spectra corresponding to the fluorescent labels were rapidly distinguished with multivariate curve resolution analysis. The development of the hyperspectral imaging system should lead to rapid advances in biological imaging by expanding our ability to utilize multiple fluorescent dyes while essentially eliminating many problems associated with overlapping emission spectra. With the hyperspectral imager, collection of data from the whole emission spectrum is achieved and accurate measurements of three or more dye concentrations are possible through the use of multivariate analysis. The effects of unwanted emissions such as background emissions, autofluorescence and dye crosstalk can be essentially negated by mathematical modeling of these emissions as independent components. Although the present instrument is not capable of 3D imaging, the hyperspectral imager does provide an excellent complementary approach to high-resolution confocal methods and can offer additional capabilities for rapidly determining the localization patterns of multiple high numbers of genes, proteins or compounds of interest in biological tissues.
Acknowledgments
This study was supported by the National Institutes of Health, AG018230, AG023309. and AG009219. We thank Michelle Carroll for secretarial assistance and Michael Keenan, David Haaland, David Melgaard, Mark VanBentham, and Howland Jones for developing the MCR analysis algorithms and software. *Sandia is a multi-program laboratory operated by Sandia Corporation, a Lockheed Martin Company, for the United States Department of Energy under Contract DE-ACO4-94AL85000.
Footnotes
Publisher's Disclaimer: This is a PDF file of an unedited manuscript that has been accepted for publication. As a service to our customers we are providing this early version of the manuscript. The manuscript will undergo copyediting, typesetting, and review of the resulting proof before it is published in its final citable form. Please note that during the production process errors may be discovered which could affect the content, and all legal disclaimers that apply to the journal pertain.
References
- Dickinson ME, Bearman G, Tille S, Lansford R, Fraser SE. Multi-spectral imaging and linear unmixing add a whole new dimension to laser scanning fluorescence microscopy. Biotechniques. 2001;31:1272–8. doi: 10.2144/01316bt01. [DOI] [PubMed] [Google Scholar]
- Guzowski JF, McNaughton BL, Barnes CA, Worley PF. Environment-specific expression of the immediate-early gene Arc in hippocampal neuronal ensembles. Nat. Neurosci. 1999;2:1120–4. doi: 10.1038/16046. [DOI] [PubMed] [Google Scholar]
- Guzowski JF, Setlow B, Wagner EK, McGaugh JL. Experience-dependent gene expression in the rat hippocampus after spatial learning: a comparison of the immediate-early genes Arc, c-fos, and zif268. J. Neurosci. 2001;21:5089–98. doi: 10.1523/JNEUROSCI.21-14-05089.2001. [DOI] [PMC free article] [PubMed] [Google Scholar]
- Haaland DM, Timlin JA, Sinclair MB, Van Benthem MH, Martinex MJ, Aragon AD, Werner-Washburne M. Multivariate curve resolution for hyperspectral image anlaysis: applications to microarray technology. Proc SPIE. 2003;4959:55–66. [Google Scholar]
- Huebschman ML, Schultz RA, Garner HR. Characteristics and capabilities of the hyperspectral imaging microscope. IEEE Eng. Med. Biol. Mag. 2002;21:104–17. doi: 10.1109/memb.2002.1032647. [DOI] [PubMed] [Google Scholar]
- Kotula PG, Keenan MR, Michael JR. Automated analysis of SEM X-ray spectral images: a powerful new microanalysis tool. Microsc. Microanal. 2003;9:1–17. doi: 10.1017/S1431927603030058. [DOI] [PubMed] [Google Scholar]
- Schoonover JR, Marx R, Zhang SL. Multivariate curve resolution in the analysis of vibrational spectroscopy data files. Appl. Spectrosc. 2003;57:154A–70A. doi: 10.1366/000370203321666461. [DOI] [PubMed] [Google Scholar]
- Schultz RA, Nielsen T, Zavaleta JR, Ruch R, Wyatt R, Garner HR. Hyperspectral imaging: a novel approach for microscopic analysis. Cytometry. 2001;43:239–47. doi: 10.1002/1097-0320(20010401)43:4<239::aid-cyto1056>3.0.co;2-z. [DOI] [PubMed] [Google Scholar]
- Sinclair MB, Timlin JA, Haaland DM, Werner-Washburne M. Design, construction, characterization, and application of a hyperspectral microarray scanner. Appl. Opt. 2004;43:2079–88. doi: 10.1364/ao.43.002079. [DOI] [PubMed] [Google Scholar]
- Timlin JA, Sinclair MB, Haaland DM, Aragon AD, Martinez MJ, Werner-Washburne M. Hyperspectral microarray scanning: Impact on the accuracy and reliability of gene expression data. BMC Genomics. 2005;6:72. doi: 10.1186/1471-2164-6-72. [DOI] [PMC free article] [PubMed] [Google Scholar]
- Vazdarjanova A, McNaughton BL, Barnes CA, Worley PF, Guzowski JF. Experience dependent coincident expression of the effector immediate-early genes Arc and Homer 1a in hippocampal and neocortical neuronal networks. J. Neurosci. 2002;22:10067–71. doi: 10.1523/JNEUROSCI.22-23-10067.2002. [DOI] [PMC free article] [PubMed] [Google Scholar]
- Vazdarjanova A, Ramirez-Amaya V, Insel N, Plummer TK, Rosi S, Mikhael D, Worley PF, Guzowski JF, Barnes CA. Spatial exploration induces Arc, a plasticity-related immediate-early gene, only in calcium-calmodulin-dependent protein kinase II positive principal excitatory and inhibitory neurons of the forebrain. J Comp Neurol. 2006 doi: 10.1002/cne.21003. in press. [DOI] [PubMed] [Google Scholar]
- Zimmermann T, Rietdorf J, Pepperkok R. Spectral imaging and its applications in live cell microscopy. FEBS Lett. 2003;546:87–92. doi: 10.1016/s0014-5793(03)00521-0. [DOI] [PubMed] [Google Scholar]