

Abstract
EEG and MEG are important functional neuroimaging modalities for studying the temporal dynamics of neural activities and interactions, but the accurate localization of neural activities still remains a challenging problem. Combining EEG/MEG with MRI or/and functional MRI (fMRI) holds promise to significantly increase the spatial resolution of electromagnetic source imaging, and at the same time, allows tracing the rapid neural processes and information pathways within the brain, which cannot be achieved using these modalities in isolation. In this paper, we review some recent progresses in multimodal neuroimaging, with special emphasis on the integration of EEG, MEG with MRI and fMRI. Some examples are shown to illustrate the importance of the combined source analysis in clinical and experimental studies.
Keywords: EEG, fMRI, MEG, MRI, multimodal imaging, neuroimaging
1. Introduction
The past decade witnessed an explosive development of functional neuroimaging techniques to observe and measure brain activity in human. Neuronal activity can elevate electromagnetic signal changes (the primary effects) as well as hemodynamic and metabolic changes (the secondary effects). These changes are the basic sources for all the modern functional neuroimaging techniques. Electroencephalography (EEG) or magnetoencephalography (MEG) has enabled the estimation of the neural sources from the scalp potentials or magnetic fields recorded through high-density sensors by solving a so-called “inverse problem”. Since the propagation of bioelectromagnetic fields is effectively instantaneous [1–3], EEG and MEG have a remarkable merit of high temporal resolution at sub-millisecond scale, capable of detecting the rapid changes of neurophysiologic processes. However, these techniques suffer from the ambiguities in defining the precise locations of brain activity due to the ill-posedness of the inverse problem [4, 5].
On the other hand, functional magnetic resonance imaging (fMRI), using endogenous blood oxygenation level dependent (BOLD) contrast, is another well established technique for mapping human brain function. The benefit of fMRI is, conversely, its high spatial resolution; activated brain areas can be localized with millimeter spatial resolution. But the slow response time of the BOLD response limits its capability to characterize how, rather than where, the brain performs its tasks [6–8].
Tremendous efforts have been made to integrate information across multiple modalities during the same task in an attempt to establish an alternative high-resolution spatiotemporal imaging technique [9–12]. In this paper, we will discuss different approaches that have been proposed for multimodal neuroimaging with special emphasis on the integration of EEG, MEG and MRI, fMRI. Some applications will be shown to illustrate the efficacy and importance of these techniques in clinical and neuroscience studies. Finally, we will discuss some remaining challenges and problems in the multimodal integration.
2. Integration of EEG/MEG and MRI
Both EEG and MEG signals arise from the postsynaptic currents of cortical neurons, reflecting the electrical behavior of neuronal interactions [1, 2]. The distributed synaptic currents generate electromagnetic field, propagating within a passive volume conductor that comprises brain structure, cerebrospinal fluid, skull and scalp [1, 4]. The derivation of the scalp potentials or magnetic fields from brain current sources is known as “forward problem”, which requires the modeling of the head volume conductor. The accuracy of inverse solution depends crucially on the degree of agreement of the forward model with the actual conducting properties and shape of the head. Although the spherical model has an analytical forward solution and is still widely used in inverse source imaging, some comparative studies have shown that realistic geometric head model can provide substantial improvement in predicting EEG/MEG signals outside the head [13, 14].
Typically, T1-weighted MR images are used to build the realistic geometric model for individual patients or subjects since they present high contrast and allow for the segmentation of different head compartments and other brain structures of interest. Subsequently, boundary element method (BEM) [13, 15–16] or finite element method (FEM) [17–20] is commonly employed to implement the numerical forward calculation. Notably, the MR-based diffusion tensor imaging (DTI) has recently been suggested to map the conductivity tensor of human brain considering the high correlation between electrical connectivity tensor and water self-diffusion tensor, which holds the potential to further refine the head modeling by taking the anisotropy of white matter into account [65]. Another benefit from the integration of MRI and EEG or MEG is the visualization of source localization or distribution relative to the brain anatomy, which facilitates the comparison with other imaging methods or intracranial recordings and is therefore of clinical significance [21, 22].
2.1 Realistic Geometry Cortical Potential Imaging
One application of MRI-EEG combined source analysis is known as cortical potential imaging (CPI) technique in realistic-geometry head model using BEM [16, 21, 23] or FEM [18, 68]. Specifically in the BEM-based CPI, three shells (the scalp, skull and brain) are segmented from MR images and triangulated into fine elements; each shell is assumed to be homogeneous but has different electrical conductivity. Since brain electrical sources exist only inside the brain, Green’s 2nd identity is applicable within the volume between epicortical and scalp surfaces [24]. A linear relation can thus be derived to directly link the scalp potentials with the cortical potentials by treating the layers of low-conductivity skull and scalp [16]. Applying the inverse technique, one can estimate the cortical potential distribution from the measured scalp potentials [5, 16, 25]. Note that cortical potential imaging does not require any a priori assumption on the source space of brain electrical events. Rather, it provides a noninvasive estimate of epicortical potentials, which are routinely measured during surgical evaluation using subdural electrode arrays [21].
It has been shown that the cortical surface potentials imaged from either simulation or real data can provide much higher resolution in observing the brain activity than scalp potentials [21,22, 26–28]. Particularly, in our previous experimental validation study [21], the cortical potential distribution was estimated from the patient’s somatosensory evoked potentials (SEPs), and the result was well consistent with directly recorded cortical potentials (electrocorticograms - ECoGs) in the same patient, as shown in Figure 1. This study suggested the possibility of using cortical potential imaging as a noninvasive alternative of invasive recordings for aiding presurgical planning in epilepsy patients.
Figure 1.
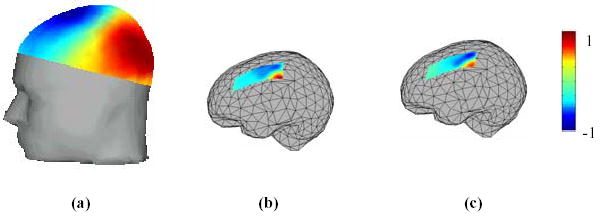
An example of cortical potential imaging in a human subject. (a) Scalp potential map at 30 ms after the onset of right median nerve stimuli; (b) the estimated cortical potential map at latency 30 ms; (c) the direct recorded subdural grid potentials at latency of 30 ms following open-skull surgery. All the maps are normalized and the colorbars are shown on the right. The correlation coefficient between the estimated and recorded subdural grid potentials is 84%. (Revised from [21] with permission)
2.2 Anatomically-constrained cortical current density imaging
Another cortical surface imaging technique is so-called cortical current density (CCD) imaging, which is based on the physiological observation that EEG or MEG signals are primarily generated by currents flowing through the apical dendrites of cortical pyramidal cells. Also, because of the columnar organization of the cortex, all possible current source locations and orientations can be constrained anatomically given the shape of cortical surface [11]. In practice, the cortical envelop can be extracted from T1-weighted MR images with high contrast between the gray matter and the white matter [29]. By dividing the whole cortical sheet into a large number of patches, the source model is usually represented by thousands of elementary current dipoles disposed over the folded cortical surface with outward-pointing direction perpendicular to the local cortical patch. The inverse problem then turns to retrieving the scalar distribution of dipole strength over the oriented cortical patches [11, 30–34].
Anatomical constraints from MRI can improve the cortical source reconstruction by excluding the solutions from physiologically unrealistic locations or directions, which in theory gives rise to reduced dimensionality of solution space and a less underdetermined inverse problem. Clearly, the efficacy of anatomically constrained CCD imaging essentially relies on the precision of the convoluted cortical surface reconstruction from MR images [11].
2.3 Realistic-geometry 3-D distributed source imaging
Instead of imaging brain electrical sources over two-dimensional surface like cortical potential imaging or cortical current density imaging techniques, the three-dimensional (3-D) source distribution within the brain volume can also be reconstructed from the external electromagnetic measurements. 3-D distributed source imaging is motivated by at least three reasons. 1) Capability of imaging 3-D distributed brain source distribution makes it more straightforward to perform the cross-validation studies and integrated analysis of EEG/MEG with other functional brain tomography modalities, such as fMRI, positron emission tomography (PET) or single photon emission computed tomography (SPECT). 2) EEG and MEG may be generated by activity in subcortical structures that cannot be revealed in cortical surface imaging techniques. 3) Source modeling in 3-D brain volume is a more generalized representation of distributed sources, which avoids the uncertainties of the location and directional constraints in surface-based model. Similar to the aforementioned, here the main purposes of combining with MRI are to compartmentalize the brain volume in which 3-D grid points are extracted and to facilitate the realistic modeling of the head volume conductor with minimal error of forward calculation [35].
The 3-D distributed source imaging is a highly ill-posed inverse problem because the solution is desired on the orthogonal triples of “regional dipoles” located at 3-D grid points throughout the brain volume. The representative inverse algorithms include minimum norm (MN) [36], lead-field normalized minimum norm (WMN) [37] and the Laplacian weighted minimum norm (LWMN) [33], also known as LORETA [38]. The MN estimates the source distribution with the smallest L2-norm solution vector that would match the measured data, but undesirably favors superficial sources. The WMN compensates the lower gains of deeper sources by using lead field normalization, while the LORETA combines the lead field normalization with the spatial Laplacian operator, thus gives the depth-compensated inverse solution under the constraint of smoothly distributed sources. One application of the realistic-geometry LORETA-based 3D source imaging technique for studying fast repetitive unilateral finger movement evoked brain activities is shown in Figure 2 [39].
Figure 2.
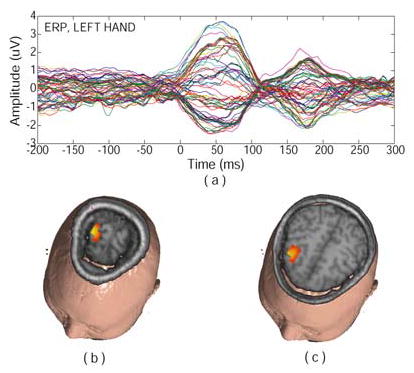
The three dimensional current source distribution estimated by LORETA in fast repetitive unilateral finger movement tasks for the left hand is shown in the figure. The analysis was performed at the first peak after the execution of the finger movement, i.e. 50 ms after EMG peak (Fig. 2.a). The current sources reconstructed by LORETA appear in the motor cortex (Fig. 2.b), which is related to the execution of the movement, and premotor area (Fig. 2.c), which is related to the coordinating of the movement. (Revised from [39] with permission)
3. Integration of EEG/MEG and fMRI
The integration of EEG/MEG and fMRI works under the hypothesis that the regions with the greater fMRI BOLD responses have larger possibility of being electrically active over the time period of interest [11, 31, 40–41]. This hypothesis is reasonable in that neural activity, modulating neuronal firing and generating EEG signals, increases the demands for oxygen and induces larger cerebral blood flow and consequently produces larger fMRI responses [42]. Although at this time the physical and physiological basis that accounts for the correlation between fMRI signal and neural electrical activity is not yet well understood, a positive coupling between local hemodynamic response and electrical activity has been observed in both animal and human experimental studies [43, 44].
3.1 fMRI-guided equivalent current dipole fitting
The coupling between brain electrical activity and fMRI measurement suggests that one can use EEG or MEG to trace the time course of local neural activation revealed by fMRI. One common approach is to assume that external electromagnetic signals are generated by a relatively small number of focal sources, usually referred as equivalent current dipole (ECD) [15, 45–48]. The activation foci derived from fMRI images can be used to guide the placement of dipole locations, and the dipole orientation and strength are then fitted so as to best explain the observed bioelectromagnetic measurements over the time period of the relative neural process. Modified from this procedure is a technique of “fMRI-seeded dipoles”, which only uses the fMRI foci as initial guesses (or seeds) for dipole locations and adjusts the dipole parameters using nonlinear optimization algorithms [49, 50].
In some cases, these techniques lead to significant conclusion in resolving the timing details of localized activation and the interactions across different neuron assemblies that cannot be obtained when using fMRI alone. On the other hand, the fMRI-guided initial guess of dipole locations has largely alleviated the local minima problem inherent in nonlinear optimization procedures as one may have experienced in traditional multiple dipole fitting problems solely based on EEG or MEG.
As the conventional fMRI techniques with the aid of these ECD-based approaches can provide additional temporal information beyond identifying the locations of neural activation, they have the potential of revealing the dynamic neuronal events, which can hardly be achieved by fMRI alone. However, these techniques are always limited by their inability to resolve complex spatiotemporally distributed activities that are usually induced by a high-level cognitive task. When a large extent of neuronal network is active in parallel, the applicability of simple dipole model would be questionable; or when a large number of different brain regions are involved, the nonlinear fitting procedure may fail to reach an optimal solution.
3.2 fMRI-constrained cortical current imaging
In order to account for the distributed nature of the neural sources inside the brain, fMRI has also been incorporated in estimation of the continuous distribution of cortical current density. In this approach, fMRI data are used to bias the EEG/MEG inverse solution towards those locations deemed as statistically significant in the view of fMRI [40, 41].
This can be implemented under different mathematical frameworks, such as 1) in the context of the generalized Wiener filtering, which states that an optimal linear estimator can be derived given the covariance matrices of both source and sensor noise are known, fMRI spatial information is encoded into the diagonal elements of source covariance matrix [11, 40]; 2) based on the regularization strategy of generalized weighted minimum norm, one can set the weight matrix according to the fMRI significance or p-value so as to allow for the fMRI preference [31]. It is worth pointing out that these two frameworks are fundamentally equivalent, as we can see that the Wiener estimator as (1)
| (1) |
where A is the forward transfer matrix, C is the sensor noise covariance matrix, and R is a source covariance matrix derived from fMRI activation maps. Since a voxel in fMRI must be either active or non-active, the fMRI-derived source covariance can be written as (2)
| (2) |
where the diagonal elements of Rf are set to a positive value f only for those dipoles whose locations are deemed active in fMRI while other diagonal elements are set to 1, and r is a regularization parameter. The inverse operator as (2) is also the minimizer of a weighted minimum norm function
| (3) |
The parameter f controls the amount of bias towards fMRI active locations, which depends on the confidence in our hypothesis that neuronal and hemodynamic activities are co-located. The regularization parameter r can either be determined by standard approaches like “L-curve”, or be calculated if the noise covariance C is accurately estimated [66].
A further refinement of this technique is to quantitatively consider the reliability of source estimation with respect to the effect of sensor noise. Due to the linearity of both forward and inverse operators, the fMRI-constrained current density estimation can be normalized by the noise sensitivity, yielding unit-free dynamic statistical parametric maps (dSPM) of brain activity [41]. This technique was used to study the cortical activity during a task involving semantic processing of visually presented words. The subjects were required to decide whether each word referred to an object or animal that is usually more than one foot in size (in any dimension). The words were either novel (i.e., presented only once in the task) or were repeated multiple times. Cortical activity in terms of dSPM was estimated from either MEG alone or MEG in conjunction with fMRI at four representative latencies in a single subject, and visualized in the subject-specific inflated cortical surface [64]. The results are shown in Figure 3.
Fig. 3.
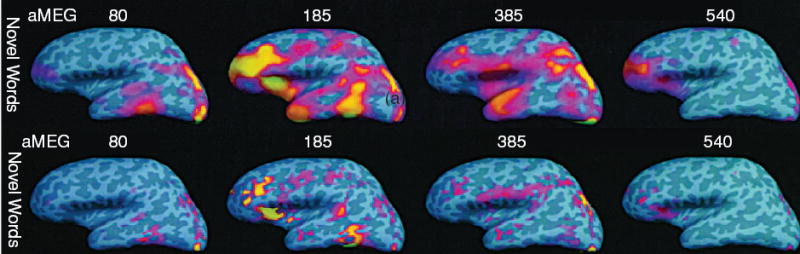
The top row shows the snapshots of estimated cortical activity at four representative latencies in a single subject. Statistical parametric maps calculated from MEG during a novel-verbal size judgment task are shown of the noise-normalized anatomically constrained dipole amplitudes. Activation was seen to spread rapidly from visual cortex around 80 ms to occipitotemporal, anterior temporal and prefrontal areas. Sulcal and gyral cortex are shown in dark and light gray, respectively. The significance threshold for the dynamic statistical maps is p < 0.001. The top row shows the snapshots of fMRI-biased cortical activity estimated from MEG at the same four latencies as in the top row in a single subject. The sequence of activity in the fMRI-biased estimates was generally similar to those constrained by anatomy alone. However, the fMRI-biased estimates were considerably more focal. All activations are significant for both fMRI (p < 0.1) and MEG (p < 0.001) (Modified from [35] with permission).
Furthermore, some latest progresses have been made to estimate the connectivity patterns among different cortical regions of interests (ROIs) using the estimated cortical current density via directed transfer function [12] or structural equation modeling [54]. Cortical connectivity estimation provides an important perspective regarding the causal relation and information flow pathways, and thus specifically addresses how, not just where and when, neuronal assemblies are activated and coordinated. Notably, a recent study on cortical connectivity estimation based on the combination of EEG and fMRI has been reported [12]. The high-density EEG as well as MRI/fMRI data were collected in separately examinations when the same subject was performing the same visually trigger finger-tapping task. By use of the linear inverse operator constrained by fMRI, the cortical current density was noninvasively estimated from EEG and then averaged to develop representative waveforms for pre-selected ROIs. DTF technique was applied to estimate the directional causality in various frequency bands among different ROIs, and the connectivity pattern was visualized in a subject-specific cortex reconstructed from MRIs (See Figure 4).
Figure 4.
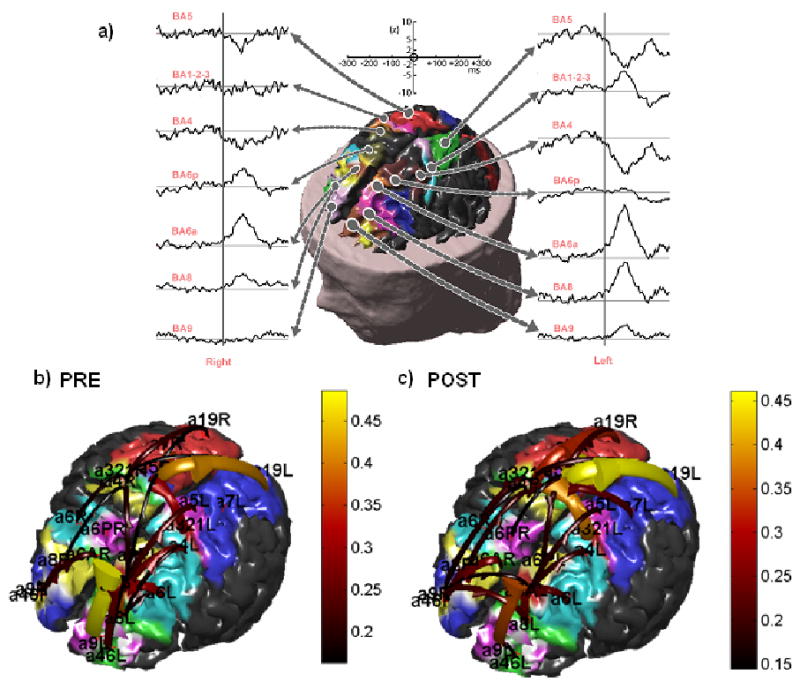
a) Estimates of the statistical significance of the cortical activity in selected ROIs depicted on the realistic representation of the cortex in a human subject. Such estimation was performed first by estimating the cortical activity with the use of the a priori information from fMRI during the solution of the linear inverse problem. Then, in order to obtain the statistical significance of cortical estimated waveforms, the z-score transformation was first applied and then represented. Note the z-score scale of the waveforms, ranging from 0 (the baseline) to 10; this latter value corresponding to a level of statistical significance equal to p < 10−7. The figure at the center shows the different ROIs drawn on different colors on the cortical surface reconstruction of the subject. b, c) Connectivity patterns estimated in the alpha frequency band by application of DTF on the estimated cortical waveforms in one subject. The connectivity estimates are relative to the period before the EMG onset b) and from the EMG to the end of recordings c). Each pattern is represented with arrows moving from one cortical area toward another. The color and size of the arrows code the level of strength of the functional connectivity observed between ROIs. The labels indicate the names of the ROIs employed. (from ref [12] with permission)
4. Discussion
Multimodal functional neuroimaging has received significant attention in the past decade and has already advanced our understanding of the spatiotemporal pattern of brain activation and connectivity underlying perception, motion and cognition. However, challenges still remain in several aspects.
Although the integration of fMRI and EEG/MEG has a sound physiological basis, it is still important to allow for the possibilities that electrical sources may be missing in fMRI, or that fMRI active regions produce no observable electromagnetic signals, or slight displacement between fMRI and EEG/MEG source locations. In general, these mismatches arise from the differences in physiological and physical rationales of these imaging modalities, as well as the spatiotemporal scales at which the brain processes are monitored [40, 41, 51–53].
Functional MRI reflects oxygen consumption and usually can observe the sustained neural activities that last at least tens of milliseconds to elicit detectable change of MR signal. But human brain can undergo rapidly shifting processes characterized by a temporal scale of a millisecond, which in principle can be “visible” in EEG or MEG. Also, a cortical patch can generate observable electromagnetic signals simply by increasing the firing synchronicity of a small percentage of neurons with little modification of its metabolic consumption, and therefore it may be missed in fMRI [51]. Conversely, EEG/MEG is more sensitive to sources at superficial cortical regions than deep sources that are relatively far away from the recording sensors. Such depth dependency often limits their capability to be visible to activities at deep sulci or subcortical regions, while the sensitivity of fMRI is relatively uniform in the whole brain volume. Even if we assume fMRI can reveal all the neural activations and all the activated neuron assemblies can generate observable EEG signals, there are still possible mismatches because of the difference in time scale to which these two imaging modalities are applied. EEG inverse is carried out at almost every single instant, but fMRI, in simplification, can be interpreted as the average or integral of the power of neural activity within a period of time. One can expect that at a region deemed active in fMRI can be “silent” at some time slices, as long as the activities at multiple areas are not completely in synchrony. The possible difference in the locations of neurons and the involved vessels can cause the slight displacement of fMRI “hotspots” from the real sources. Besides, the uncertainties of current dipole modeling on the curved cortical surface may not represent all the source location.
The potential distortion due to these mismatches or uncertainties should be considered in fMRI-EEG/MEG combined source analysis. In fMRI-guided equivalent dipole fitting, it may result in a significant estimation error if not all dipole locations are specified at fMRI foci. To address this problem, an extra independent current dipole, without any spatial constraint, is usually considered into the dipole fitting procedures to improve the reliability of source imaging against the possible fMRI-EEG disagreement [47]. In cortical current imaging, the Twomey regularization [55] has been proposed to reduce the distortion effect due to fMRI missing sources. Specifically, in which the fMRI-constrained solution is used as an initial estimate of cortical current density, and is subsequently adjusted by fitting it to the EEG data again without fMRI constraint but using Twomey regularization in an attempt to produce a more reliable solution [34]. Figure 5 shows the computer simulation results of this method in comparison with conventional fMRI-EEG integrated Wiener estimation, which suggest applying Twomey regularization can alleviate the distortion effect due to fMRI invisible sources.
Fig. 5.
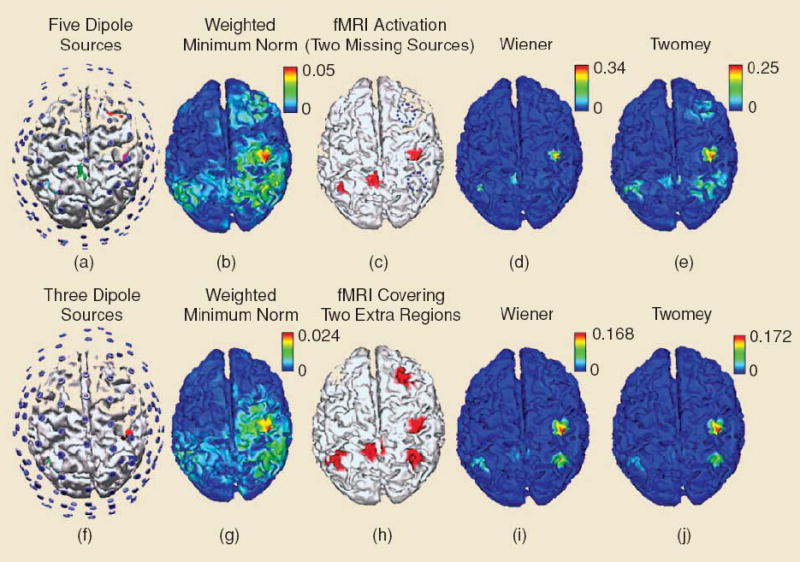
Typical examples of effects of fMRI invisible and fMRI extra sources on three cortical source imaging methods: EEG-alone weighted minimum norm, 90% fMRI-constrained Wiener filter and Twomey algorithm. The upper row shows the results of simulation on fMRI invisible sources; the lower for fMRI extra sources.”
Although both EEG and MEG can be combined with fMRI in theory, one important merit of EEG over MEG is the possibility of simultaneous acquisition of EEG and fMRI signals. This is particularly necessary for clinical application, such as in epilepsy studies, when the activity of interest cannot be reliably reproduced. Simultaneous data acquisition would in theory ensure EEG and fMRI reflect the exact same brain status. However, concurrent acquisition of EEG and fMRI has been proven to be very challenging since it is prone to large artifacts induced by the static and the time-variant fields of the MR scanner, as well as the accompanying acoustic noise [56, 57]. Specially designed mapping systems, and real-time and post-processing algorithms have been investigated and developed to avoid and/or remove the artifacts in order to obtain reasonable quality EEG [56, 58–61, 68]. Nevertheless, it still remains to be demonstrated that the simultaneous EEG-fMRI recording techniques can capture EEG activity as accurately as EEG-alone acquisition in clinical settings.
The further methodological development for EEG-fMRI integration requires a quantitative understanding of the coupling between hemodynamic response and electrophysiological activity is highly desired. This would probably require the extensive experimental studies by use of fMRI or optical imaging methods and invasive cortical and/or subcortical electrical recordings in animal models [62]. In the microscopic level, it may also be essential to interpret the functional data (such as BOLD-fMRI) by mathematically linking the membrane ionic currents, energy metabolism and blood oxygen transport [63].
Acknowledgments
This work was supported in part by NSF BES-0411898 and NIH R01 EB00178.
References
- 1.Nunez PL. Electric fields of the brain: the neurophysics of EEG. New York: Oxford University Press; 1981. [Google Scholar]
- 2.He B, editor. Modeling and Imaging of Bioelectric Activity – Principles and Applications. Kluwer Academic/Plenum Publishers; a: 2004. [Google Scholar]
- 3.He B, editor. Neural Engineering. Kluwer Academic/Plenum Publishers; 2005. [Google Scholar]
- 4.Hamalainen MS, Hari R, Ilmoniemi RJ, Knuutila J, Lounasmaa OV. Magnetoencephalography — theory, instrumentation, and applications to noninvasive studies of the working human brain. Rev Mod Phys. 1993 April;65:413-413–487. [Google Scholar]
- 5.He B. Brain electric source imaging: scalp Laplacian mapping and cortical imaging. Crit Rev Biomed Eng. 1999;27(3–5):149–188. [PubMed] [Google Scholar]
- 6.Belliveau JW, Kennedy DN, Jr, McKinstry RC, Buchbinder BR, Weisskoff RM, Cohen MS, Vevea JM, Brady TJ, Rosen BR. Functional mapping of the human visual cortex by magnetic resonance imaging. Science. 1991 Nov 1;254:716–719. doi: 10.1126/science.1948051. [DOI] [PubMed] [Google Scholar]
- 7.Kwong KK, Belliveau JW, Chesler DA, Goldberg IE, Weisskoff RM, Poncelet BP, Kennedy DN, Hoppel BE, Cohen MS, Turner R. Dynamic magnetic resonance imaging of human brain activity during primary sensory stimulation. Proc Natl Acad Sci USA. 1992 Jun 15;89:5675–5679. doi: 10.1073/pnas.89.12.5675. [DOI] [PMC free article] [PubMed] [Google Scholar]
- 8.Ogawa S, Tank DW, Menon R, Ellermann JM, Kim SG, Merkle H, Ugurbil K. Intrinsic signal changes accompanying sensory stimulation: functional brain mapping with magnetic resonance imaging. Proc Natl Acad Sci USA. 1992 Jul 1;89:5951–5955. doi: 10.1073/pnas.89.13.5951. [DOI] [PMC free article] [PubMed] [Google Scholar]
- 9.Dale AM, Halgren E. Spatiotemporal mapping of brain activity by integration of multiple imaging modalities. Curr Opin Neurobiol. 2001 Apr;11:202–208. doi: 10.1016/s0959-4388(00)00197-5. [DOI] [PubMed] [Google Scholar]
- 10.He B, Lian J. High-resolution spatio-temporal functional neuroimaging of brain activity. Crit Rev Biomed Eng. 2002;30(4–6):283–306. doi: 10.1615/critrevbiomedeng.v30.i456.30. [DOI] [PubMed] [Google Scholar]
- 11.Dale AM, Sereno MI. Improved localization of cortical activity by combining EEG and MEG with MRI cortical surface reconstruction: a linear approach. J Cogn Neurosci. 1993 May;5:162-162–176. doi: 10.1162/jocn.1993.5.2.162. [DOI] [PubMed] [Google Scholar]
- 12.Babiloni F, Cincotti F, Babiloni C, Carducci F, Mattia D, Astolfi L, Basilisco A, Rossini PM, Ding L, Ni Y, Cheng J, Christine K, Sweeney J, He B. Estimation of the cortical functional connectivity with the multimodal integration of high-resolution EEG and fMRI data by directed transfer function. NeuroImage. 2005 Jan 1;24:118–131. doi: 10.1016/j.neuroimage.2004.09.036. [DOI] [PubMed] [Google Scholar]
- 13.Hamalainen MS, Sarvas J. Realistic conductivity geometry model of the human head for interpretation of neuromagnetic data. IEEE Trans Biomed Eng. 1989 Feb;36:165–171. doi: 10.1109/10.16463. [DOI] [PubMed] [Google Scholar]
- 14.Cuffin BN. Effects of head shape on EEG’s and MEG’s. IEEE Trans Biomed Eng. 1990 Jan;37:44–52. doi: 10.1109/10.43614. [DOI] [PubMed] [Google Scholar]
- 15.He B, Musha T, Okamoto Y, Homma S, Nakajima Y, Sato T. Electric dipole tracing in the brain by means of the boundary element method and its accuracy. IEEE Trans Biomed Eng. 1987;34(6):406–414. doi: 10.1109/tbme.1987.326056. [DOI] [PubMed] [Google Scholar]
- 16.He B, Wang Y, Wu D. Estimating cortical potentials from scalp EEG’s in a realistically shaped inhomogeneous head model by means of the boundary element method. IEEE Trans Biomed Eng. 1999 Oct;46:1264–1268. doi: 10.1109/10.790505. [DOI] [PubMed] [Google Scholar]
- 17.Yan Y, Nunez PL, Hart RT. Finite-element model of the human head: scalp potentials due to dipole sources. Med Biol Eng Comput. 1991 Sep;29:475–481. doi: 10.1007/BF02442317. [DOI] [PubMed] [Google Scholar]
- 18.Le J, Gevins A. Method to reduce blur distortion from EEG’s using a realistic head model. IEEE Trans Biomed Eng. 1993 Jun;40:517–528. doi: 10.1109/10.237671. [DOI] [PubMed] [Google Scholar]
- 19.Haueisen J, Ramon C, Eiselt M, Brauer H, Nowak H. Influence of tissue resistivities on neuromagnetic fields and eletrical potentials studied with a finite element model of the head. IEEE Trans Biomed Eng. 1997;44(8):727–735. doi: 10.1109/10.605429. [DOI] [PubMed] [Google Scholar]
- 20.Zhang YC, Zhu SA, He B. A High-Order Finite Element Algorithm for Solving the Three-Dimensional EEG Forward Problem. Phys Med Biol. 2004;49(13):2975–2987. doi: 10.1088/0031-9155/49/13/014. [DOI] [PubMed] [Google Scholar]
- 21.He B, Zhang X, Lian J, Sasaki H, Wu D, Towle VL. Boundary element method-based cortical potential imaging of somatosensory evoked potentials using subjects’ magnetic resonance images. NeuroImage. 2002 Jul;16:564–576. doi: 10.1006/nimg.2002.1127. [DOI] [PubMed] [Google Scholar]
- 22.Zhang X, van Drongelen W, Hecox KE, Towle VL, Frim DM, McGee AB, He B. High-resolution EEG: cortical potential imaging of interictal spikes. Clin Neurophysiol. 2003 Oct;114:1963–1973. doi: 10.1016/s1388-2457(03)00194-9. [DOI] [PubMed] [Google Scholar]
- 23.Babiloni F, Babiloni C, Carducci F, Fattorini L, Anello C, Onorati P, Urbano A. High resolution EEG: a new model-dependent spatial deblurring method using a realistically-shaped MR-constructed subject’s head model. Electroencephalogr Clin Neurophysiol. 1997 Feb;102:69–80. doi: 10.1016/s0921-884x(96)96508-x. [DOI] [PubMed] [Google Scholar]
- 24.Barr RC, Ramsey M, 3rd, Spach MS. Relating epicardial to body surface potential distributions by means of transfer coefficients based on geometry measurements. IEEE Trans Biomed Eng. 1977 Jan;24:1–11. doi: 10.1109/TBME.1977.326201. [DOI] [PubMed] [Google Scholar]
- 25.Lian J, He B. A minimal product method and its application to cortical imaging. Brain Topogr. Spring 2001;13:209–217. doi: 10.1023/a:1007807203163. [DOI] [PubMed] [Google Scholar]
- 26.Sidman RD, Vincent DJ, Smith DB, Lee L. Experimental tests of the cortical imaging technique--applications to the response to median nerve stimulation and the localization of epileptiform discharges. IEEE Trans Biomed Eng. 1992 May;39:437–444. doi: 10.1109/10.135537. [DOI] [PubMed] [Google Scholar]
- 27.Wang Y, He B. A computer simulation study of cortical imaging from scalp potentials. IEEE Trans Biomed Eng. 1998 Jun;45:724–735. doi: 10.1109/10.678607. [DOI] [PubMed] [Google Scholar]
- 28.He B, Lian J, Spencer KM, Dien J, Donchin E. A cortical potential imaging analysis of the P300 and novelty P3 components. Hum Brain Mapp. 2001 Feb;12:120–130. doi: 10.1002/1097-0193(200102)12:2<120::AID-HBM1009>3.0.CO;2-V. [DOI] [PMC free article] [PubMed] [Google Scholar]
- 29.Dale AM, Fischl B, Sereno MI. Cortical surface-based analysis. I. Segmentation and surface reconstruction. NeuroImage. 1999 Feb;9:179–194. doi: 10.1006/nimg.1998.0395. [DOI] [PubMed] [Google Scholar]
- 30.Fuchs M, Wagner M, Kohler T, Wischmann HA. Linear and nonlinear current density reconstructions. J Clin Neurophysiol. 1999 May;16:267–295. doi: 10.1097/00004691-199905000-00006. [DOI] [PubMed] [Google Scholar]
- 31.Babiloni F, Babiloni C, Carducci F, Romani GL, Rossini PM, Angelone LM, Cincotti F. Multimodal integration of high-resolution EEG and functional magnetic resonance imaging data: a simulation study. NeuroImage. 2003 May;19:1–15. doi: 10.1016/s1053-8119(03)00052-1. [DOI] [PubMed] [Google Scholar]
- 32.He B, Yao D, Lian J. High-resolution EEG: on the cortical equivalent dipole layer imaging. Clin Neurophysiol. 2002 Feb;113:227–235. doi: 10.1016/s1388-2457(01)00740-4. [DOI] [PubMed] [Google Scholar]
- 33.He B, Yao D, Lian J, Wu D. An equivalent current source model and Laplacian weighted minimum norm current estimates of brain electrical activity. IEEE Trans Biomed Eng. 2002 Apr;49:277–288. doi: 10.1109/10.991155. [DOI] [PubMed] [Google Scholar]
- 34.Liu Z, Kecman F, He B. Effects of fMRI-EEG mismatches in cortical current density estimation integrating fMRI and EEG: a simulation study. Clin Neurophysiol. doi: 10.1016/j.clinph.2006.03.031. in press. [DOI] [PMC free article] [PubMed] [Google Scholar]
- 35.Ding L, Lai Y, He B. Low resolution brain electromagnetic tomography in a realistic geometry head model: a simulation study. Phys Med Biol. 2005 Jan 7;50:45–56. doi: 10.1088/0031-9155/50/1/004. [DOI] [PubMed] [Google Scholar]
- 36.Hamalainen MS, Ilmoniemi RJ. Interpreting measured magnetic fields of the brain: estimates of current distribution. Helsinki: University of Technology, Dept. of Technical Physics Report; 1984. [Google Scholar]
- 37.Wang JZ, Williamson SJ, Kaufman L. Magnetic source images determined by a lead-field analysis: the unique minimum-norm least-squares estimation. IEEE Trans Biomed Eng. 1992 Jul;39:665–675. doi: 10.1109/10.142641. [DOI] [PubMed] [Google Scholar]
- 38.Pascual-Marqui RD, Michel CM, Lehmann D. Low resolution electromagnetic tomography: a new method for localizing electrical activity in the brain. Int J Psychophysiol. 1994 Oct;18:49–65. doi: 10.1016/0167-8760(84)90014-x. [DOI] [PubMed] [Google Scholar]
- 39.Ding L, He B. 3-Dimensional Brain Source Imaging by Means of Laplacian Weighted Minimum Norm Estimate in a Realistic Geometry Head Model. Proc of Annual Int Conf of IEEE-EMBS. 2005:1430–1433. doi: 10.1109/IEMBS.2005.1616699. [DOI] [PubMed] [Google Scholar]
- 40.Liu AK, Belliveau JW, Dale AM. Spatiotemporal imaging of human brain activity using functional MRI constrained magnetoencephalography data: Monte Carlo simulations. Proc Natl Acad Sci USA. 1998 Jul 21;95:8945–8950. doi: 10.1073/pnas.95.15.8945. [DOI] [PMC free article] [PubMed] [Google Scholar]
- 41.Dale AM, Liu AK, Fischl BR, Buckner RL, Belliveau JW, Lewine JD, Halgren E. Dynamic statistical parametric mapping: combining fMRI and MEG for high-resolution imaging of cortical activity. Neuron. 2000 Apr;26:55–67. doi: 10.1016/s0896-6273(00)81138-1. [DOI] [PubMed] [Google Scholar]
- 42.Magistretti PJ, Pellerin L, Rothman DL, Shulman RG. Energy on demand. Science. 1999 Jan 22;283:496–497. doi: 10.1126/science.283.5401.496. [DOI] [PubMed] [Google Scholar]
- 43.Malonek D, Grinvald A. Interactions between electrical activity and cortical microcirculation revealed by imaging spectroscopy: implications for functional brain mapping. Science. 1996 Apr 26;272:551–554. doi: 10.1126/science.272.5261.551. [DOI] [PubMed] [Google Scholar]
- 44.Puce A, Constable RT, Luby ML, McCarthy G, Nobre AC, Spencer DD, Gore JC, Allison T. Functional magnetic resonance imaging of sensory and motor cortex: comparison with electrophysiological localization. J Neurosurg. 1995 Aug;83:262–270. doi: 10.3171/jns.1995.83.2.0262. [DOI] [PubMed] [Google Scholar]
- 45.Scherg M, von Cramon D. Two bilateral sources of the late AEPs as identified by a spatio-temporal dipole model. Electroenceph Clin Neurophysiol. 1985;62(1):32–44. doi: 10.1016/0168-5597(85)90033-4. [DOI] [PubMed] [Google Scholar]
- 46.Menon V, Ford JM, Lim KO, Glover GH, Pfefferbaum A. Combined event-related fMRI and EEG evidence for temporal-parietal cortex activation during target detection. Neuroreport. 1997 Sep 29;8:3029–3037. doi: 10.1097/00001756-199709290-00007. [DOI] [PubMed] [Google Scholar]
- 47.Ahlfors SP, Simpson GV, Dale AM, Belliveau JW, Liu AK, Korvenoja A, Virtanen J, Huotilainen M, Tootell RB, Aronen HJ, Ilmoniemi RJ. Spatiotemporal activity of a cortical network for processing visual motion revealed by MEG and fMRI. J Neurophysiol. 1999 Nov;82:2545–2555. doi: 10.1152/jn.1999.82.5.2545. [DOI] [PubMed] [Google Scholar]
- 48.Thees S, Blankenburg F, Taskin B, Curio G, Villringer A. Dipole source localization and fMRI of simultaneously recorded data applied to somatosensory categorization. NeuroImage. 2003 Mar;18:707–719. doi: 10.1016/s1053-8119(02)00054-x. [DOI] [PubMed] [Google Scholar]
- 49.Opitz B, Mecklinger A, Von Cramon DY, Kruggel F. Combining electrophysiological and hemodynamic measures of the auditory oddball. Psychophysiology. 1999 Jan;36:142–147. doi: 10.1017/s0048577299980848. [DOI] [PubMed] [Google Scholar]
- 50.Di Russo F, Pitzalis S, Spitoni G, Aprile T, Patria F, Spinelli D, Hillyard SA. Identification of the neural sources of the pattern-reversal VEP. NeuroImage. 2005 Feb 1;24:874–886. doi: 10.1016/j.neuroimage.2004.09.029. [DOI] [PubMed] [Google Scholar]
- 51.Babiloni F, Cincotti F. Multimodal imaging from neuroelectromagnetic and functional magnetic resonance recordings. In: He B, editor. Modeling and Imaging of Bioelectric Activity: Principles and Applications. 1. USA: Kluwer Academic/Plenum Publishers; 2004. pp. 251–280. [Google Scholar]
- 52.Vitacco D, Brandeis D, Pascual-Marqui R, Martin E. Correspondence of event-related potential tomography and functional magnetic resonance imaging during language processing. Hum Brain Mapp. 2002 Sep;17:4–12. doi: 10.1002/hbm.10038. [DOI] [PMC free article] [PubMed] [Google Scholar]
- 53.Liu AK, Dale AM, Belliveau JW. Monte Carlo simulation studies of EEG and MEG localization accuracy. Hum Brain Mapp. 2002 May;16:47–62. doi: 10.1002/hbm.10024. [DOI] [PMC free article] [PubMed] [Google Scholar]
- 54.Astolfi L, Babiloni C, Carducci F, Cincotti F, Basilisco A, Rossini PM, Salinari S, Cerutti S, Ben Dayan D, Ding L, Ni Y, He B, Babiloni F. Estimation of the cortical connectivity by high resolution EEG and structural equation modeling: simulations and application to finger tapping data. IEEE Trans Biomed Eng. 2005;52(5):754–768. doi: 10.1109/TBME.2005.845371. [DOI] [PubMed] [Google Scholar]
- 55.Twomey S. On the numerical solution of Fredholm integral equations of the first kind by the inversion of the linear system produced by qudarature. J Assoc Comput Mach. 1963;10(1):97–101. [Google Scholar]
- 56.Goldman RI, Stern JM, Engel J, Jr, Cohen MS. Acquiring simultaneous EEG and functional MRI. Clin Neurophysiol. 2000 Nov;111:1974–1980. doi: 10.1016/s1388-2457(00)00456-9. [DOI] [PubMed] [Google Scholar]
- 57.Novitski N, Anourova I, Martinkauppi S, Aronen HJ, Naatanen R, Carlson S. Effects of noise from functional magnetic resonance imaging on auditory event-related potentials in working memory task. NeuroImage. 2003 Oct;20:1320–1328. doi: 10.1016/S1053-8119(03)00390-2. [DOI] [PubMed] [Google Scholar]
- 58.Allen PJ, Polizzi G, Krakow K, Fish DR, Lemieux L. Identification of EEG events in the MR scanner: the problem of pulse artifact and a method for its subtraction. NeuroImage. 1998 Oct;8:229–239. doi: 10.1006/nimg.1998.0361. [DOI] [PubMed] [Google Scholar]
- 59.Allen PJ, Josephs O, Turner R. A method for removing imaging artifact from continuous EEG recorded during functional MRI. NeuroImage. 2000 Aug;12:230–239. doi: 10.1006/nimg.2000.0599. [DOI] [PubMed] [Google Scholar]
- 60.Garreffa G, Carni M, Gualniera G, Ricci GB, Bozzao L, De Carli D, Morasso P, Pantano P, Colonnese C, Roma V, Maraviglia B. Real-time MR artifacts filtering during continuous EEG/fMRI acquisition. Magn Reson Imaging. 2003 Dec;21:1175–1189. doi: 10.1016/j.mri.2003.08.019. [DOI] [PubMed] [Google Scholar]
- 61.Ellingson ML, Liebenthal E, Spanaki MV, Prieto TE, Binder JR, Ropella KM. Ballistocardiogram artifact reduction in the simultaneous acquisition of auditory ERPS and fMRI. NeuroImage. 2004 Aug;22:1534–1542. doi: 10.1016/j.neuroimage.2004.03.033. [DOI] [PubMed] [Google Scholar]
- 62.Logothetis NK, Pauls J, Augath M, Trinath T, Oeltermann A. Neurophysiological investigation of the basis of the fMRI signal. Nature. 2001 Jul 12;412:150–157. doi: 10.1038/35084005. [DOI] [PubMed] [Google Scholar]
- 63.Aubert A, Costalat R. A model of the coupling between brain electrical activity, metabolism, and hemodynamics: application to the interpretation of functional neuroimaging. NeuroImage. 2002 Nov;17:1162–1181. doi: 10.1006/nimg.2002.1224. [DOI] [PubMed] [Google Scholar]
- 64.Dale AM, Fischl B, Sereno MI. Cortical surface-based analysis. I. Segmentation and surface reconstruction. NeuroImage. 1999 Feb;9:179–194. doi: 10.1006/nimg.1998.0395. [DOI] [PubMed] [Google Scholar]
- 65.Tuch DS, Wedeen VJ, Dale AM, George JS, Belliveau JW. Conductivity tensor mapping of the human brain using diffusion tensor MRI. Proc Natl Acad Sci USA. 2001 Sept;98:11697–11701. doi: 10.1073/pnas.171473898. [DOI] [PMC free article] [PubMed] [Google Scholar]
- 66.Lin F, Witzel T, Hämäläinen MS, Dale AM, Belliveau JW, Stufflebeam SM. Spectral spatiotemporal imaging of cortical oscillations and interactions in the human brain. NeuroImage. 2004 Sept;23:582–595. doi: 10.1016/j.neuroimage.2004.04.027. [DOI] [PMC free article] [PubMed] [Google Scholar]
- 67.Im C-H, Liu Z, Zhang N, Chen W, He B. Functional cortical imaging from simultaneously recorded ERP and fMRI. J Neurosci Meth. doi: 10.1016/j.jneumeth.2006.03.015. doi:10.1016/j.jneumeth.2006.03.015, in press. [DOI] [PMC free article] [PubMed] [Google Scholar]
- 68.Zhang Y, Ding L, van Drongelen W, Hecox K, Frim DM, He B. A cortical potential imaging study from simultaneous extra- and intracranial electrical recordings by means of the finite element method. NeuroImage. doi: 10.1016/j.neuroimage.2006.02.027. doi:101016/jneuroimage200602027, in press. [DOI] [PMC free article] [PubMed] [Google Scholar]