Abstract
Latitudinal species diversity gradients (LSDGs) in the Northern Hemisphere are the most well established biogeographic patterns on Earth. Despite long-standing interest in LSDGs as a central problem in ecology, their explanation remains uncertain. In terrestrial as well as coastal and pelagic marine ecosystems, these poleward declines in diversity typically have been represented and interpreted in terms of species richness, the number of coexisting species. Newly discovered LSDGs in the bathyal (500–4,000 m) benthos of the North Atlantic may help to resolve the underlying causes of these large-scale trends because the deep sea is such a physically distinct environment. However, a major problem in comparing surface and deep-sea LSDGs is that the latter have been measured differently, by using species diversity indices that are affected by both species richness and the evenness of relative abundance. Here, we demonstrate that deep-sea isopods, gastropods, and bivalves in the North Atlantic do exhibit poleward decreases in species richness, just as those found in other environments. A comprehensive systematic revision of the largest deep-sea gastropod family (Turridae) has provided a unique database on geographic distributions that is directly comparable to those used to document LSDGs in surface biotas. This taxon also shows a poleward decline in the number of species. Seasonal organic enrichment from sinking phytodetritus is the most plausible ecological explanation for deep-sea LSDGs and is the environmental factor most consistently associated with depressed diversity in a variety of bathyal habitats.
New theoretical perspectives on large-scale biogeographic phenomena (1, 2) and the global biodiversity crisis (3, 4) have refocused the attention of ecologists on one of the most conspicuous and still perplexing patterns in nature—latitudinal species diversity gradients (LSDGs). In the Northern Hemisphere, these poleward declines in diversity are well known for the biotas of terrestrial (5), fresh-water (6), coastal-marine (7), and open-ocean pelagic (8) environments. Recently, LSDGs were discovered in the deep sea (9–12), an environment long considered to be uniform throughout and insulated from the global climatic gradients that ultimately appear to shape major biogeographic patterns in surface ecosystems.
An important difficulty in comparing deep-sea and surface LSDGs is that fundamentally different methods have been used to assess species diversity. In terrestrial and shallow marine habitats, patterns of diversity traditionally have been measured in terms of species richness, the number of coexisting species per unit area or within a latitudinal band, compiled from distributional maps of individual species. This approach is possible because the long history of exploration and taxonomic research in these accessible environments has permitted reasonably accurate descriptions of species' ranges. In contrast, large-scale patterns of community structure in the deep sea have been detected by deploying remote sampling gear and then applying diversity indices to species-abundance data acquired from individual samples. Because most of the deep ocean remains unexplored, our knowledge of species' geographic distributions is scanty for most taxa. The measure of diversity used most commonly in deep-sea ecology, including studies of latitudinal gradients, is the normalized expected number of species E(Sn) or rarefaction (13, 14). E(Sn) can be affected by both species richness and the evenness of relative abundance distributions. Because of this, it has been questioned whether LSDGs in the deep sea actually reflect variation in species richness, as in surface environments, or are merely shifts in relative abundance distributions (15, 16). Here, we examine latitudinal patterns of diversity in the deep North Atlantic by comparing the richness and evenness components of a diversity index applied to three macrofaunal taxa and by variation in the number of coexisting species in the largest family of gastropods.
The Species-Richness Component of Diversity.
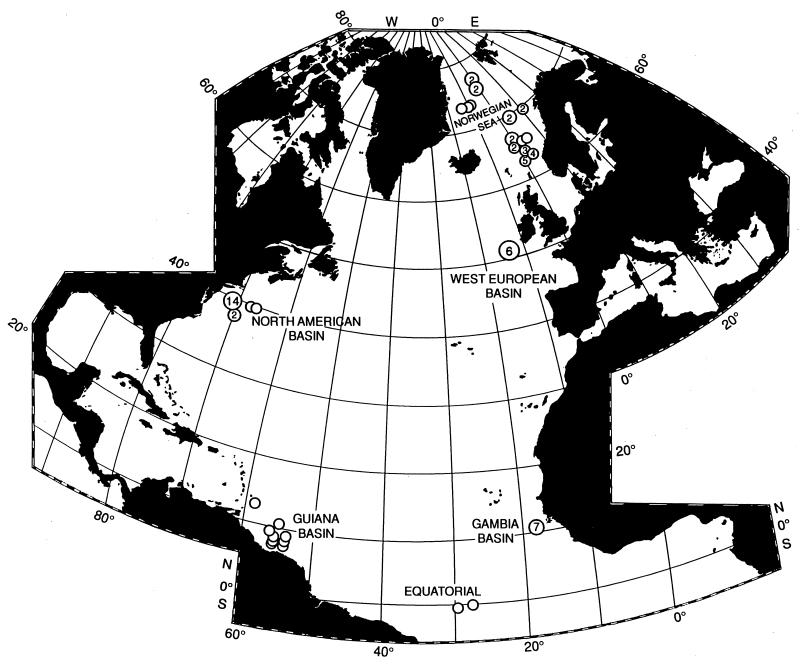
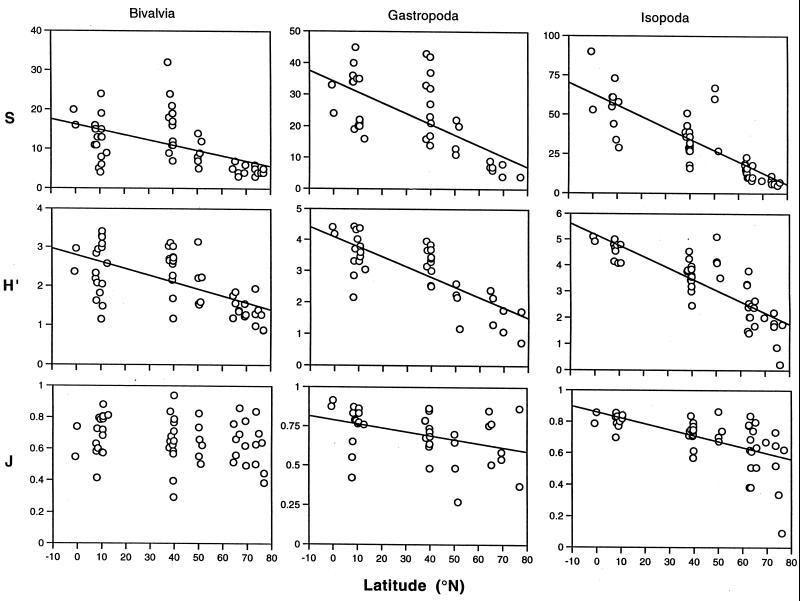
The most commonly used diversity measure, the Shannon–Wiener information function (H′), can be partitioned into components of species richness (S) and evenness (J). We compare the relative impact of richness and evenness on H′ for bivalves, gastropods, and isopods, collected from bathyal depths (500–4,000 m) in the North Atlantic and Norwegian Sea (Fig. 1). For these three taxa, H′ is very highly correlated (r = 0.902–0.951, P < 0.001) with E(Sn), the diversity measure most frequently applied in deep-sea ecology and the one originally used to reveal latitudinal patterns (9). Fig. 2 shows S, H′, and J plotted against latitude for the three taxa. S and H′ are highly correlated with latitude in all taxa (see Fig. 2 legend). J is significantly correlated with latitude for isopods, albeit at a lower level than S and H′, but is only weakly correlated (P < 0.05) with latitude in gastropods and is uncorrelated with latitude in bivalves. Species richness remains highly correlated with latitude when the effects of evenness are removed by partial regression analysis (r = 0.721, 0.702, and 0.531, P < 0.001, respectively). In contrast, when the effects of S are removed, evenness is weakly correlated with latitude in isopods (r = 0.325, P < 0.05), correlated at a lower level in gastropods (r = 0.451, P < 0.01), and uncorrelated in bivalves (r = 0.246, not significant). Results suggest that deep-sea LSDGs in all three of these macrofaunal taxa in the North Atlantic largely do reflect species richness and that there remains a subordinate independent decrease in evenness at higher latitudes in gastropods and isopods. Species richness in an important deep-sea meiofaunal taxon, the foraminiferans, also shows latitudinal gradients at bathyal depths in the North and South Atlantic (12).
Figure 1.
Sampling localities used to analyze latitudinal gradients of species diversity in deep-sea isopods, gastropods, and bivalves in the North Atlantic and Norwegian Sea. All 71 samples were collected with epibenthic sleds (17). Circled numbers indicate the number of samples taken in that region. Circles without numbers represent individual samples.
Figure 2.
Latitudinal gradients of species diversity in deep-sea isopods, gastropods, and bivalves from the North Atlantic and Norwegian Sea measured as: S, the number species; H′, the Shannon–Wiener information function; and J, Pielou's evenness (18). For bivalves, gastropods, and isopods, respectively, correlation coefficients for S are r = −0.512, r = −0.670, and r = −0.801 (all P < 0.001); for H′, r = −0.597, r = −0.775 and r = −0.829 (all P < 0.001); for J, r = −0.184 (not significant), r = −0.384 (P < 0.05), and r = −0.577 (P < 0.001). Fitted least-square regression lines are shown, except J for bivalves, which is insignificant. Data are from refs. 9, 19, and 20.
The Number of Coexisting Species.
A comprehensive systematic revision of eastern North Atlantic Turridae (21) provides a database that is directly comparable to those used in terrestrial and coastal studies of LSDGs. The Turridae is the largest family of deep-sea gastropods. It represents a guild of species that are specialized predators on polychaete worms. The revision includes the turrid fauna east of the Mid-Atlantic Ridge extending from the Azores northward into the Norwegian Sea. It is based on material from 1,315 trawl samples collected over a century beginning with the pioneering British Lightning and Porcupine Expeditions (1868–1870).
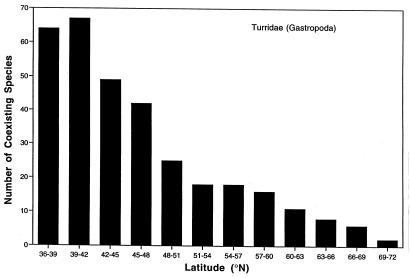
To assess patterns of diversity, we recorded the latitudinal ranges of species and then summed the number of coexisting species within 3° latitudinal bands from 36°N to 72°N, the principal region covered by the systematic revision. We used locality records between 500 and 4,000 m to make the analysis geographically consistent with the above results based on diversity measures applied to individual samples. The bathyal data set contains 93 species. Species richness measured this way shows a significant poleward decline (Fig. 3; Spearman's rank order correlation, rs = −0.991, P = 0.0010). The latitudinal relationships are also significant when measured over depth increments of 500–1,000 m (rs = −0.910, P = 0.0025), 1,000–2,000 m (rs = −0.982, P = 0.0032), 2,000–3,000 m (rs = −0.912, P = 0.0025), and >3,000 m (rs = −0.819, P = 0.0066), indicating that they hold throughout the bathyal region.
Figure 3.
A latitudinal gradient of the number of coexisting species in the gastropod family Turridae from the eastern North Atlantic and Norwegian Sea (19, 21). The number of species is estimated as the number of species ranges that span 3° intervals of latitude.
Estimating diversity by using the full documented latitudinal ranges of individual species assumes that species actually occupy the area within the perimeter of their known ranges. The method overestimates diversity at any particular latitudinal band because most species do not have continuous distributions in nature. We repeated the analysis by using only the actual observations of species that fall within latitudinal bands. The relationship of species richness to latitude remains significant (rs = −0.854, P = 0.0046). This method may underestimate diversity because of sampling error associated with collecting individuals of a particular turrid species within some latitudinal band by using remote sampling gear. The real level of diversity at some latitude is probably somewhere between estimates from the two methods—both of which yield significant patterns.
The Scale of Diversity Measurement.
Comparing the method using diversity indices on samples of communities with the more traditional way of counting the number of coexisting species from long-term surveys provides an interesting caveat about portraying and understanding biogeographic patterns. In the latter method, the picture of a species' range is built up through numerous observations at different sites over a long period of time, sometimes centuries. For purposes of biogeographic analysis, populations of species often are inferred to inhabit the entire known range. In reality, of course, populations depend on the availability of suitable habitat and are discontinuous in space. Also, distributional patterns can shift dramatically even on the human time scale of observation. Species richness for a taxon is calculated as the number of ranges that overlap in some large geographic quadrat or latitudinal band often representing hundreds of kilometers. This approach essentially averages diversity over immense scales of time and space. This is why Fig. 3 and many classic textbook cases of LSDGs look so convincing and regular. However, this composite image of LSDGs is somewhat illusory. The loss of information on spatiotemporal variation in diversity within geographic areas implicit in the method is probably one reason why LSDGs remain such an intractable problem. It is not possible to statistically partition the variation in diversity among potential causes operating at different scales because variation is obscured except at very large scales. The data become too simplified to interpret, other than to point out that a variety of global environmental gradients correspond to LSDGs.
Using diversity estimates based on synoptic individual samples of communities presents an impression of more variation in diversity (Fig. 2). It is, however, more accurate and useful in the sense that the patterns include variation on both small and large scales, and the processes that cause these patterns are likely to operate on a variety of scales. The information can be partitioned among geographic axes such as depth and latitude (9, 22) and among ecological variables in a way that more realistically matches the scales of evolutionary and ecological mechanisms to variation in species diversity (23). Because communities appear to show high variation in diversity on all scales (e.g., Fig. 2), a large database is necessary to detect statistically meaningful patterns.
Potential Implications.
We stress that our knowledge of large-scale biogeographic patterns in the deep sea is still based on only several invertebrate taxa and limited sampling. In the North Atlantic, LSDGs in these taxa do appear to reflect variation in species richness, just as in other environments. Many theories have been proposed to explain LSDGs (5), but they remain stubbornly enigmatic. One approach to reconciling the theories, or at least narrowing the field of explanations, is to compare congruent patterns among different ecosystems to find whether there are common environmental factors that consistently predict relative diversity. The deep sea might play a significant role in such a comparison. Deep-sea and terrestrial biotas have distinct evolutionary histories and experience the Earth's climate in fundamentally different ways. Deep-sea communities are exposed to the indirect effects of seasonal variation in surface production through sinking phytodetritus as a food source, but not the physical climatic variations that are thought to shape large-scale biogeographic patterns in terrestrial environments.
Patterns of biodiversity at these very large scales in the deep sea may reflect both ecological and historical phenomena (9, 22). Little is known about evolution in the deep sea, though geographic differences in the invasion, radiation, and spread of taxa have been discussed as possible causes of biogeographic patterns in all three macrofaunal groups analyzed here (10, 11, 24). The most consistent ecological factor associated with depressed diversity in bathyal soft-sediment habitats appears to be some form of pulsed nutrient loading. Examples include areas that experience periodic high organic flux to the seabed associated with upwelling (25), lateral transport (26), or proximity to oxygen-minimum zones (27). Low diversity also occurs where bottom topography concentrates sinking food resources, such as in submarine canyons (28) and trenches (29), and where episodic, strong, near-bottom currents increase food availability by exposing reactive sediments (30). The historical development of LSDGs in deep-sea foraminiferans has been linked to the onset of seasonal production that attended global cooling during the early Cenozoic (31). LSDGs in modern bathyal faunas of the North Atlantic correspond to a poleward increase in the annual rate and seasonality of surface production in the North Atlantic (32–34), suggesting the possibility that seasonal organic enrichment from sinking phytodetritus contributes to limiting diversity at higher latitudes (9, 12).
Acknowledgments
We thank John Allen and Howard Sanders for data on bivalves and George Wilson and Robert Hessler for data on isopods. The gastropod assemblages analyzed here were collected by vessels of the Woods Hole Oceanographic Institution and were made available by Howard Sanders. Ron Etter read several versions of the manuscript. Sir Robert May and two anonymous reviews provided very useful critiques. This research was supported by a National Science Foundation grant (OCE-9301687) and was influenced by a workshop (Deep-Sea Biodiversity: Pattern and Scale) conducted at the National Center for Ecological Analysis and Synthesis, a Center funded by the National Science Foundation (DEB-94–21535), the University of California, Santa Barbara, and the State of California.
Abbreviation
- LSDG
latitudinal species diversity gradient
Footnotes
Article published online before print: Proc. Natl. Acad. Sci. USA, 10.1073/pnas.050589497.
Article and publication date are at www.pnas.org/cgi/doi/10.1073/pnas.050589497
References
- 1.Ricklefs R E, Schluter D, editors. Species Diversity in Ecological Communities: Historical and Geographical Perspectives. Chicago: Chicago Univ. Press; 1993. [Google Scholar]
- 2.Rosenzweig M L. Species Diversity in Space and Time. Cambridge: Cambridge Univ. Press; 1995. [Google Scholar]
- 3.Lubchenco J, Olson A M, Brubaker L B, Carpenter S R, Holland M M, Hubbell S P, Levin S A, MacMahon J A, Matson P A, Melillo J M, et al. Ecology. 1991;72:371–412. [Google Scholar]
- 4.Heywood V H, editor. Global Biodiversity Assessment. Cambridge: Cambridge Univ. Press; 1995. [Google Scholar]
- 5.Stevens G C. Am Nat. 1989;133:240–256. [Google Scholar]
- 6.France R. Am Nat. 1992;139:342–354. [Google Scholar]
- 7.Roy K, Jablonski D, Valentine J W, Rosenberg G. Proc Natl Acad Sci USA. 1998;95:3699–3702. doi: 10.1073/pnas.95.7.3699. [DOI] [PMC free article] [PubMed] [Google Scholar]
- 8.Angel M V. In: Marine Biodiversity: Patterns and Processes. Ormond R F G, Gage J D, Angel M V, editors. Cambridge: Cambridge Univ. Press; 1997. [Google Scholar]
- 9.Rex M A, Stuart C T, Hessler R R, Allen J A, Sanders H L, Wilson G D F. Nature (London) 1993;365:636–639. [Google Scholar]
- 10.Stuart C T, Rex M A. In: Reproduction, Larval Biology, and Recruitment of the Deep-Sea Benthos. Young C M, Eckelbarger K J, editors. New York: Columbia Univ. Press; 1994. [Google Scholar]
- 11.Wilson G D F. Deep-Sea Res II. 1998;45:279–301. [Google Scholar]
- 12.Culver S J, Buzas M A. Deep-Sea Res I. 2000;47:259–275. [Google Scholar]
- 13.Sanders H L. Am Nat. 1968;102:243–282. [Google Scholar]
- 14.Hurlbert S H. Ecology. 1971;52:577–586. doi: 10.2307/1934145. [DOI] [PubMed] [Google Scholar]
- 15.May R M. Nature (London) 1993;361:598. [Google Scholar]
- 16.Gage J D, May R M. Nature (London) 1993;365:609–610. [Google Scholar]
- 17.Hessler R R, Sanders H L. Deep-Sea Res. 1967;14:65–78. [Google Scholar]
- 18.Magurran A E. Ecological Diversity and Its Measurement. Princeton: Princeton Univ. Press; 1988. [Google Scholar]
- 19.Bouchet P, Warén A. Sarsia. 1979;64:211–243. [Google Scholar]
- 20.Svavarsson J, Brattegard T, Strömberg J O. Prog Oceanogr. 1990;24:297–310. [Google Scholar]
- 21.Bouchet P, Warén A. J Moll Stud Suppl. 1980;8:1–119. [Google Scholar]
- 22.Rex M A, Etter R J, Stuart C T. In: Marine Biodiversity: Patterns and Processes. Ormond R F G, Gage J D, Angel M V, editors. Cambridge: Cambridge Univ. Press; 1997. [Google Scholar]
- 23.Cotgreave P, Harvey P H. J Anim Ecol. 1994;63:365–374. [Google Scholar]
- 24.Allen J A, Sanders H L. Prog Oceanogr. 1996;38:95–153. [Google Scholar]
- 25.Sanders H L. Brookhaven Symp Biol. 1969;12:71–81. [PubMed] [Google Scholar]
- 26.Blake J A, Hilbig B. Deep-Sea Res II. 1994;41:875–899. [Google Scholar]
- 27.Levin L A, Gage J D. Deep-Sea Res II. 1998;45:129–163. [Google Scholar]
- 28.Vetter E W, Dayton P K. Deep-Sea Res II. 1998;45:25–54. [Google Scholar]
- 29.Jumars P A, Hessler R R. J Mar Res. 1976;34:547–560. [Google Scholar]
- 30.Aller J Y. Deep-Sea Res. 1997;44:39–69. [Google Scholar]
- 31.Thomas E, Gooday A J. Geology. 1996;24:355–358. [Google Scholar]
- 32.Campbell J W, Aarup T. Deep-Sea Res. 1992;39:1669–1694. [Google Scholar]
- 33.Sathyendranath S, Longhurst A, Caverhill C M, Platt T. Deep-Sea Res. 1995;42:1773–1802. [Google Scholar]
- 34.Falkowski P G, Barber R T, Smetacek V. Science. 1998;281:200–206. doi: 10.1126/science.281.5374.200. [DOI] [PubMed] [Google Scholar]


