Abstract
The MDM2 oncogene encodes an inhibitor of the p53 tumor suppressor protein that regulates p53 in a negative feedback loop. MDM2 gene amplification and overexpression occur in several types of tumors and are often associated with poor prognosis. An MDM2 antisense phosphorothioate oligodeoxynucleotide has been identified that effectively inhibits MDM2 expression in tumor cells containing MDM2 gene amplifications. Antisense inhibition of MDM2 is associated with a decrease in MDM2–p53 complex formation, increase in p53-inducible gene expression, increase in p53 transcriptional activity, and apoptosis. Significantly, inhibition of MDM2 expression enhances the activation of p53 by a DNA-damaging cancer chemotherapy agent in a synergistic fashion. Therefore, the MDM2 negative feedback pathway is an important limiting factor in DNA damage-induced p53 activation. MDM2 antisense oligonucleotides may be useful as antitumor agents alone or as enhancers of other conventional DNA-damaging drugs.
Keywords: antisense oligonucleotide, oncogene, tumor suppressor
The MDM2 oncogene was first cloned as an amplified gene on a murine double-minute chromosome in the 3T3DM cell line, a spontaneously transformed derivative of BALB/c 3T3 cells (1). The gene encodes a 489-amino acid polypeptide that contains a p53 binding domain, an acidic region, and three putative zinc-binding motifs (one zinc-finger and one RING-finger). Overexpression of the MDM2 gene in NIH 3T3 cells increases the tumorigenic potential of these cells, thus establishing MDM2 as an oncogene (1). The MDM2 gene can immortalize rat embryo fibroblasts and cooperate with the activated ras oncogene to transform these cells (2). The MDM2 gene is amplified or overexpressed in about 40–60% of human osteogenic sarcomas and about 30% of soft tissue sarcomas (3, 4), implicating its role in the development of these malignancies.
An important function of MDM2 is to bind to the p53 tumor suppressor protein, inhibiting its ability to act as a transcription factor (5). p53 also activates MDM2 expression at the level of transcription (6, 7), suggesting that MDM2 can function as a negative feedback regulator of p53. Mouse embryos with inactivated MDM2 alleles die shortly after implantation. However, mice carrying inactivated MDM2 and p53 are viable (8, 9). This suggests that an important function of MDM2 is to negatively regulate p53. In cell culture experiments, MDM2 overexpression abrogates the ability of p53 to induce cell cycle arrest and apoptosis (10, 11). In addition to regulating p53, MDM2 has been shown to bind to the retinoblastoma protein pRB (12), E2F (13), ribosomal protein L5 (14), and RNA (15) and regulate the MyoD transcription factor (16). These activities may also be responsible for or contribute to the transforming properties of MDM2.
MDM2 is also a substrate for an apoptosis-specific protease (Caspase-3) during apoptosis (17, 18). Apoptotic cleavage inactivates the RNA binding function of MDM2 without affecting p53 binding (18). The cleavage by the apoptosis protease is an evolutionarily conserved feature of MDM2, suggesting that MDM2 has functions that are incompatible with rapid cell death. These functions may also contribute to the malignant phenotypes in tumors overexpressing MDM2.
Tumors containing MDM2 gene amplification often have wild-type p53 (19), presumably inactivated by MDM2. This suggests that inhibition of MDM2 expression in these tumors may lead to activation of p53 and, possibly, cell death. Furthermore, approximately half of the tumors still contain genotypically wild-type p53 (including many of those overexpressing MDM2). The p53 in these tumors may mediate some of the cytotoxic effects of DNA-damaging cancer treatments. If the MDM2 negative feedback loop is an important modulator of p53 activity during DNA damage, inhibition of MDM2 expression may increase the magnitude of p53 activation, thus enhancing the cytotoxic effects of DNA damage.
In this report, we describe the identification and characterization of an MDM2 antisense phosphorothioate oligodeoxynucleotide that inhibits MDM2 expression in tumor cells containing MDM2 gene amplifications. Inhibition of MDM2 expression can result in the activation of p53 and apoptosis. Furthermore, inhibition of MDM2 expression can cooperate with a DNA-damaging agent to induce p53 activity to high levels.
MATERIALS AND METHODS
Synthesis of Oligonucleotides.
Oligonucleotides were synthesized using β-cyanoethyl phosphoramidite chemistry on an automated synthesizer (Expedite 8909, PerSeptive Biosystems, Framingham, MA) and purified by preparative reverse-phase HPLC. Purity was determined by capillary gel electrophoresis, 31P NMR, and mass spectrometry to be greater than 99%. Nine 20-mer antisense oligonucleotides were synthesized based on the human MDM2 coding region sequences and screened. The sequence of HDMAS5 is GATCACTCCCACCTTCAAGG; the sequence of M4 is GATGACTCACACCATCATGG. The sequences of other oligonucleotides can be provided upon request.
Cells and Reagents.
The JAR, SJSA (formerly OSA-CL), and MCF-7 cells were obtained from the American Type Culture Collection. CPT was purchased from the Midwest Co. (Beijing, China) and purity of the drug was determined by mass spectrometry to be greater than 98%.
Plasmids and Antibodies.
The BP100–luciferase reporter plasmid, anti-MDM2 serum, anti-human p21 serum, and Pab421 were provided by Dr. A. J. Levine. The thymidine kinase–luciferase reporter was provided by Dr. W. Vedeckis. The anti-MDM2 monoclonal antibody 2A10 was described previously (20).
Antisense Oligonucleotide Treatment.
Cells were cultured in DMEM with 10% fetal bovine serum (FBS). Before addition of oligonucleotides, cells were refed with DMEM containing 1% FBS. Lipofectin (GIBCO/BRL) was incubated with serum-free DMEM medium at room temperature for 45 min and then mixed with oligonucleotides for 10 min and added to the culture. The final concentration of Lipofectin was 7 μg/ml, and final concentration of FBS was 0.75%. Controls labeled as “No oligo” in the figures were all treated with Lipofectin alone.
Western Blot Analysis.
Western blot analysis was performed as previously described (18). Cell lysates containing identical amounts of protein were immunoprecipitated using antibodies against the antigen as specified. The immunoprecipitates were fractionated by SDS-PAGE and transferred to Immobilon P filters (Millipore). The filters were incubated with 1/500 dilution of polyclonal antibodies (anti-MDM2 or anti-p21) or 1/50 dilution of Pab421 hybridoma supernatant (anti-p53). The filters were then incubated with 0.2 μCi/ml 125I-protein A (Amersham), washed, and exposed to x-ray films. All incubations were carried out in PBS with 5% nonfat milk and 0.1% Tween 20.
Northern Blot Analysis.
Total cellular RNA was isolated by using the RNeasy Kit (Qiagen). Twenty micrograms of total RNA were fractionated on a formaldehyde denaturing gel and transferred onto a Biotrans membrane (ICN). The filter was hybridized with a random-primed probe synthesized using a 1350-bp MDM2 cDNA fragment (from the start codon to the NcoI site at codon 450). Hybridization was carried out in a buffer containing 1% SDS, 1 M NaCl, and 10% dextransulfate for 18 h at 65°C. The filter was washed with 2× SSC buffer (0.3 M NaCl, 0.03 M sodium-citrate) and exposed against film. For detection of glyceraldehyde-phosphate dehydrogenase (GAPDH) mRNA, the filter was stripped and rehybridized with a full-length 1.2-kb human GAPDH cDNA probe.
Detection of Internucleosomal DNA Cleavage.
Floating cells were harvested from the treated and control plates. The cell pellets were incubated in a digestion buffer (100 mM NaCl/10 mM Tris-HCl, pH 8.0/1 mM EDTA/0.5% SDS/0.2 mg/ml proteinase K) at 37°C for 18 h. The lysate was extracted with phenol-chloroform, and the DNA was precipitated with 2 volumes of isopropanol. The DNA precipitate was dissolved in 50 μl of TE with 50 μg/μl RNase A and incubated for 15 min at 37°C. Sample buffer (5× buffer: 50% glycerol/0.1 M Tris-HCl, pH 7.5/0.1% SDS/0.1 M EDTA/0.01% xylene cyanole/0.01% bromphenol blue) was added, and the DNA was fractionated on a 2% agarose gel. The gel was stained with 0.5 μg/ml ethidium bromide for 30 min and destained for 2 h in H2O.
DNA Damage Treatment and Luciferase Assay.
Camptothecin (CPT) was dissolved in PBS containing 25% DMSO. The solution was added to the cell culture medium at indicated concentrations simultaneously with the addition of oligonucleotide–Lipofectin mixture. After the incubation, luciferase activities were determined using a luciferase assay kit (Tropix, Bedford, MA).
RESULTS
Antisense Inhibition of MDM2 Expression.
Antisense phosphorothioate oligodeoxynucleotides specific against human MDM2 were tested for inhibition of MDM2 expression in two cell lines: JAR (choriocarcinoma) and SJSA (osteosarcoma) (3, 21). Both cell lines contain amplified MDM2 genes, overexpression of MDM2 protein, and wild-type p53.
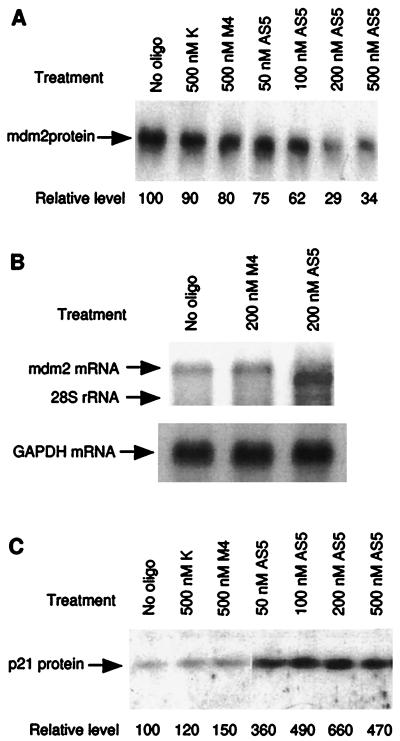
The cells were treated with antisense oligonucleotides in the presence of cationic lipids to facilitate the cellular uptake of oligonucleotides (22). Steady-state levels of MDM2 protein were determined by immunoprecipitation with an anti-MDM2 monoclonal antibody 2A10 (20), followed by Western blot using an anti-MDM2 polyclonal rabbit serum. After screening nine oligonucleotides, the oligonucleotide HDMAS5 (“AS5” in figures) was found to reproducibly decrease MDM2 protein levels in both cell lines 3–5-fold at concentrations of 100–400 nM (Fig. 1A). Optimal effect was observed using 200 nM HDMAS5. This effect was not observed with an oligonucleotide against an unrelated ion channel gene (K) or a HDMAS5 mismatch control oligonucleotide containing 4 base mismatches with the same target (M4).
Figure 1.
(A) Inhibition of MDM2 expression by antisense oligonucleotides. JAR cells were treated with MDM2 antisense phosphorothioate oligonucleotides for 18 h. Identical amounts of total protein were immunoprecipitated using anti-MDM2 monoclonal antibody 2A10; the immunoprecipitates were then analyzed by Western blot using a rabbit anti-MDM2 serum. The oligonucleotide HDMAS5 (AS5) inhibited MDM2 expression by about 3-fold. M4 is a mutant oligonucleotide of HDMAS5 containing 4 base mismatches; K is an oligonucleotide against a kidney-specific ion channel gene. Relative MDM2 levels were determined by phosphoimaging. (B) Alteration of MDM2 mRNA by HDMAS5. RNA was isolated from JAR cells treated with antisense oligonucleotides for 18 h. Twenty micrograms of total RNA were run on a denaturing agarose gel, and MDM2 mRNA was detected by Northern blot hybridization. MDM2 mRNA from HDMAS5-treated cells had a reduced size but higher intensity. The filter was subsequently probed for GAPDH mRNA to normalize loading. (C) Induction of p21/WAF1 expression by HDMAS5. JAR cells treated with oligonucleotides were analyzed by immunoprecipitation followed by Western blotting using a rabbit anti-human p21/WAF1 serum. p21/WAF1 expression was induced up to 6.6-fold by HDMAS5.
Antisense oligodeoxynucleotides often act by inducing RNase H cleavage of the target mRNA at the heteroduplex region, resulting in truncation and further degradation. To determine the inhibitory mechanism of HDMAS5, total mRNA was isolated from JAR cells treated with the oligonucleotide, and MDM2 mRNA was detected by Northern blot hybridization. Treatment with HDMAS5 caused a slight decrease in the molecular weight of MDM2 mRNA (Fig. 1B). This is consistent with RNase H cleavage at the target of HDMAS5 (∼700 nucleotides from the 5′ end), which would reduce the molecular weight of the mRNA (∼5500 nucleotides) (3) by ∼12%. There was also an increase in the intensity of the MDM2 mRNA band (∼2.5-fold), suggesting that transcription of MDM2 was induced by HDMAS5. This may be a result of p53 activation due to decreased MDM2 protein levels. Similar results were also obtained using the SJSA cells (data not shown).
To further determine whether p53 activity was elevated after treatment with HDMAS5, the protein expression level of a p53-inducible gene, p21/WAF1 (23), was examined by Western blot using a polyclonal rabbit serum against human p21. A dose-dependent induction of p21 expression by HDMAS5 was observed, up to 6.6-fold at the optimal concentration of 200 nM (Fig. 1C). The nonspecific or mismatch control oligonucleotides (K and M4) did not significantly induce expression of p21. Treatment of the p53-null tumor cell line H1299 with HDMAS5 did not induce p21 expression (data not shown). This suggests that p53 transcription activity was increased following inhibition of MDM2 expression.
Activation of p53 Transcription Function.
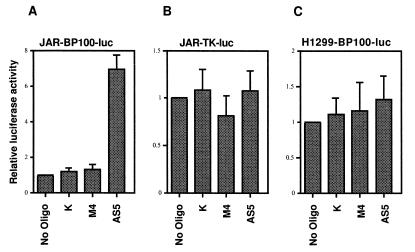
To directly measure p53 transcriptional activity, a p53-responsive luciferase reporter BP100-luc, containing the p53 binding site from intron I of the MDM2 gene (6), was transfected into JAR cells with a neomycin-resistant marker plasmid. Stable G418-resistant colonies were pooled and treated with HDMAS5. HDMAS5 reproducibly induced BP100-luc expression up to 7-fold (Fig. 2A). Control oligonucleotides caused little or no increase in p53 activity. A luciferase gene driven by the thymidine kinase gene promoter (tk-luc, unresponsive to p53) stably transfected into JAR cells was not activated by HDMAS5 (Fig. 2B). HDMAS5 also did not activate BP100-luc transfected into H1299 cells, a p53-null lung tumor cell line (Fig. 2C). Similar effects of HDMAS5 were also observed using the SJSA cells (data not shown). These results demonstrate that HDMAS5 can specifically activate p53 in cell lines overexpressing MDM2.
Figure 2.
Activation of a p53-responsive reporter gene by HDMAS5. JAR cells stably transfected with the p53-inducible BP100-luciferase plasmid (JAR-BP100-luc) were treated with 200 nM oligonucleotide for 24 h. Luciferase activities in the treated cells were determined and shown as luciferase activity/unit protein. HDMAS5 activated the p53-responsive reporter expression by 7-fold. JAR cells stably transfected with a luciferase reporter driven by the tk promoter (JAR-TK-luc) and H1299 cells (p53-null) stably transfected with BP100-luciferase (H1299-BP100-luc) were tested similarly. HDMAS5 did not activate the reporters in these controls. The results are the average of at least four experiments for each data point.
Mechanism of p53 Activation.
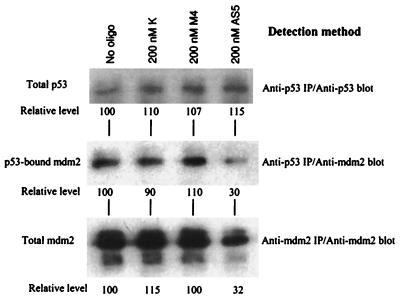
MDM2 inhibits p53 by directly binding to its transactivation domain (20, 24). This may block the function of this domain or increase the degradation rate of p53 (25–27). To further delineate the mechanism of p53 activation by HDMAS5, protein lysates from JAR cells treated with HDMAS5 were immunoprecipitated using an anti-p53 antibody Pab421. Both the p53 protein level and the amount of coprecipitated MDM2 were then detected by Western blot using anti-p53 or anti-MDM2 antibodies. Consistent with the assumption that p53 is inactivated by the overexpressed MDM2, significant amounts of MDM2 were found to coprecipitate with p53 in the untreated JAR cells. p53 level did not change significantly after treatment with the antisense oligonucleotides (Fig. 3). However, the amount of MDM2 coprecipitated with p53 was significantly reduced after treatment with HDMAS5. The levels of both p53-bound MDM2 and total MDM2 were reduced by 3-fold in this experiment. These results indicate that (i) inhibition of MDM2 expression decreased the amount of MDM2–p53 complex and (ii) HDMAS5 activates p53 mainly by increasing the level of free (functional) p53 but not total p53 protein.
Figure 3.
Reduction of p53–MDM2 complex by HDMAS5. Protein lysates from JAR cells treated with antisense oligonucleotides were immunoprecipitated with an anti-p53 monoclonal antibody Pab421. The immunoprecipitates were run on an SDS-PAGE, transferred to a filter, and blotted with Pab421 (Top) to detect p53 level or anti-MDM2 serum (Middle) to detect the coprecipitated MDM2. p53 level did not change after HDMAS5 treatment. The amount of MDM2 coprecipitated with p53 was reduced by HDMAS5. Total MDM2 levels were also determined by immunoprecipitating with 2A10 and blotting with anti-MDM2 serum (Bottom). The lower molecular weight MDM2 species (Bottom) do not contain an intact p53 binding domain and were not coprecipitated with p53 (40).
Induction of Apoptosis.
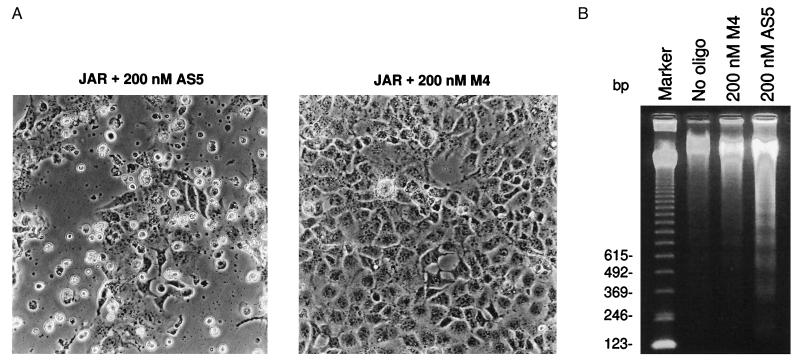
JAR cells treated with HDMAS5 also showed significant increase in apoptosis. Cells exhibiting a blebbing of the cellular membrane began to appear after incubation with the antisense oligonucleotide for 8 h (Fig. 4A). Incubation with the oligonucleotide for 24 h or longer resulted in ∼80% loss of attached cells. Control oligonucleotides caused significantly less cell death. Genomic DNA extracted from floating cells induced by HDMAS5 showed nucleosome-sized low molecular weight bands (Fig. 4B), characteristic of apoptosis. HDMAS5 did not cause visible apoptosis in the H1299 cells, which lacks p53 (data not shown). These results suggest that the apoptosis induced by HDMAS5 is due to activation of p53.
Figure 4.
Induction of apoptosis by HDMAS5. (A) Apoptotic morphology. JAR cells were treated with antisense oligonucleotides for 30 h and photographed using a phase-contrast microscope. HDMAS5 induced significant cell death. Dying cells show morphologies characteristic of apoptosis, such as membrane blebbing and shrinkage. The control oligonucleotide (M4) induced significantly less apoptosis. (B) Internucleosomal DNA cleavage in floating cells. JAR cells were treated with 400 nM antisense oligonucleotides for 24 h. Floating cells were harvested, and chromosomal DNA was extracted and analyzed by agarose gel electrophoresis.
Cooperation Between MDM2 Inhibition and DNA Damage.
The level of p53 protein and its transcriptional activity can be induced by DNA damage and is an important factor in mediating the cytotoxic effects of many cancer treatments, including chemotherapy and radiation (28, 29). To determine whether the presence of the MDM2 feedback loop limits the magnitude of p53 activation by DNA damage, we tested the ability of HDMAS5 to enhance DNA damage-induced activation of p53 and cell death.
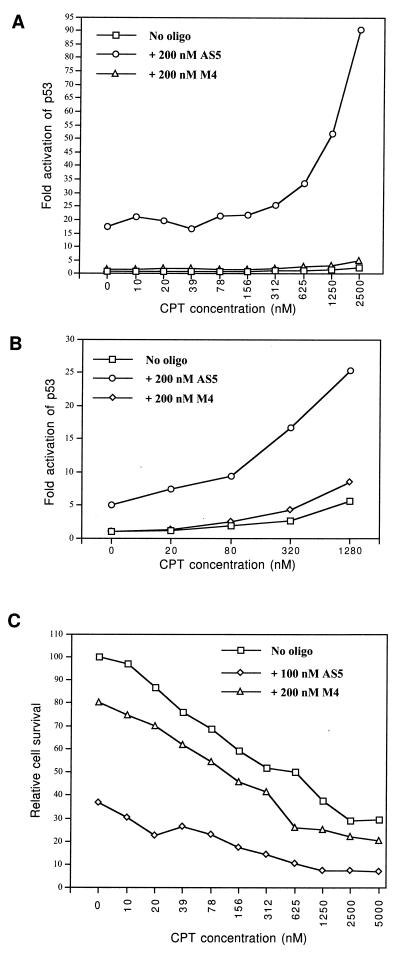
JAR cells containing stably integrated BP100-luc reporter were treated with CPT, a topoisomerase I inhibitor that causes DNA strand breaks (30). CPT alone activated the p53-responsive reporter 3–4-fold after 48 h of incubation (Fig. 5A). Incubation with 200 nM HDMAS5 alone for 48 h resulted in a 17-fold activation of p53. However, coincubation with CPT and HDMAS5 resulted in up to a 90-fold induction of p53 activity in the JAR cells. A similar synergistic effect between HDMAS5 and CPT was also observed in the MCF-7 cells, a breast tumor cell line with wild-type p53 but no amplification of MDM2 (31, 32) (Fig. 5B). Coincubation with CPT and HDMAS5 (100 nM) also resulted in significantly increased cell death (Fig. 5C). Therefore, inhibition of MDM2 expression can synergistically cooperate with DNA damage to induce p53 transcriptional activity to high levels.
Figure 5.
Coactivation of p53 and induction of cell death by HDMAS5 and DNA damage. (A) JAR cells stably transfected with BP100-luc were treated with a topoisomerase I inhibitor, CPT, and oligonucleotides for 48 h. Induction of p53 activity was measured by luciferase assay and shown as luciferase activity/unit protein (average of two experiments). (B) MCF-7 cells were incubated for 24 h with CPT, BP100-luc, and CMV-lacZ reporter plasmids and oligonucleotides in the presence of cationic lipids. Relative luciferase activity was determined using β-galactosidase activity as an internal control. (C) JAR cells were incubated with CPT and 100 nM HDMAS5 for 48 h. Protein concentrations of attached cells were determined after removing floating apoptotic cells. The protein concentration of untreated sample was set as 100% survival.
DISCUSSION
In this study, we demonstrated that it is possible to inhibit expression of MDM2 in human tumor cells containing MDM2 gene amplifications using phosphorothioate oligodeoxynucleotides. Inhibition of MDM2 expression in these cells results in activation of p53 and can lead to apoptosis, an important tumor suppression activity of p53. The oligonucleotide HDMAS5 is effective at concentrations of 100–200 nM despite the overexpression due to gene amplification and autoactivation by p53.
The results also strongly suggest that HDMAS5 stimulates p53 by the antisense mechanism, as mismatch control oligonucleotide and oligonucleotide for an unrelated target have no effect on MDM2 or p53. Importantly, correlations were demonstrated between p53 activation and the ability of the oligonucleotide to alter the size of MDM2 mRNA, reduce MDM2 protein steady-state level, and reduce the amount of MDM2–p53 complex. Although short single strands of DNA (19–30-mer) can activate p53 DNA binding activity in vitro (33), the 20-mer control phosphorothioate oligodeoxynucleotides used in this study had no effect on p53 activity when introduced into the cells by lipofection. This could be due to the different chemical structure of the oligonucleotides or inaccessibility to p53.
DNA damage stimulates p53 mainly by increasing the level of p53 protein through stabilization (34). The mechanism by which the MDM2 antisense oligonucleotide activates p53 (i.e. reduction of the level of MDM2–p53 complex in the cell) suggests that antisense inhibition of MDM2 may synergistically enhance the p53-stimulatory effect of DNA damage. Cotreatment using HDMAS5 and the DNA-damaging drug CPT showed that the magnitude of p53 activation is comparable to a synergistic effect. Therefore, the ability of conventional chemotherapy to stimulate p53 in tumors may be significantly enhanced by simultaneously inhibiting MDM2.
The expression of MDM2 in cell culture is largely dependent on p53 activation; therefore, the MDM2 negative feedback mechanism in its simplest form will not be able to completely inactivate p53. The degree of feedback inhibition by MDM2 would be determined by the sensitivity of the MDM2 promoter to p53 induction. It is of interest to determine to what degree MDM2 inhibits p53 activity in the absence or presence of stress. Our results suggest that the MDM2 negative feedback loop strongly limits the level of p53 activity in the cell in the absence or presence of DNA damage. The suppressive effect of MDM2 is present in cells without MDM2 gene amplification because the p53 in MCF-7 cells can be activated 7-fold by inhibiting MDM2 expression [the MCF-7 MDM2 level is 20-fold lower than JAR cells (J. Chen, unpublished result)].
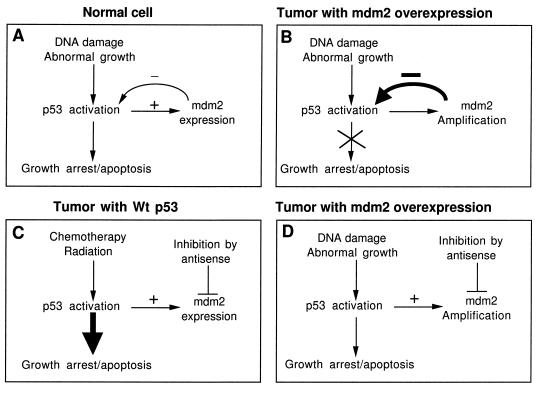
As summarized in Fig. 6, our results validate the hypothesis that MDM2 gene amplification in tumors results in inactivation of p53 (Fig. 6B) and reveal that the MDM2 negative feedback pathway is a major limiting factor in DNA damage-induced p53 activation (Fig. 6A). The inhibitory effect of MDM2 during DNA damage response can be detected in cells with or without MDM2 gene amplification (JAR and MCF-7). Therefore, in tumors overexpressing MDM2, inhibition of MDM2 expression alone may activate p53 to a level sufficient to induce apoptosis (Fig. 6D). In cells with functional p53 but no MDM2 overexpression, p53 can be more effectively stimulated by combining DNA damage with MDM2 inhibition (Fig. 6C).
Figure 6.
Potential therapeutic uses of the MDM2 antisense oligonucleotide. (A) In normal cells, the p53 tumor suppressor protein is regulated by the MDM2 oncogene through a negative feedback mechanism. p53 induces MDM2 expression, and p53 is inactivated when MDM2 is overexpressed. (B) MDM2 is overexpressed in certain tumors and results in inactivation of p53. This may contribute to malignant growth. (C) Many cancer treatments work by causing DNA damage. Antisense inhibition of MDM2 in cells with wild-type p53 can significantly enhance p53 activity. (D) In tumors with MDM2 overexpression, antisense inhibition of MDM2 alone may activate p53 to a level sufficient for tumor inhibition.
Several types of tumors (osteosarcomas, gliomas, breast tumors, lymphomas) often overexpress MDM2 (19, 35–37). Antisense inhibition of MDM2 in these tumors should re-activate p53 and reduce other p53-independent oncogenic activities of MDM2 (12, 13, 38). Furthermore, about 50% of tumors still contain wild-type p53 (39); treatment of these tumors with DNA-damaging drugs may benefit from antisense inhibition of MDM2. Gene therapy involving introduction of p53 into p53-deficient tumors may also benefit from inhibition of the MDM2 negative feedback loop.
Inhibition of MDM2 may be inherently selective against tumors, as p53 activation often causes growth arrest in nontransformed cells and apoptosis in transformed cells. The p53-independent functions of MDM2 are dispensable for survival in the mouse (9, 10); therefore, nonmalignant cells may tolerate temporary loss of MDM2.
Acknowledgments
We thank W. Gallaher, R. Luftig, and M. Freistadt for critical reading of the manuscript. We also thank W. Vedeckis for use of equipment. This work is partly supported by institutional funding from LSUMC, Stanley S. Scott Cancer Center, and a National Institutes of Health Grant CA72915 (J.C.).
Footnotes
This paper was submitted directly (Track II) to the Proceedings Office.
Abbreviations: MDM2, mouse double minute 2; CPT, camptothecin; FBS, fetal bovine serum; DMSO, dimethyl sulfoxide.
References
- 1.Fakharzadeh S S, Trusko S P, George D L. EMBO J. 1991;10:1565–1569. doi: 10.1002/j.1460-2075.1991.tb07676.x. [DOI] [PMC free article] [PubMed] [Google Scholar]
- 2.Finlay C A. Mol Cell Biol. 1993;13:301–306. doi: 10.1128/mcb.13.1.301. [DOI] [PMC free article] [PubMed] [Google Scholar]
- 3.Oliner J D, Kinzler K W, Meltzer P S, George D L, Vogelstein B. Nature (London) 1992;358:80–83. doi: 10.1038/358080a0. [DOI] [PubMed] [Google Scholar]
- 4.Cordon Cardo C, Latres E, Drobnjak M, Oliva M R, Pollack D, Woodruff J M, Marechal V, Chen J, Brennan M F, Levine A J. Cancer Res. 1994;54:794–799. [PubMed] [Google Scholar]
- 5.Momand J, Zambetti G P, Olson D C, George D, Levine A J. Cell. 1992;69:1237–1245. doi: 10.1016/0092-8674(92)90644-r. [DOI] [PubMed] [Google Scholar]
- 6.Wu X, Bayle J H, Olson D, Levine A J. Genes Dev. 1993;7:1126–1132. doi: 10.1101/gad.7.7a.1126. [DOI] [PubMed] [Google Scholar]
- 7.Barak Y, Juven T, Haffner R, Oren M. EMBO J. 1993;12:461–468. doi: 10.1002/j.1460-2075.1993.tb05678.x. [DOI] [PMC free article] [PubMed] [Google Scholar]
- 8.Oca Luna R M, Wagner D S, Lozano G. Nature (London) 1995;378:203–206. doi: 10.1038/378203a0. [DOI] [PubMed] [Google Scholar]
- 9.Jones S N, Roe A E, Donehower L A, Bradley A. Nature (London) 1995;378:206–208. doi: 10.1038/378206a0. [DOI] [PubMed] [Google Scholar]
- 10.Chen C Y, Oliner J D, Zhan Q, Fornace A J, Jr, Vogelstein B, Kastan M B. Proc Natl Acad Sci USA. 1994;91:2684–2688. doi: 10.1073/pnas.91.7.2684. [DOI] [PMC free article] [PubMed] [Google Scholar]
- 11.Chen J, Wu X, Lin J, Levine A J. Mol Cell Biol. 1996;16:2445–2452. doi: 10.1128/mcb.16.5.2445. [DOI] [PMC free article] [PubMed] [Google Scholar]
- 12.Xiao Z, Chen J, Levine A J, Modjtahedi N, Xing J, Sellers W R, Livingston D M. Nature (London) 1995;375:694–698. doi: 10.1038/375694a0. [DOI] [PubMed] [Google Scholar]
- 13.Martin K, Trouche D, Hagemeier C, Sorensen T S, La Thangue N B, Kouzarides T. Nature (London) 1995;375:691–694. doi: 10.1038/375691a0. [DOI] [PubMed] [Google Scholar]
- 14.Marechal V, Elenbaas B, Piette J, Nicolas J, Levine A J. Mol Cell Biol. 1994;14:7414–7420. doi: 10.1128/mcb.14.11.7414. [DOI] [PMC free article] [PubMed] [Google Scholar]
- 15.Elenbaas B, Matthias D, Roth J, Shenk T, Levine A J. Mol Med. 1996;2:439–451. [PMC free article] [PubMed] [Google Scholar]
- 16.Fiddler T A, Smith L, Tapscott S J, Thayer M J. Mol Cell Biol. 1996;16:5048–5057. doi: 10.1128/mcb.16.9.5048. [DOI] [PMC free article] [PubMed] [Google Scholar]
- 17.Erhardt P, Tomaselli K J, Cooper G M. J Biol Chem. 1997;272:15049–15052. doi: 10.1074/jbc.272.24.15049. [DOI] [PubMed] [Google Scholar]
- 18.Chen L, Marechal V, Moreau J, Levine A J, Chen J. J Biol Chem. 1997;272:22966–22973. doi: 10.1074/jbc.272.36.22966. [DOI] [PubMed] [Google Scholar]
- 19.Leach F S, Tokino T, Meltzer P, Burrell M, Oliner J D, Smith S, Hill D E, Sidransky D, Kinzler K W, Vogelstein B. Cancer Res. 1993;53:2231–2234. [PubMed] [Google Scholar]
- 20.Chen J, Marechal V, Levine A J. Mol Cell Biol. 1993;13:4107–4114. doi: 10.1128/mcb.13.7.4107. [DOI] [PMC free article] [PubMed] [Google Scholar]
- 21.Landers J E, Haines D S, Strauss J F, George D L. Oncogene. 1994;9:2745–2750. [PubMed] [Google Scholar]
- 22.Bennett C F, Chiang M Y, Chan H, Shoemaker J E, Mirabelli C K. Mol Pharmacol. 1992;41:1023–1033. [PubMed] [Google Scholar]
- 23.El-Deiry W S, Tokino T, Velculescu V E, Levy D B, Parsons R, Trent J M, Lin D, Mercer W E, Kinzler K W, Vogelstein B. Cell. 1993;75:817–825. doi: 10.1016/0092-8674(93)90500-p. [DOI] [PubMed] [Google Scholar]
- 24.Oliner J D, Pietenpol J A, Thiagalingam S, Gyuris J, Kinzler K W, Vogelstein B. Nature (London) 1993;362:857–860. doi: 10.1038/362857a0. [DOI] [PubMed] [Google Scholar]
- 25.Chen J, Lin J, Levine A J. Mol Med. 1995;1:142–152. [PMC free article] [PubMed] [Google Scholar]
- 26.Haupt Y, Maya R, Kazaz A, Oren M. Nature (London) 1997;387:296–299. doi: 10.1038/387296a0. [DOI] [PubMed] [Google Scholar]
- 27.Kubbutat M H G, Jones S N, Vousden K H. Nature (London) 1997;387:299–303. doi: 10.1038/387299a0. [DOI] [PubMed] [Google Scholar]
- 28.Lowe S W, Bodis S, McClatchey A, Remington L, Ruley H E, Fisher D E, Housman D E, Jacks T. Science. 1994;266:807–810. doi: 10.1126/science.7973635. [DOI] [PubMed] [Google Scholar]
- 29.Lowe S W, Ruley H E, Jacks T, Housman D E. Cell. 1993;74:957–967. doi: 10.1016/0092-8674(93)90719-7. [DOI] [PubMed] [Google Scholar]
- 30.Hsiang Y H, Hertzberg R, Hecht S, Liu L F. J Biol Chem. 1985;260:14873–14878. [PubMed] [Google Scholar]
- 31.Takahashi K, Sumimoto H, Suzuki K, Ono T. Mol Carcinogen. 1993;8:58–66. doi: 10.1002/mc.2940080112. [DOI] [PubMed] [Google Scholar]
- 32.Sheikh M S, Shao Z, Hussain A, Fontana J A. Cancer Res. 1993;53:3226–3228. [PubMed] [Google Scholar]
- 33.Srivastava S, Zou Z, Pirollo K, Blattner W, Chang E H. Nature (London) 1990;348:747–749. doi: 10.1038/348747a0. [DOI] [PubMed] [Google Scholar]
- 34.Kuerbitz S J, Plunkett B S, Walsh W V, Kastan M B. Proc Natl Acad Sci USA. 1992;89:7491–7495. doi: 10.1073/pnas.89.16.7491. [DOI] [PMC free article] [PubMed] [Google Scholar]
- 35.Reifenberger G, Liu L, Ichimura K, Schmidt E E, Collins V P. Cancer Res. 1993;12:2736–2739. [PubMed] [Google Scholar]
- 36.Bueso-Ramos C E, Yang Y, deLeon E, McCown P, Stass S A, Albitar M. Blood. 1993;82:2617–2623. [PubMed] [Google Scholar]
- 37.Bueso-Ramos C E, Manshouri T, Haidar M A, Yang Y, McCown P, Ordonez N, Glassman A, Sneige N, Albitar M. Breast Cancer Res Treat. 1996;37:179–188. doi: 10.1007/BF01806499. [DOI] [PubMed] [Google Scholar]
- 38.Lundgren K, Montes de Oca Luna R, McNeill Y B, Emerick E P, Spencer B, Barfield C R, Lozano G, Rosenberg M P, Finlay C A. Genes Dev. 1997;11:714–725. doi: 10.1101/gad.11.6.714. [DOI] [PubMed] [Google Scholar]
- 39.Hollstein M, Rice K, Greenblatt M S, Soussi T, Fuchs R, Sorlie T, Hovig E, Smith-Sorensen B, Montesano R, Harris C C. Nucleic Acids Res. 1994;22:3551–3555. [PMC free article] [PubMed] [Google Scholar]
- 40.Olson D C, Marechal V, Momand J, Chen J, Romocki C, Levine A J. Oncogene. 1993;8:2353–2360. [PubMed] [Google Scholar]


